VYSOKÉ UČENÍ TECHNICKÉ V BRNĚ
|
|
|
- Radovan Kolář
- před 4 lety
- Počet zobrazení:
Transkript
1 VYSOKÉ UČENÍ TECHNICKÉ V BRNĚ BRNO UNIVERSITY OF TECHNOLOGY FAKULTA CHEMICKÁ ÚSTAV FYZIKÁLNÍ A SPOTŘEBNÍ CHEMIE FACULTY OF CHEMISTRY INSTITUTE OF PHYSICAL AND APPLIED CHEMISTRY SELF-CLEANING PROPERTIES OF THIN PRINTED LAYERS OF TITANIUM DIOXIDE DIZERTAČNÍ PRÁCE DOCTORAL THESIS AUTOR PRÁCE AUTHOR Ing. MARCELA ČERNÁ BRNO 2012
2 VYSOKÉ UČENÍ TECHNICKÉ V BRNĚ BRNO UNIVERSITY OF TECHNOLOGY FAKULTA CHEMICKÁ ÚSTAV FACULTY OF CHEMISTRY INSTITUTE OF SELF-CLEANING PROPERTIES OF THIN PRINTED LAYERS OF TITNIUM DIOXIDE SAMOČISTÍCÍ VLASTNOSTI TENKÝCH TIŠTĚNÝCH VRSTEV OXIDU TITANIČITÉHO DIZERTAČNÍ PRÁCE DOCTORAL THESIS AUTOR PRÁCE AUTHOR VEDOUCÍ PRÁCE SUPERVISOR Ing. MARCELA ČERNÁ Doc. Ing. MICHAL VESELÝ, CSc. BRNO 2012
 Study field: Physical Chemistry (1404V001) Head of thesis: doc. Ing. Michal Veselý, CSc.")
3 Brno University of Technology Faculty of Chemistry Purkyňova 464/118, Brno 12 Doctoral thesis Assignment Number of doctoral thesis: FCH-DIZ0061/2011 Academic year: 2011/2012 Institute: Institute of Physical and Applied Chemistry Student: Ing. Marcela Černá Study programme: Physical Chemistry (P1404) Study field: Physical Chemistry (1404V001) Head of thesis: doc. Ing. Michal Veselý, CSc. Supervisors: Title of doctoral thesis: Self-cleaning properties of thin printed layers of titanium dioxide Doctoral thesis assignment: Preparation of thin titanium dioxide layers by printing of nanocrystalline particles and by CVD method. Study of physico-chemical properties and photocatalytic activity of prepared layers. Deadline for doctoral thesis delivery: Doctoral thesis is necessary to deliver to a secreatry of institute in three copies and in an electronic way to a head of doctoral thesis. This assignment is enclosure of doctoral thesis Ing. Marcela Černá doc. Ing. Michal Veselý, CSc. prof. Ing. Miloslav Pekař, CSc. Student Head of thesis Head of institute In Brno, prof. Ing. Jaromír Havlica, DrSc. Dean
4 ABSTRACT Titanium dioxide was immobilized on soda-lime glass substrates and glassy carbon substrates by two techniques: material printing and chemical vapour deposition. Two methods of sol preparation were used; sol-gel and hydrothermal synthesis. Morphology of all prepared titania layers were studied by scanning electron microscopy and atomic force microscopy analysis. Crystallite phase of prepared TiO 2 was determined using XRD analysis. Photoinduced superhydrophilicity was examined using the sessile drop method. Photocatalytic activity was investigated as a degradation rate of 2,6-dichloroindophenol or formic acid. We studied the influence of sol-loading and amount of PEG on final activity in case of sol-gel process. PEG was added as an anticracking agent. The influence of time and temperature of hydrothermal synthesis or amount of layers on final efficiency was examined for hydrothermally synthesized samples. The influence of different intensities of irradiation was investigated for the layers deposited by CVD process. The activity of titania thin films prepared by material printing and CVD process was compared and the best sample was evaluated. KEY WORDS titanium dioxide, hydrothermal process, photocatalysis, self-cleaning surfaces, nanoparticles, material printing
5 ABSTRAKT Tenké vrstvy oxidu titaničitého byly imobilizovány na sodnovápenatá skla a skelný uhlík použitím jak techniky materiálového tisku tak metodou chemického napařování. Pro přípravu titaničitých solů byly použity metody sol-gelu a nebo hydrotermální syntézy. Struktura připravených vrstev byla zkoumána rastrovací elektronovou mikroskopií a mikroskopií atomárních sil. Krystalická struktura připravených TiO 2 byla analyzovány pomocí XRD metody. Fotoindukováná superhidrofility pripravených vzorků byla charakterizována měřením kontaktních úhlů. Fotokatalytická aktivity připravených vzorků byla testována na fotokatalytické oxidaci 2,6- dichlorindofenolu a kyseliny mravenčí. V případě sol-gel vrstev byl zkoumán vliv množství naneseného TiO 2 a množství PEG, který byl do solu přidán jako praskliny potlačující činidlo. V případě hydrotermálních vrstev byl zkoumán vliv času a teploty syntézy a množství vrstev na výslednou účinnost vzorku. U chemicky napařených vzorků byl zjišťován vliv intenzity záření. Byla porovnána fotokatalitická aktivita vrstev připravených materiálovým tiskem a chemickým napařováním a byl vyhodnocen nejaktivnější vzorek. KLÍČOVÁ SLOVA oxid titaničitý, hydrotermální proces, fotokatalýza, samočisticí povrchy, nanočástice, materiálový tisk 4
6 ČERNÁ, M. Samočistící vlastnosti tenkých tištěných vrstev oxidu titaničitého. Brno: Vysoké učení technické v Brně, Fakulta chemická, s. Vedoucí dizertační práce doc. Ing. Michal Veselý, CSc. DECLARATION I declare that the doctoral thesis has been elaborates by myself and all the quotations from the used literary sources are accurate and complete. The content of the doctoral thesis is the property of the Faculty of Chemistry of Brno University of Technology and all commercial uses are allowed only if approved by the supervisor and the dean of the Faculty of Chemistry, BUT. Student s signature In this place, I sincerely thank to my supervisor Doc. Ing. Michal Veselý, CSc. for his advices and help during all my doctoral study. Sincere acknowledgement belongs to Dr. Chantal Guillard and Eric Puzenat for the possibility to work in their laboratory at Université Claude Bernard Lyon 1. I thank also to Mrs. Claire Tendero, Mr. Pierre Gros, Mrs. Katia Fajerwerg and Mr. David Evrard for their help and advices during the work in their laboratory in CIRIMAT-INPT, ENSIACET in Toulouse. My words of thanks are also addressed to my colleagues from laboratory of photochemistry; especially to Ing. Petr Dzik Ph.D. for his big help during all work. Thanks to my friends and my family, to my mum and dad, my sister and especially to my best friend Patrik. 5
7 CONTENT 1 INTRODUCTION 9 2 THE TEORETICAL PART Photocatalysis Mechanism of heterogeneous photocatalysis Band gap energy Applications of photocatalysis Kinetics of photocatalytic reactions Langmuir-Hinshelwood kinetic mechanism Eley-Rideal kinetic mechanism Titanium dioxide Anatase Rutile Brookite Preparation of Titanium dioxide Methods of preparation TiO 2 sols Sol-gel process Hydrothermal synthesis Solvothermal routes Methods of preparation TiO 2 thin films Physical/chemical vapour deposition Wet-coating techniques Material printing Principles of characterization techniques Ultraviolet-visible spectroscopy Scanning electron microscopy Atomic force microscopy X-ray diffraction Transmission electron microscopy Photon correlation spectroscopy Superhydrophilic properties Photodegradation of water pollutant Formic acid Organic dye AIM OF THE EXPERIMENTAL WORK 45 4 EXPERIMENTAL SECTION Chemicals Used equipments Sol-gel process Synthesis of sol Study of viscosity and density Substrate pre-treatment
8 4.3.4 Material printing Characterization of TiO 2 thin layers Thickness measurement Optical microscopy Scanning electron microscopy Atomic force microscopy Photoinduced hydrophilicity Photocatalytic activity Hydrothermal synthesis Synthesis of colloidal TiO UV-VIS spectroscopy Gravimetric analysis X-ray diffraction Photon correlation spectroscopy Transmission electron spectroscopy Band gap energy Photocatalytic activity Printed layers of TiO 2 prepared by hydrothermal synthesis Preparation of printed titania thin films X-ray diffraction Optical properties Scanning electron microscopy Atomic force microscopy Photoinduced superhydrophilicity Photocatalytic activity Chemical vapour deposition Preparation of titania thin layers Gravimetric analysis X-ray diffraction Scanning electron microscopy Atomic force microscopy Photocatalytic activity RESULTS AND DISCUSSION Sol-gel process Study of viscosity and density Study of the thickness Optical microscopy Scanning electron microscopy Atomic force microscopy Photoinduced hydrophylicity Photocatalytic activity Hydrothermal synthesis Preparation of TiO 2 colloidal solution
9 5.2.2 UV-VIS spectroscopy Gravimetric analysis Study of crystallinity and crystallite size Evaluation of particle size Transmission electron microscopy Band gap energy Photocatalytic activity Printed layers of TiO 2 prepared by hydrothermal synthesis Preparation of thin titania films XRD analysis Optical microscopy Scanning electron microscopy Atomic force microscopy Photoinduced hydrophilicity Photocatalytic activity Samples prepared by CVD Preparation of samples Gravimetric analysis XRD analysis SEM analysis AFM analysis Investigation of photocatalytic activity CONCLUSION REFERENCES LIST OF ABBREVIATIONS 120 8
10 1 INTRODUCTION Environmental pollution is becoming more and more serious. The green house effect is brought about by increasing in carbon dioxide concentration in the atmosphere. This, as well as the acid rain, is closely related to the use of fossil fuels. In order to solve such environmental and energy resource problems, photocatalysis has been attracting a great deal of attention. 1 Among the semiconductors, titanium dioxide (TiO 2 ) is one of the most popular and promising materials as a photocatalyst because it is stable in various solvents under photoirradiation, available commercially and easy to prepare in the laboratory and has a potent ability to induce various types of redox reactions. Since the start of its commercial production in the early twentieth century, titanium dioxide (TiO 2 ) has been widely used as a pigment 2, in paints 3, toothpaste 4, and sunscreens 5, etc. In 1972, Fujishima and Honda discovered the photocatalytic splitting of water on TiO 2 electrodes under ultraviolet light. 6 Since this date, enormous efforts have been made to the research of TiO 2 material, which has led to many promising applications in areas ranging from photovoltaic to photocatalysis. 7, 8 These applications can be roughly divided into energy and environmental categories, many of which depend not only on the properties of the TiO 2 material itself but also on the modifications of the TiO 2 materials host (e.g., with inorganic and organic dyes) and on the interactions of TiO 2 materials with the environment. 9 As a promising photocatalyst, 10, 11 TiO 2 materials are expected to play an important role in helping to solve many environmental and pollution challenges; water and air purification, prevention of staining, and disinfection. Many approaches to improve the photocatalytic activity of TiO 2 have been tested. These studies proved that TiO 2 activity depends generally 12, 13 on its morphology, crystal composition, crystallinity and surface area. Ultraviolet radiation has been used for disinfection purposes since the early 20 th century. Nowadays, wastewater and drinking water disinfection are important technical applications of direct UV irradiation in the wavelength range between 240 nm and 290 nm. Other significant contributions of UV disinfection include the photo-inactivation of surface bound or airborne microorganisms by using TiO 2 based photocatalytic techniques or solar photocatalytic disinfection of water, which is of importance in tropical developing countries. 14 Titanium dioxide photocatalysts consists of nanometer scale particles which are either suspended or immobilized into the reactor. So far, mostly suspended systems have been used to investigate the degradation of a variety of components. However, the major drawback of suspended systems in practical applications is the costly separation step necessary after the purification. Therefore, an immobilized system is preferred for an efficient reactor scalable to industrial sizes, especially since the efficiency of the immobilized system can be comparable to that of the suspended system. 15 9

11 2 THE TEORETICAL PART 2.1 Photocatalysis Photocatalysis, i.e., catalysis under light radiation, is a reaction in the presence of a catalyst which causes the acceleration of the whole process. The main difference between the catalyst and photocatalyst is that a catalyst contains active sites on which substrate is converted into a products whereas no active sites are present on a photocatalyst (Fig. 1). Photocatalysis can be homogenous or heterogeneous. The homogenous photocatalysis is taking place in homogenous phase. The heterogeneous is carrying out at the interfacial boundary between two phases (solid-liquid, solid-gas, liquid-gas). 16 Fig. 1 Difference in concepts of catalytic and photocatalytic reaction Mechanism of heterogeneous photocatalysis The basic principles of heterogeneous photocatalysis can be summarized as follows. A semiconductor s electronic shell consists of valence band (vb), it is the highest occupied energy band, and of conduction band (cb), it is the lowest empty band. These energy bands are separated by a band gap. It is the region of forbidden energies. Fig. 2 Simplified diagram of the heterogeneous photocatalytic process occurring on an illuminated semiconductor particle 18 The initial process for heterogeneous photocatalysis of organic and inorganic compounds by semiconductors is the generation of electron hole pairs in the semiconductors particles
12 When a photon, with energy higher or equal to the band gap energy, is absorbed by a semiconductor particle, an electron from vb goes over to the cb with simultaneous generation of hole (h + ) in the vb. The electrons and holes are not localized in the valence and conduction bands. Therefore electrons and positives holes can migrate within a crystal. These electrons and holes can be trapped at the surface where they can react with donor (D) or acceptor (A) species adsorbed or close to the surface of the particle. In this way, anodic or cathodic redox reactions can be initiated (Fig. 2). On the other hand, apart from the trapping of the species, electrons and holes can recombine on the surface or in the bulk of the particle in a few nanoseconds; the energy is dissipated as heat. In a real system recombination occurs and concentration of electrons and holes on the surface is not equal. Obviously, this recombination is detrimental to the efficiency of the semiconductor photocatalyst. Modifications to semiconductors surfaces such as addition of metals, dopants, or combinations with other semiconductors are beneficial for decreasing the electron and hole recombination rate and thereby increasing the quantum yield of the photocatalytic process Band gap energy Band gap correspond to difference in potential of cb bottom and vb top. Optical band gap can be estimated form Kubelka Munk (K M) function which is defined as: 1 R s 2R d 2 d, (1) where R d is diffused reflectance, is absorption coefficient and s is scattering coefficient. For samples diluted with a medium of less photoabsorption, K M function can be a measure of sample concentration. The K M function is often recognized, through this requires assumptions, to be proportional to the absorption coefficient. Usually optical band gap is evaluated from the following relation, where scattering coefficient is supposed to be constant throughout a wavelength range for measurement. n h Eg (2) h In this equation, h is Planck constant, is oscillation frequency, E g is optical band gap and n is constant relating to a mode of transition. The constant n is 1/2, 3/2 or 2 for allowed direct transition, forbidden direct transition and indirect transition (Fig. 3). But the forbidden direct transition has often been neglected. 17 In indirect transition, the electron cannot shift from the lowest energy state in the conduction band to the highest energy state to valence band without a change in momentum (Fig. 3). In this case the band gap energy is analyzed from the following relation 20 by extrapolation to KM = 0. 1 h 2 f ( h ) KM (3) 11
13 Energy Energy In the case of the direct transition, the electron can shift from the lowest-energy state in the conduction band to the highest energy state to valence band without a change in momentum (Fig. 3). Here, the band gap energy is analyzed from other relation 20 by the same extrapolation as in previous case. 2 h f ( h ) KM. (4) The ability of a semiconductor to undergo photoinduced electron transfer to adsorbed species on its surface is governed by the band energy positions of the semiconductor and the redox potentials of the absorbate. The relevant potential level of acceptor species is thermodynamically required to be below (more positive than) the conduction band potential of the semiconductor. The potential level of the donor needs to be above (more negative than) the valence band position of the semiconductor in order to donate an electron to the vacant hole. The band edge positions for a few semiconductors are presented in Fig. 4. On the left side we can see the internal energy scale for comparison to vacuum level and on the right we can observe the scale for comparison to normal hydrogen electrode (NHE). The positions are derived from the flat band potentials in a contact solution of aqueous electrolyte at ph = 1. The ph of the electrolyte solution influences the band edge positions of the various semiconductors compared to the redox potentials for the absorbate. 19 Photo assisted transition momentum momentum Fig. 3 Indirect transition (left) and direct transition (right) 12
14 Fig. 4 Energies for various semiconductors in aqueous electrolytes at ph = 0 21 It is necessary to mention that there are a lot of factors which can influence the photocatalytic reaction rate, such as the life time of charge carriers, molecule adsorption and desorption kinetics on the surface, catalytic surface character, particle size and other. The most important factors influencing the reaction rate are semiconductor type and radiation which is used for its activation. The other very important factors are The ph of the solution which determines the surface charge on the semiconductor and the speciation of the substrate to be transformed The substrate concentration The adsorption process The temperature, high temperature generally leads to higher rates, because there is a higher frequency of collision between the substrate and the semiconductor. Nevertheless the optimum temperature for photocatalytic reaction was discovered to be 22, 23 between 20 and 80 C. The presence of metal cations and inorganic anions Applications of photocatalysis There are many applications of environmental photocatalysis that are already at or near the stage of implementation or commercialization. Some of them are summarized in Table 1. Photocatalysis belongs to the clean technologies; organic water pollutants are transformed into CO 2 and H 2 O. TiO 2 -coated substrate shows unexpectedly effective self cleaning effect in both ordinary indoor conditions and outdoor conditions. Particularly in the outdoor spaces, inorganic contaminants such as sand may be mainly responsible for stains, so photocatalytic oxidative power may not be considered useful for the self-cleaning process. However, it was found that TiO 2 -coated materials show very effective anti-fouling effect even against 13
15 inorganic substances. This is probably because such substances adhere on the substrate surface by oil spots, which serve as a binder. Therefore the decomposition of the oil also decreases the amount of inorganic materials bound to the surface. 1 Table 1 Selected application of photocatalysis Property Category Application Self-cleaning Air cleaning Water purification Materials for residential and office buildings Indoor and outdoor lamps and related systems Materials for roads Others Indoor air cleaners Outdoor air purification Drink water Others Exterior tiles, kitchen and bathroom components, interior furnishings, plastics surfaces, aluminium siding, building stone and curtains, paper window blinds 24 Translucent paper for indoor lamp covers, coatings on fluorescent lamps and highway tunnel lamp cover glass 25 Tunnel wall, soundproofed wall, traffic signs and reflectors 25 Tent material, cloth for hospital garments and uniforms and spray coating for cars 26 Room air cleaner, photocatalyst-equipped air conditioners and interior air cleaner for factories 27 Concrete for highways, roadways and footpaths, tunnel walls, soundproofed walls and building walls 28 River water, ground water, lakes and water storage tanks 29 Fish feeding tanks, drainage water and industrial wastewater 30 14
16 Antitumor activity Cancer therapy 31 Endoscopic-like instruments Self-sterilizing Hospital Others Tiles to cover the floor and walls of operating rooms, silicone rubber for medical catheters and hospital garments and uniforms 32 Public rest rooms, bathrooms and rat breeding rooms Kinetics of photocatalytic reactions Photocatalytic reactions belong to the reactions which run on the interface of solution/photocatalyst. Interactions between charge carries and adsorbent reactant occur during the reaction, which evoke chemical changes of reactant. Thus, photocatalytic reaction involving light absorption by a catalyst includes processes of adsorption and desorption. 33 Photocatalytic reaction takes place in the following five steps: 34 Transport of reagents in liquid (or gaseous) phase to the photocatalyst surface Adsorption of reagents onto the photocatalyst surface Chemical reaction on the surface of photocatalyst Desorption of created products from the surface Products transport to the liquid (gaseous) phase All of these mentioned steps can considerably influence the final process rate. Transport of reagents to the photocatalyst surface is caused by convection and diffusion, which follows the Fick s laws. The overall reaction rate mainly depends on the adsorption of reactants rather than the actual chemical reaction on the photocatalyst surface because the rate of transport is higher than reaction rate in reactor. So it is not the rate limiting step. There are few kinetics models which describe photocatalytic oxidation on irradiated photocatalysts Langmuir-Hinshelwood kinetic mechanism Consider that only two reactants take part in the reaction on the surface of photocatalyst. The most common surface reaction mechanism is that where both reactants are adsorbed on the surface and subsequently they collide and create products. This is known as the Langmuir- Hinshelwood mechanism. It was derived from ideas proposed by Hinshelwood based on Lanqmuir s principles for adsorption
17 This mechanism is based on the following hypotheses Surface is homogeneous Adsorption occurs only on the specific places of surface Each active center use only one molecule of adsorbed reactant Adsorbed molecules do not react with each other Only monolayer is formed during the adsorption process The photocatalytic surface reaction mechanism is based on the reaction between a molecule of semiconductor and an atom of molecule adsorbed to the surface of this semiconductor. 36 Therefore, these reactions run according to 2 nd order kinetics: k A B P (5) The reaction rate in this case is given by the following formula: v k (6) A The Langmuir isotherm implies: B K c A A A (7) 1 K A c A KB cb K c B B B, (8) 1 K A c A KB cb where K A and K B are adsorption constants for reactant A and B, A and B are coverage of the photocatalyst surface by reactants A and B. By applying the expressions (7) and (8) to the expression (6), we get the following equation for the reaction rate: v k K A K c K c K c 2 1 A A B B B A c B The rate constant k and adsorption constant K A and K B are thermally dependent. Analysis of heterogeneous kinetics of photocatalytic reaction can be simply quantified by the rate equation; by Langmuir-Hinshelwood equation: 37 k K c v 1 K c At lower concentration, reaction can be simplified to the reaction of 1 st order: v k K c (11) (9) (10) 16

 The final reaction rate depends on the concentration of species B (non-adsorbed compound) in the solution, or on the partial pressure if the compound B is in gaseous phase and on")
18 Eley-Rideal kinetic mechanism This mechanism describes the situation where are already adsorbed molecules of substance A on the surface and these molecules get into contact with molecules of substance B which come to the surface from gaseous or liquid phase. 37 A ads k B P (12) The final reaction rate depends on the concentration of species B (non-adsorbed compound) in the solution, or on the partial pressure if the compound B is in gaseous phase and on the coverage degree of the photocatalyst surface by adsorbed substance A: v k (13) A c A The reaction rate can be described by the concentration of the compound A, if its adsorption isotherm is known. When the adsorption of compounds A follows the Langmuir isotherm, the reaction rate can be expressed by the equation: k K c A c v 1 K c 2.2 Titanium dioxide A B In nature, titanium dioxide exists in three crystalline modifications, anatase (tetragonal), rutile (tetragonal) and brookite (orthorhombic). Apart from these three natural forms, there are four other artificial titanium dioxide modifications which can be prepared by hydrothermal 38, 39 synthesis under high pressure. They are TiO 2 -B, ramsdellite, hollandite and TiO 2 -II. The most common crystallized phase is rutile. Anatase and brookite both convert to rutile upon heating Anatase The anatase phase shows a higher photocatalytic activity that rutile due to its low recombination rate of photo-generated electrons and holes. 19, 41, 42 The band gap energy of this titanium oxide modification is 3.23 ev, corresponding to the wave length of 384 nm. Pure anatase can be synthesized by many ways; using an alkoxide precursor, anatase is formed by the hydrolytic reaction in aqueous solutions of a variety of acids or bases. 43 (14) Fig. 5 TiO 2 in crystalline modification of anatase 17 44, 45
19 Intensity (a.u.) Intensity (a.u.) The crystallite phase of a laboratory prepared TiO 2 can be identified by Raman spectroscopy. Typical spectrum for pure anatase from Raman spectroscopy can be observed in (Fig. 6). The characteristic peaks are in positions 143, 197, 395, 517 and 638 cm The crystallinity of synthesized TiO 2 can be evaluated by X-ray diffraction. The XRD spectrum for pure anatase is shown in Fig. 7. The highest intensity have the peak (101), its intensity is always 100 %. 2 of this peak is equal to and the width of this peak is important for calculation of the crystallite size. 1.2 anatase Raman shift (cm 1 ) Fig. 6 Raman spectrum for anatase anatase Fig. 7 XRD spectrum of pure anatase
 isopropoxide in nitric acid at ph = 0.5.")

20 Intensity (a.u.) Rutile Rutile is thermodynamically stable form while the other two phases are metastable ones. 48 The band gap energy of this crystalline phase is 3.02 ev, corresponding to the wave length of 411 nm. Pure rutile nanoparticles have been prepared from TiCl 4 or TiCl 3 in HCl solution or from titanium (IV) isopropoxide in nitric acid at ph = , 50, 45 Fig. 8 TiO 2 in crystalline modification of rutile As in previous cases the crystallinity of prepared TiO 2 can be studied by Raman spectroscopy or by X-ray diffraction. The Raman spectrum for rutile is depicted at Fig. 9. The characteristic peaks in Raman spectra have the position 230, 447 and 612 cm 1. In the XRD spectrum, the peak with 100 % intensity is peak (110) and the position of this peak (2 is equal to This peak is used for calculation of the crystallite size. rutile Raman shift (cm 1 ) Fig. 9 Raman spectrum for pure rutile 47 19


21 Intensity (a.u.) rutile Fig. 10 XRD spectrum for pure rutile Brookite Brookite phase is stable only at very low temperatures and hence not so useful practically. Moreover, it features a very low band gap energy which could contribute to a higher rate of recombination reaction. The exact value of band gaps is not known but Zallen et al. in their study discovered that the brookite form of TiO 2 is an indirect-gap semiconductor with a band gap of about 1.9 ev. 51 Pure brookite particles have been prepared using amorphous titania as the starting material and hydrothermal treatment with NaOH 52 or by thermolysis of TiCl 4 in aqueous HCl solution , 54 Fig. 11 TiO 2 in crystalline modification of brookite 20
22 Intensity (a.u.) Intensity (a.u.) brookite Raman shift (cm 1 ) Fig. 12 Raman spectrum for pure brookite 47 A typical Raman spectrum for pure brookite is shown in Fig. 12. The positions of characteristic peaks are following; 127, 150, 250, 320, 365, 406, 458, 538, 640. XRD spectra can be observed in Fig. 13. The peak with intensity 100 % is peak 210, the angle of which equals This peak is again the most important for the calculation of the crystallite size. brookite Fig. 13 XRD spectrum for pure brookite 47 Degussa P25 is one of the most common commercial titanium semiconductor types. This type of TiO 2 is produced through a high temperature (greater than 1200 C) flame hydrolysis of TiCl 4 in the presence of hydrogen and oxygen. The TiO 2 is treated with steam to remove HCl which is also produced as a by-product of the reaction. The product is 99.5% pure TiO 2 (anatase : rutile ratio, 70 : 30), which is non-porous, with cubic particles with rounded edges
23 It is not surprising that the different samples of titanium dioxide exhibit different photocatalytic activity towards the same organic substrate under same reaction conditions. 56 These differences can be qualitatively attributed to the differences in crystallinity, morphology, specific surface area, particle aggregate size and surface density of OH groups in the TiO 2 samples. On the other hand, it may be surprising that a TiO 2 photocatalyst which is good at destroying one organic substrate can be ineffective at destroying another and that for a different sample of TiO 2 the situation can be reversed. The main advantages of using TiO 2 as photocatalyst are: Relatively high photoactivity Biological and chemical inertness Photostability (i.e. not liable to photoanodic corrosion for example) Exceptional optical and electronic properties Non-toxicity and relatively low cost 57, 58 The disadvantages of TiO 2 semiconductor photocatalysts include: The requirement of large amounts of TiO 2 photocatalysts Difficulty in re-cycling TiO 2 photocatalysts Problematic agglomeration of TiO 2 nanocrystals into large particles for better removing In the other size, TiO 2 have the tendency to lose efficiency when they agglomerate into larger particles The separation processes required to recover the TiO 2 at the end of the photocatalytic treatment and it is difficult to perform because of the small particles of TiO 2 and the high stability of the TiO 2 hydrocolloid 2.3 Preparation of Titanium dioxide Generally, two forms of TiO 2 in photocatalysis have been widely used; highly dispersed fine particles or suspended particles in liquid medium and thin films on supporting materials. 59 The main disadvantage of using the powder form of TiO 2 is the suspension instability in time. This instability is monitored by sedimentation due to the aggregation. The other very important disadvantage is the energy consumption for catalyst removal and recovery. Due to these reasons, it is obvious that the use of active immobilized photocatalyst is more popular than using of this catalyst in powder form. The photocatalyst can be immobilized onto a suitable inert support. In this case there is no need to remove the catalyst. Unfortunately, when the catalyst in immobilized, there is a decrease in the available surface area for the reaction since the catalyst must adhere to the solid support. 60 We have to point out, that in the case of immobilized photocatalyst, layer thickness is very important property of prepared films. When the photocatalyst films are too thick, most of the electrons and holes are generated deep in a semiconductor and never get up to the surface. So they are unable to participate in the reaction. On the other side, when the 22
24 layers are too thin, semiconductor can absorb only a very small amount of incident photons. The efficiency of photocatalytic process decreases as well Methods of preparation TiO 2 sols There are many methods of synthesizing TiO 2 nanostructures. Generally these methods can be divided to two main groups; solution routes and gas phase methods. The advantages of solution route are the control over the stochiometry, production of homogenous materials, ability to coat complex shapes and preparation of composite materials. The disadvantages include the use of expensive precursor, long processing times and the presence of carbon as an impurity. In the case of gas phase methods, the synthesis can be of chemical or physical nature Sol-gel process Sol-gel processing is one of the most common methods to produce photocatalyst TiO 2 in both forms; coating and powder. This process is categorized as a wet chemical method based on the hydrolysis and polycondensation of precursor. In a typical sol-gel process, a colloidal suspension, or a sol, is formed by the controlled hydrolysis and polycondensation reaction of precursors, which are usually inorganic metal salts or organometalic compounds. In this process, the liquid sol is transformed into a solid gel phase during the complete polymerisation and loss of solvent. The thin layers on the substrate can be produced by various coating techniques such as spin-coating or dipcoating. TiO 2 nanomaterials have been synthesized with the sol-gel method by the hydrolysis of titanium precursor. 62, 63, 64 This process normally proceeds via an acid-catalyzed hydrolysis step of titanium(iv) alkoxide followed by condensation. 65, 66 The development of Ti O Ti chains is supported by a low content of water, low hydrolysis rates, and excess titanium alkoxide in the reaction mixture. Three-dimensional polymeric skeletons with a close packing result from the development of Ti O Ti chains. The formation of Ti(OH) 4 is favored with high hydrolysis rates for a medium amount of water. The presence of a large quantity of Ti OH and insufficient development of three-dimensional polymeric skeletons lead to loosely packet first-order particles. Polymeric Ti O Ti chains are developed in the presence of a large excess of water. Closely packed first-order particles are yielded via a threedimensionally developed gel 67, 68 skeleton. The strong reactivity of the alkoxide towards water often results in an uncontrolled precipitation and limits the use of the sol-gel technology. These problems can be eliminated with the aid of chelating agents, such as acetyl acetone (AcAc) 69 and acetic acid. 70 These chemical additives react with alkoxides and modify the ligand structure, enabling the hydrolysis and polycondensation reactions to be controlled. 23
25 The interest in application of sol-gel method is due to its many advantages, such as: Possibility of preparation homogenous films Ease of composition control Low processing temperature Large area coatings No special equipment with low cost Preparation of films with high photocatalytic activity Hydrothermal synthesis Hydrothermal synthesis is widely used in industry to manufacture ultra-fine powders and particles. The process is usually realized in a steel pressure vessel called autoclave with or without Teflon or glass liners under controlled temperature and/or pressure with the reaction in aqueous solutions. The temperature can be elevated above the boiling point of water at standard conditions, reaching the pressure of vapour saturation. The temperature and the amount of solution added to the autoclave largely determine the internal pressure produces. It is a method that is widely used for the production of small particles, for the preparation of TiO 2 nanoparticles 71, 72, TiO 2 nanorods 73, 74, nanowires 75, 76, and nanotubes 77, 78. Hydrothermal treatment enhances the phase transformation of the TiO 2 powders from amorphous to crystallite phase, by re-crystallization and restructuring. The initial step in hydrothermal synthesis is the precipitation of the precursor solution, usually consisting of titanium alkoxide or halide. Prepared precipitate is mixed into aqueous slurry, possibly with the addition of a surfactant. The precursor slurry is then placed into an autoclave and heated to a given temperature over some period time. The precipitate formed is then collected either by filtration or centrifugation, washed with an appropriate solvent and dried. With this relative simplicity, hydrothermal reaction leads to the synthesis of various TiO 2 nanomaterials simply by varying the experimental parameters. The hydrothermal method of preparation TiO 2 particles has many advantages. A major advantage of using the hydrothermal process is the ability to produce different crystalline phases without the need of following heat treatment as it provides the capacity to grow goodquality crystals and to control the crystalline composition simultaneously. 79 The other very important feature is that the hydrothermal synthesis favours a decrease in agglomeration between particles, narrow particle size distributions, phase homogeneity, and controlled particle morphology. It also offers uniform composition, purity of the product, monodispersed particles, a control over the shape and size of the particles, and so on. The hydrothermal method has been evaluated as one of the best techniques to prepare TiO 2 particles of desired size and shape with homogeneity in composition and a high degree of crystallinity. Several authors studied in details the influence of different parameters on final properties of TiO 2. These include the starting materials (commercial, self-prepared, amorphous, crystalline anatase, rutile and brookite), sonication pre-treatment, hydrothermal temperature, treatment time, and post-treatment (washing, calcination). The characteristic and morphology 24
26 of titania such as specific surface area, crystal structure and others are dependent on the selected hydrothermal conditions. Effect of the starting materials A large amount of various compounds like rutile or anatase TiO 2, Degussa TiO 2 (P25) nanoparticles, layered titanate Na 2 Ti 3 O 7, Ti metal, TiOSO 4, TiOCl 2, molecular Ti IV alkoxide, dopped anatase TiO 2, or SiO 2 TiO 2 mixture can be used as the precursor for the preparation of TiO 2 by hydrothermal synthesis. Sol of titanium dioxide can also be utilized as the starting reactant in the hydrothermal process. Basically, using of different starting reagents cause formation of final TiO 2 with different particle size. 80 Effect of sonication pre-treatment Nawin and his colleagues analyzed the effect of sonication pretreatment on the control of titanate nanotubes length in the hydrothermal reaction. 81 Sonication causes breaking the intermolecular interaction between titanium dioxide particles and concentrated sodium or potassium hydroxide solution and thus speeds up the dispersion of nanoparticles in the hydrothermal process. When the samples are irradiated by ultra sound waves, the milky mixture becomes a smoother. The sonication step has a strong influence on the length distribution and the length of synthesized product. Thus, the average length of titanate nanotubes without sonication treatment is much shorter than with such a step in the hydrothermal process. Sonication aids to migrate the OH or Na + (K + ) ions across the restrict interparticle gaps of cluster titania precursors that otherwise retard the mechanism of nanotubes formation. 82 Many research projects indicate that when the sonication pretreatment is incorporated into the process, it caused the creation of much longer titania nanoparticles with smaller diameters. 83 The use of sonication method during the preparation of titania nanotubes helps to avoid or reduce the crystallite growth. In conclusion, smaller homogeneous titania nanotubes are formed with the use of ultrasonic pretreatment. Longer titania nanotubes with smaller diameters and higher surface area are formed effectively using the sonication pretreatment. 82 Effect of time and temperature of hydrothermal synthesis The hydrothermal treatment temperature is one of the parameters which influence morphological properties of the TiO 2 particles. This temperature plays an important role in promoting the nucleation and crystal growth of TiO 2 nanoparticles. The degree of crystallinity and also the crystallite size in the final product increases with increasing hydrothermal temperature. The usual range of temperature used for hydrothermal synthesis of TiO 2 is 110 C 250 C, it depends also on the autoclaves used. The rutile phase is more dominant in the resultant product, the presence of a small amount of anatase persisted except when the experimental temperature is approximately 200 C. Duration of the hydrothermal treatment is another very important parameter which influences considerably morphology and crystallinity of final TiO 2. Many previous studies proved that with increasing time and temperature of hydrothermal treatment, the average crystallite size and average pore size increased. On the other hand, the BET specific surface 25
27 area, pore volumes and porosity continuously decrease. 42 For temperature lower than 100 C, almost all researchers concluded that nanoparticles of TiO 2 are not formed. 84 Effect of the post-treatment process The morphology and the dimensions of the nanostructures are generally determined by the hydrothermal treatment, rather than by the washing process. Nevertheless, the acidity of the washing agent has a significant influence on other important properties like on elemental composition, annealing behaviour and specific surface area of nanoparticles. 80 The calcinations process which takes place during post-treatment very significantly affects the phase structure and microstructure of final titanium dioxide. Heat treatment can advance the phase transformation of titanium dioxide nanotubes to the anatase phase. It is also conductive with elimination of the ions which participate of primary precipitation reaction in the sample. 80 Effect of ph The creation of a pure phase (either anatase or rutile) required the proper selection of ph of the media and the crystallization temperature. When the ph of the medium is low (ph equals 1 to 2), only rutile phase was formed. When the ph is kept even lower, i.e., in the negative range, the final TiO 2 contains also a small amount of anatase. As the ph of the medium is increased, the product contained essentially anatase with very little part of rutile. With the addition of KOH or NaOH, the formation of anatase phase is favoured. With a further increase of the ph, i.e., above the twelve, only amorphous TiO 2 is obtained Solvothermal routes Solvothermal reactions are very similar to hydrothermal reactions, the only difference being that the reaction medium is a non-aqueous solvent. However, the temperature can be elevated much higher than in the case of hydrothermal method, since a variety of organic solvents with high boiling points can be chosen. As with hydrothermal methods, also solvothermal synthesis is conducted in stainless steel autoclaves. The solvothermal methods normally have better control than hydrothermal methods of the size and shape distributions and the crystallinity of the TiO 2 nanoparticles. By varying the initial parameters of synthesis such as the reaction temperature and time, solvent, the presence or not of a surfactant, titanium precursors, different shape of TiO 2 can be obtained (e.g.; nanoparticles 86, nanorods 87, or nanowires 88 ). 26

28 2.3.2 Methods of preparation TiO 2 thin films Thin film formation is described as a sequential process which includes nucleation, coalescence and subsequent thickness growth. The mode of film creation can be categorized into three basic types, which are illustrated schematically in Fig. 14. Layer-by layer mode (Frank van der Merwe mode) is two-dimensional growth mode, where is deposited step by step first layer, second layer, third layer and so on. In this case, the atomic bonding between the substrate surface and the film is greater than the bond between atoms of film layers. Three-dimensional island mode (Volmer Weber mode) is mode where firstly three dimensional separate islands are created. This happens when the bonding between atoms in clusters is much greater and stronger than that between the atom and the substrate. This growth mode can be observed in metal deposition around the room temperature. 89 Layer plus island mode (Stranski Krastanov mode) is an intermediate combination of the two growth modes mentioned above. The substrate is first covered with one or few monolayers grown in Frank van der Marwe mode, and then some three-dimensional islands are formed on the surface in Volmer Weber growth mode. This mode has been observed in metal metal and metal semiconductors systems. 1 ML 1 ML 2ML 2 ML (a) (b ) (c) Fig. 14 Three types of growth mode; is coverage; ml is monolayer; (a) Volmer Weber mode, (b) Frank van der Merwe mode, (c) Stranski Krastanov mode 91 Glass, especially soda-lime glass, is common substrate used for photocatalytic experiments. One of the problems in the implementation of TiO 2 on these glasses is that the prepared films are inactive. This is because the Na + cations from the glass diffuse into the TiO 2 film when this film is calcinated, with an adverse effect on the subsequent photocatalytic activity. When TiO 2 films are prepared on high-purity silica glass, this problem does not arise, so an obvious solution is to deposit a thin intermediate layer of silica prior to depositing the titania film. The silica layer effectively blocks the diffusion of Na + cations from the glass into the titania film. 1 Heller and co-workers have solved this problem by acid treating the glass to remove the Na + cations prior to the deposition of the TiO 2 layer
29 Physical/chemical vapour deposition Vapour deposition refers to any process in which materials in a vapour state condenses to form a solid phase material. These processes are normally used to form coatings to alter the mechanical, electrical, thermal, optical, corrosion resistance, and wear resistance properties of various substrates. They are also used to form free-standing bodies, films, and fibres and to infiltrate fabric to form composite materials. 9 If no chemical reaction occurs, this process is called physical vapour deposition (PVD); otherwise, it is called chemical vapour deposition (CVD). In CVD process, precursor is delivered into a reaction chamber at a suitable determined temperature. As they pass through a rector this precursor (in gaseous phase) come into contact with a heated substrate. It can react and form a solid layer deposited onto the surface of the substrate. Usually, an inert gas, such as Ar or N 2, is used as a diluting gas. The depositing temperature and pressure are the critical parameters. Whole process can be summarized as follows: Mass transport of precursor (in gas phase) to environs of substrate Diffusion of gaseous reactant through the boundary layer to the substrate surface or homogenous chemical reactions to form intermediates Adsorption of reactant species or intermediates on substrate surface Surface migration, heterogeneous reaction, creation of layers on the substrate surface, formation of by-product species Desorption of by-products from the substrate Diffusion of by-products to the bulk gas Transport of by-product gaseous species away from reaction chamber (exhaust) Bulk gas Boundary layer Gaseous reactant species Adsorbed intermediates Deposited solid species Gaseous by-product species Interface substrate Fig. 15 Model of CVD process 91 28
30 CVD method carries a lot of advantages but also many disadvantages. The main advantages are: Possibility of formation of uniform thickness layers Possibility of using quite wide range of chemical precursors This method requires relatively low deposition temperature Ability to control the crystal structure, stoichiometry, surface morphology It is also possible prepare epitaxial film To main disadvantages belong: Precursors are usually reactants which are extremely toxic, corrosive, explosive and also quite expensive By-precursors can be also very explosive, flammable, toxic and it is necessary their trapping and their treatment before being released to the atmosphere CVD methods are generally classified and categorized into seven main types of fabrication. The parameters used to characterize a CVD process include temperature, pressure, wall/substrate temperature, precursor nature, depositing times, gas flow state and 92, 93 activation manner. Table 2 Classification of CVD methods Low-temperature CVD Temperature High-temperature CVD Ultra-high-temperature CVD Atmospheric pressure CVD Chemical vapour deposition Pressure Wall/substrate Precursor nature Depositing time Low-pressure CVD Ultra-high-vacuum Cold-wall CVD Hot-wall CVD Inorganic CVD Metal organic CVD Continuous CVD Discontinuous CVD Pulsed CVD 29
31 Gas flow state Open CVD Closed CVD Thermal CVD Laser-induced CVD Activated manner Plasma-enhanced CVD Photo CVD Combustion CVD Catalyst-assisted CVD Low-temperature CVD (around 300 C) is mainly used for creation of layers where the substrate is not stable at higher temperature. High temperature CVD (usually in the range above 1000 C) is predominantly in this technique. Ultra-high temperature CVD techniques were developed for the single-crystal epitaxial growth of semiconductor materials. Pressure has a considerable effect on the deposition rate and quality of the finished products, in term of coating thickness uniformity. Mainly for CVD purpose is used lowpressure (low vacuum or medium vacuum). Only the substrates are heated in a cold-wall CVD, the wall of the reactor is colder. Therefore, the deposition mainly occurs on the heated substrate, and negligible deposition takes place on the walls of the reactors. This type of reactor is usually used for continuous deposition. In the other side, hot-wall CVD reactors represent one of the major categories of CVD reactors. In general, hot-wall reactors have the advantages of being able to process a large number of substrates and having good process parameter control. 91 In terms of the process time control, CVD can be divided into three categories. Discontinuous CVD is used in most CVD processes, whereas continuous CVD is extensively used for fiber coating and high-volume production of semiconductors devices. 91 CVD can be performed in a so-called closed or open system. In closed CVD, both reactant and products are recycled for refuse within an enclosure. 94 The closed reactor is primarily used for metal purification and protection coating for aero-engine blades. In most cases, CVD happens in an open state. 91 CVD can also be classified according to activation methods. Thermally activated CVD processes are initiated only with the thermal energy of resistance heating or by infrared radiation. In some cases enhanced CVD methods are employed, which includes plasma enhanced CVD (PECVD) laser-induced CVD (LCVD), photo CVD (PCVD), catalysisassisted CVD and so on. Methods of deposition include electrostatic spray 95 or ultrasonic-assisted hydrolysis 96 and pyrolysis reaction such as diffusion flame 97, thermal plasma 98, ultrasonic spray 99 and laserinduced pyrolysis 100. All of these methods have been found to influence the final product in 30
32 terms of size, orientation and crystalline structure 101 however samples obtained from CVD/PVD often required further annealing in order to increase the crystallinity. Large number of precursors can be used for CVD method. Criteria for suitable chemical precursor are followed: Low vaporization and sufficient volatility High stability at relatively low temperature High safety Low cost Gaseous, liquid and also solid precursors can be used for CVD technique. Gaseous precursors can be dangerous therefore it is necessary to dilute them with other inert gases to avoid safety problems. But it is also very important to ensure that there are not any chemical reactions between the gaseous precursors and all components to minimise corrosion effect. Liquid precursors must be heated to a proper temperature for vaporization and transported to the reaction chamber by a carrier gas. The usual carrier gas used for the CVD processes is H 2 because of its low density and viscosity for better flow behavior. Solid precursors exhibit some problems because they have to be heated to their vaporization temperature, which may be relatively high in some cases Wet-coating techniques Spin-coating Spin-coating is a process used to apply uniform thin films to flat substrates. This method is very simple where an excess amount of precursor solution is placed on the substrate. Consequently the substrate rotated at a high speed to spread the fluid by centrifugal force and create of wet films. The thickness of the final film depends on the angular velocity of substrate rotation, concentration and viscosity of precursor and evaporation rate. Range of thickness which can be created by this method is from 100 nm to 200 m. 102 Fig. 16 Spin-coating 31
33 Dip-coating During the dip-coating process, a substrate is dipped into a liquid coating solution and then its is withdrawn from the solution at a controlled speed. The thickness of coated films generally increases with higher withdrawing speed. The thickness is determined by the balance of forces at the stagnation point on the liquid surface. A higher withdrawing speed pulls more liquid up onto the surface of the substrate before it has time to flow back down into the solution. The thickness of prepared films depends on viscosity and density used sols and on surface tension. Fig. 17 Dip-coating Material printing Up to this date, material printing has become another very important and very popular method of coating. For this purpose, a conventional inkjet printer can be used. During the coating small droplets of low viscosity ink are ejected from a print head and fall onto printed substrate. The movement of the printed head and the substrate is precisely controlled by computer, also the volume of eject droplets and their loading per unit area can be changed by the computer. The printer and also prepared sol of precursor have to fulfil certain requirements in order to be employed as a thin layer deposition tool. The printer has to be able to handle rigid media so that solid materials can be used as layer support. The precursor must be of a very low viscosity (less than 20 mpa s) to prevent damage of the printer. If solid particles are present in the precursor, their diameter has to be well below the print head nozzle diameter and their aggregation must be prevented. Despite these limitations, inkjet printing has been successfully used for the deposition of a wide variety of functional liquids so far, such as conducting polymers, metallic nanoparticles dispersion, etc. 103 One of the inherent advantages of this method is the possibility of direct control the amount of the deposited sol by changing the grey-scale level of the printed image. In the case of inkjet printing, a combination of amplitude modulation screening and frequency modulation screening is used: ink droplets of varying size are placed at different pitch

34 The second possibility how to create the thin layer of TiO 2 by material printing is using a specialized device, such as the Dimatix material printer (Fig. 18). This printer allows deposition of liquid materials on A4 substrate, utilizing disposable piezo inkjet cartridge. This printer can create and define patterns over an area of about mm and handle substrates up to 20 mm thick with an adjusted Z height. 105 The temperature of the vacuum platen, which secures the substrate in place, can be adjusted up to 60 C. Holder of print head can be turned in the range from 0 to 90. It allows continuous changing of print resolution (from 100 dpi to 5080 dpi). The mechanical movements are extremely precise and they enable very precise work (resolution 5 m) and reproducibility of printing. 106 The Dimatix material printer offers a variety of patterns by employing a pattern editor program. Additionally, a waveform editor and a drop-watch camera system allows the manipulation of the electronic pulses to the piezo jetting device for optimization of the drop characteristics as it is ejected from the nozzle. There is a built-in cleaning station with a program editor that includes an automatic capping mechanism. This system thereby enables easy printing of structures and samples for process verification and prototype creation. 105 Fig. 18 Commercial inkjet printer Epson R220 and Dimatix material printer Principles of characterization techniques Ultraviolet-visible spectroscopy Ultraviolet-visible spectroscopy (UV-VIS) is a method based on the absorption of certain portion of light from ultraviolet or visible range (from 200 to 800 nm) by transmissive samples. This method is used in analytical chemistry for the quantitative determination of different analytes. Determination is usually performed in solutions, but measurement of solid samples is also possible. The UV-VIS spectrophotometer is employed to measure the amount of light that sample absorbs. It uses two light sources; a deuterium lamp for ultraviolet light and a tungsten lamp 33

35 for visible light. The light beam passes through a group of slits and mirrors, after that it slits into two beams. One of the beams is allowed to pass through a reference cuvette with solvent and the other passes through the sample cuvette. The intensity of the light beams is then measured at a detector. Absorbance, transmission or reflection can be measured by this method. Spectrophotometer equipped with an integration sphere is usually used for transmission and reflection. The degradation rate of different compounds in consequence of presence of TiO 2 can be studied by absorbance measurement and subsequently the photocatalytic activity of titania samples can be evaluated. The band gap energy of prepared TiO 2 can be investigated by reflectance measurement. Fig. 19 UV-VIS spectrophotometer Scanning electron microscopy The scanning electron microscopy (SEM) is a method which uses a focused beam of highenergy electrons to generate a variety of signals on the surface of solid specimens. Accelerated electrons in SEM carry significant amount of kinetic energy. This energy is dissipated as a various signals produced by electron-sample interactions when the incident electrons are decelerated in the solid samples. The types signals produced by SEM include secondary electrons (which produced SEM images), back scattered electrons (BSE), diffracted back scattered electrons (EBSD that are used to determined crystal structures and orientation of minerals), photons (characteristic X-rays which are used for elemental analysis and continuum X-rays), visible light (cathodoluminiscence CL) and heat. 108 Secondary electrons and back scattered electrons are commonly used for imaging samples. The secondary electrons are the most important for showing morphology and topography on samples. On the other hand, back scattered electrons are the most valuable for illustrating 34


36 contrast in composition in multiphase samples. X-ray generation is produced by inelastic collision of the incident electrons with electrons in discrete orbitals of atoms in the sample. The advantages of this method are: It is a non-destructive method X-rays generated by electron interactions do not lead to volume loss of sample It is possible to analyze the same materials repeatedly Scanning electron microscopy gives the information about the surface morphology, chemical composition, crystalline structure and orientation of materials making up the sample. The particle size or thickness of TiO 2 layers can be also studied by this method. The thickness in the range nm 109 can be measured by SEM. Fig. 20 Scanning electron microscopy Atomic force microscopy Atomic force microscopy (AFM) belongs to the group of scanning force microscopy techniques, a group of techniques which are based on the measurement of the different forces (as attractive, repulsive, magnetic electrostatic, Van der Waals) between a sharp tip and the sample surface. Imaging is accomplished by measuring the interaction force via deflection of a soft cantilever while raster-scanning the tip across the surface. Signal in AFM is essentially based on interaction repulsive forces which are of extreme short range nature. 110 The most common operating modes of AFM are contact, noncontact and tapping. In contact mode AFM, there is a repulsive force between the sample and tip (ca N); 35
37 the piezoelectric response of the cantilever either raises or lowers the tip to maintain a constant force. Noncontact AFM overcomes the frictional and adhesive forces between the tip and sample by hovering the tip a few Angstroms above the surface. In this mode the attractive Van der Waals forces between the tip and surface are monitored. Because these attractive forces are much weaker than those generated in contact mode it leads to lower resolution. During tapping AFM, the cantilever oscillation amplitude remains constant when not in contact with the surface. The tip is then carefully moved downward until it gently taps the surface. As the tip passes over an elevated surface feature, the cantilever has less room to oscillate, and the amplitude of oscillation decreases. 111 Atomic force microscopy (AFM) is used for studying surface morphology especially for the investigation the roughness of TiO 2 thin layers. mirror cantilever photodiode tip sample z-piezo Fig. 21 Atomic force microscopy X-ray diffraction X-ray diffraction (XRD) is an analytical technique used for phase identification of crystalline material. The analyzed materials are finely ground, homogenized and average bulk composition is determined. This technique is common for the study of crystal structures and atomic spacing. XRD is based on constructive interference of monochromatic X-rays and a crystalline sample. These X-rays are generated by a cathode ray tube, filtered to produce monochromatic radiation, collimated to concentrate and direct toward the sample. The interaction of the incident rays with the sample produces a constructive interference pattern when conditions satisfy Bragg s Law. n 2d sin (15) This law relates the wavelength of electromagnetic radiation to the diffraction angle and the lattice spacing in a crystalline sample. These diffracted X-rays are then detected, processed and counted. By scanning the sample through a range of 2θ angles, all possible 36

38 diffraction directions of the lattice should be attained due to the random orientation of the powdered material. Conversion of the diffraction peaks to d-spacing allows identification of the mineral because each mineral has a set of unique d-spacing. Typically, this is achieved by comparison of d-spacing with standard reference patterns. 112 XRD can be used for: Identification of unknown crystalline materials (e.g. minerals, inorganic compounds) Characterization of crystalline materials Determination of unit cell dimensions Measurement of sample purity One of the problems in XRD analyses is that only crystals are detected, while an amorphous part, if present in samples, exhibits no diffractions peaks. Thus, amorphous content must be determined as a rest of crystalline part and therefore precise determination of crystalline contents is necessary. 17 Sharpness of the peak indicated higher crystallinity of photocatalyst. The width of XRD peak reflects the size of particle. Crystallinity can show us also perfectness of crystals, i.e., higher crystallinity means lesser density of crystalline defects detector crystalline sample x-ray tube Fig. 22 X-ray diffraction 113 Particle size of a photocatalyst is often evaluated using Scherrer s equation (16) using data of powder X-ray diffraction patterns. Disadvantage of using this equation is that it neglects the effect of crystal lattice distortion. For samples that are expected to have a large degree of distortion, analyses using the Williamson-Hall equation should be carried out. Scherrer s equation is given bellow (16) where d is size of the particles in the direction vertical to the corresponding lattice plane, B is constant, is wavelength of X-ray, is corrected full width at half maximum (FWHM) of the XRD peak, is angle of diffraction. 37
.")
39 B d, (16) cos Transmission electron microscopy A transmission electron microscopy (TEM) is a method where a beam of electrons is transmitted through an ultra thin sample. When these electrons come through the sample they can interact with this sample (e.g., inelastic or elastic scattering, diffraction). If the undiffracted beam is selected to form an image, it is referred to as bright-field imaging; in contrast, selection of strongly diffracting regions of the sample, which would appear brighter than the transmitted beam, is known as dark-field imaging. The electrons could also be absorbed by molecules containing large atoms, or by surface contamination (e.g., dust, grease). The absorption of a high density of electron in a specific region will cause a cumulation of heat, leading to sample destruction and poor image quality. 111 Fig. 23 Transmission electron microscopy 114 TEM has a resolution of about 1 to 100 nm, and it can thus provide very detailed structural information on materials, even down to the molecular level. TEM specimen need to be very thin in order to transmit electron beams through the sample. Normally, the specimens are placed on copper grids or carbon-coated copper grids and viewed through the holes in the grid. The advantage of TEM is that it can be rapidly adjusted to provide an electron diffraction pattern from a selected area, facilitating the investigation of crystal structure and orientation and enabling particular morphological features to be identified
40 The quality of image depends on thickness of sample and on energy of the electron beams. Generally, increasing the thickness of a sample, or decreasing the energy of the electron beam, will induce more scattering events through more effective interactions between the electron beam and atoms of sample. This effect will enhance image contrast, since there is a larger deviation between the path lengths of transmitted and scattered electrons that reach the viewing screen. 111 This method can be used for investigation of particle size and shape. Also it is very useful for studying of aggregation Photon correlation spectroscopy Photon correlation spectroscopy (PCS) is a light scattering technique for studying the properties of suspensions and colloidal solutions. It is absolute, non-invasive and nondestructive method. Colloidal sized particles in a liquid undergo random Brownian motion owing to multiple collisions with thermally driven molecules on the liquid. The scattered light intensity from these diffusing particles will fluctuate in time, thus carrying information about the diffusion coefficient of the particles. 116 This method can be used for measurement of sub-micron particle sizes, diffusion coefficients, viscosities, and molecular weights of polymers. The device measures a rate of diffusion of particles through the solution (liquid) and from this measurement, the particles size can be determined. The samples are illuminated by a laser beam and scattered light is investigated. Generally, with increasing particles size the intensity of light scattering decreases. Fig. 24 Principle of photon correlation spectroscopy Superhydrophilic properties When a drop of fluid is placed on the top of a perfectly smooth solid surface, there are two competing effects. The interactions with the solid substrate may make it energetically favourable for the drop to spread so that it wets the surface. However, spreading increases the area of contact between the fluid and the vapour. This increases the surface tension energy 39
41 between the drop and the vapour and can destabilize the wetting films. When the interaction with the solid surface (e.g., favouring the liquid-solid interface over the vapour-solid interface) dominates, a complete wetting occurs and when the surface tension term dominates, a partial wetting occurs (Fig. 25). 117 Fig. 25 Illustration of a droplet placed on a solid substrate Wetting is characterized by contact angle which is specified for any given system. The shape of the droplet placed on the solid surface is determined by the Young s equation (17), where are surface tensions between three phases. This equation relates the surface tension between the solid surface, liquid droplets, and surrounding air to the contact angle between the water / air interface and the solid (Fig. 26). sv sl lv cos (17) Water droplets consequently assume a cap-like shape when sitting on a solid substrate. Smaller contact angle means flatter droplets and larger water surface. Large contact angles bring about reducing areas at the liquid / solid interface, and the substrate is not wetted as easily. 118 Two extreme situations can happen, when the contact angle either tends to zero, we call this surface superhydrophilic, or when the contact angle approaches 180 and this situation occurs when the surface is superhydrophobic. Water coming into contact with a superhydrophilic surface spreads out and forms a thin film, while on the superhydrophobic surface, water forms into spherical bead-like drops, minimizing the solid / liquid contact area. 40

42 Fig. 26 Wetting of solid surface according to Young s equation The photoinduced superhydrophilicity of TiO 2 thin films in which H 2 O droplets are able to spread out to form H 2 O layers under UV light irradiation was discovered in It was found that if a TiO 2 film is prepared with a certain percentage of SiO 2, it acquires superhydrophylic properties after UV illumination. In this case, electrons and holes are still produced, but they react in a different way. The electrons tend to reduce the Ti(IV) cations to the Ti(III) state, and the holes oxidize the O 2 anions. In the process, oxygen atoms are ejected, creating oxygen vacancies. Water molecule can then occupy these oxygen vacancies, producing adsorbed OH groups, which tend to make the surface hydrophilic. The longer the surface illuminated with UV light, the smaller the contact angle for water becomes. 1 Fig. 27 Mechanism of photo-induced hydrophilicity 41
43 2.6 Photodegradation of water pollutant Wastewater treatment is a very important for the removal of organic pollutants. Large amount of organic pollutants consumed in the industries are being released into the ecosystem and constitute a serious treat to the environment. As chemical and agricultural wastes, these contaminants are frequently carcinogenic and toxic to the aquatic system because of their aromatic ring structure, optical stability and resistance to biodegradation. In past decades, the traditional physical techniques for the removal of organic pollutants from wastewaters have included adsorption, biological treatment, coagulation, ultrafiltration and ion exchange on synthetic resins. 120, 121 Those methods have not always been effective and they may not actually break down the pollutants in wastewater. For example, adsorption technology does not degrade the contaminants, but essentially transfers the contaminants from one medium to another, hence, contributing the secondary pollution. Moreover, such operations are expensive because the pollutants are treated before the adsorption process while the adsorbent medium has to be regenerated for reuse. 120 Traditional biological treatments are often ineffective in removing and degrading pollutants because the molecules, being mostly aromatic, are chemically and physically stable. Hence, biodegradation of organic pollutants is usually incomplete and selective. 122 In fact, some of the degradation intermediates may be more toxic and carcinogenic than the original pollutants. Heterogeneous photocatalysis has been successfully used in the oxidation, decontamination or mineralization of organic and inorganic contaminants in wastewater without generating harmful by-products. A large amount of chemical substrates that have already been subjected to photodegradation experiments in water with or without auxiliary oxidants or photocatalyst. Many authors presented extensive lists of organic compounds that have been treated according to H 2 O 2 -UV, O 3 -UV and TiO 2 -UV procedures. Richard and Grabner 123 published work concerning the photodegradation of phenol and of its derivates in aqueous solution. Phenolic compounds are systematically introduced into the environment via several household and industrial activities. A lot of fungicides, insecticides are based on this structural element. Hence, this class of organic compounds represents big toxicological risk because most of them are water soluble and highly toxic. They were detected in ground water reservoirs. Photocatalytic degradation of phenol derivates represents an alternative method for biological detoxification Formic acid Carboxylic acids occur in natural waters at varying concentrations depending on origin, aqueous solubility, and biological activity. Formic acid has become the most investigated organic molecules on single-crystalline surface. The absorption of formic acid on TiO 2 surface is one of the best examined organic systems at this point. During the degradation of formic acid, this compound undergoes direct mineralization to 124, 125, 126 water and carbon dioxide without the creation of any stable intermediate species. Moreover, it also represents a possible final step in the photodegradation of more complex organic compounds
44 2.6.2 Organic dye Dyes have relatively large photoabsorption (extinction) coefficients and therefore measurements of their concentrations in solutions are easy even if the concentrations are very low. However, the fact that dyes absorb visible light indicates that a photoreaction might be induced by visible-light photoabsorption (dye sensitization) as well as by photoabsorption of a photocatalyst. 128 Organic dyes are inappropriate as a model compound, particularly for testing visible light-induced photocatalytic activity. There are three reasons for its inappropriate: 17 Dye molecules absorb photons, especially in the visible light range, and thus photoexcited electrons may be injected into phootcatalytic particles. The absolute molar amount of dye contained in the reaction system can be much smaller than that of solid photocatalysts. The concentration of the dye in the solution should be relatively low since the absorption coefficient is large. The mechanism of dye degradation is so complicated that efficiency of the photocatalytic reaction, e.g., quantum efficiency, cannot be measured. Advantage of using dye is: Measuring the consumption (decrease) of a dye during photo-irradiation requires only a spectrophotometer. If dyes are used as model compounds, care must be taken in the interpretation of experimental results. Photocatalytic degradation of many organic compounds been reported, including noxious compounds such as polychlorobiphenyls (PCB), dioxin 129, dichlorodiphenyltrichloroethane (DDT) 130. Among them the chlorophenolic compounds have been studied extensively, because these compounds are toxic, water-soluble and used for synthesis of other chemicals. Many dyes are decolorized and ultimately mineralized by photocatalysis. In the degradation of azo dye, the degradation rate decreases in the order monoazo diazo triazo. 131 Three processes including oxidation and reduction are considered to occur simultaneously in the photocatalytic degradation of dye (Fig. 28). The photocatalytic degradation of organic compounds is the first process. Spectral sensitization is the second process. One moiety of dye molecule serves in last process as the electron acceptor, suppressing recombination between electron and positive hole. 1 43
45 Fig. 28 Photocatalytic degradation mechanism of dye 44
46 3 AIM OF THE EXPERIMENTAL WORK The aim of this work is to prepare the thin layers of titanium dioxide on the solid substrates. The preparation of TiO 2 thin layers are performed by two different methods; by materials printing and by chemical vapour deposition. TiO 2 for material printing is prepared by two methods; by sol-gel and by hydrothermal treatment. Photocatalytic activity of all prepared TiO 2 is investigated and the most active samples are evaluated. Sol-gel method: Titanium tetraisopropoxide (TTIP) is used as a precursor, acethyl acetone (AcAc) as a chelating agent, and ethanol is used as a solvent in sol-gel preparation. The sol deposition is realized by inkjet material deposition. Different amount of PEG are added to each prepared sol. PEG is used as anti-cracking agent. The influence of different sol loading on physical properties and final photocatalytic activity of prepared TiO 2 thin films is examined. Hydrothermal treatment: Titanium oxochloride (TiOCl 2 ) is used as a precursor, KOH as a precipitation agent and water is used as solvent. Hydrothermal synthesis is performed under various conditions. The influence of process temperature and time of hydrothermal treatment on final physical properties of prepared sols is studied. Subsequently, the best conditions of preparation for final activity are evaluated. These sols are deposited onto the substrates by material printing and again the photocatalytic activity of thin titania layers is evaluated. Chemical vapour deposition Titanium tetraisopropoxide (TTIP) is used as a precursor and nitrogen is used as carried and also dilution gas. Deposition is performed in cold-wall reactor. The final photocatalytic activity of thin titania layers is evaluated and compared with photocatalytic activity of titania thin film prepared by hydrothermal treatment. 45
47 4 EXPERIMENTAL SECTION 4.1 Chemicals Reactants for preparation of TiO 2 films by sol-gel process: Titanium (IV) isopropoxide (p.a.), Fluka, Germany Absolute ethanol (p.a.), Penta, Czech Republic Acetyl-acetone (p.a.), Lachema, Czech Republic Polyethylenglycole 1500 (p.s.), Merck, Germany Sulphuric acid (p.a.), Lachema, Czech Republic 2,6-dichloroindophenol (A.C.S. reagent), Aldrich, Germany Reactants for preparation TiO 2 thin films by hydrothermal synthesis: Titanium oxochloride Potassium hydroxide Chloride acid Formic acid Deionized water Tween 20 Abesone CTAB Reactants for preparation of TiO 2 films by chemical vapour deposition: Titanium(IV) isoprpoxide (97%), Aldrich, Germany 4.2 Used equipments Viscosimeter AVMn (Anton Paar) Densitometer DMA4500 (Anton Paar) NanoCalc-2000 (Micropack, Germany) Inkjet printer Epson R220 Experimental printer FUJIFILM Dimatix Microscope Nikon Eclipse E200 Camera Nicon D70 Veeco Di CP-II machine (Dymek, Japan) Microscope ATM/STM 5500 (Pico Plus) Electron microscope MIRA II LMU, Tescan 46
48 Electron microscope LEO43VP Perkin-Elmer Lambda 45 UV/VIS spectrophotometer with an integration sphere (RSA- PE-20, Lambsphere UV-VIS spectrophotometer Helios α, Spectronic Unicam UV-VIS spectrometer with integration sphere Fibre UV-VIS spectrophotometer X-ray diffractometer Panalytical X Pert Pro MPD Current X-ray difractometer Empyrean, Panalytical X-ray diffractometer SEIFERT Contact Angle System OCA, DataPhysic Coulter N4Plus Transmission electron microscope JEOL JEM 2010 Chromatograph Varian Prostar Magnetic stirring, Lavat MM7 UV lamp OSRAM HQL 125 W Philips Metal-halide lamp HPA 400/30 SD Radiometer X 97, nm, UV , SN-14524, Gigahertz-Optik Peristaltic pump PCD 83 Analytical scale Scaltec, SPB 32 Calcination furnace 47

49 4.3 Sol-gel process Synthesis of sol Titanium(IV) isopropoxide (TTIP) was used as a precursor for preparation of TiO 2 by solgel method. Firstly, 40 cm 3 of absolute ethanol was mixed with 3.8 cm 3 of acetyl-acetone. The prepared mixture was added dropwise to 10.3 cm 3 TTIP under continuous stirring to control the hydrolysis and condensation reactions. This solution was maintained under stirring for a few minutes to obtain the complex chelate. Subsequently, 45 cm 3 of absolute ethanol with 0.69 cm 3 of water was added drop by drop to the prepared mixture to start the hydrolysis and condensation reactions. Different amounts of PEG with molecular weight of 1500 (0, 1, 4, 16 g dm 3 ) were added to form the printing solutions. All prepared mixtures were stored in the darkness at the temperature 5 C. CH 3 CH CH 3 CH CH 3 CH 3 O O Ti O O CH CH CH 3 CH 3 CH 3 CH 3 Fig. 29 Used precursor; titanium(iv) isopropoxide Study of viscosity and density We investigated viscosity and density of all prepared samples. There are important parameters for subsequent deposition by material printing. The viscosity of prepared solutions was measured by automatic viscosimeter AMVn and we observed a viscosity change as the function of present PEG amount. Densitometer DMA4500 was used for densitometry measurement and we observed the same dependence as in previous case. All measurement, viscosity as well as densitometry, were performed at the temperature of 25 C. Fig. 30 Viscosimeter AMVn in combination of densitometer DMA

50 4.3.3 Substrate pre-treatment Soda-lime glass plates with size 50 mm 50 mm 1.1 mm were chosen as substrates for immobilization of TiO 2 thin layers. Firstly, these substrates had to be pre-treated in sulphuric acid with concentration 50%wt. for 120 minutes to avoid sodium ions diffusion to titania layer. These sodium ions would have caused a reduction of photocatalytic activity. Consequently, these plates were washed in a surfactant solution to remove a dust, grease and other residues, which might have collected during the storage of pre-treated glass plates and finally dried under the laboratory conditions Material printing Sol application was carried out by the new method called material printing. A modified office inkjet printing Epson R220 was used for this purpose. Firstly, all original cartridges were removed and the ink tubing and printhead were purged by anhydrous propanol. This step secures removing of traces remaining aqueous ink. If the sol came in the contact with aqueous impurities, TiO 2 would start to precipitate, which can cause clogging of the printhead nozzles. Afterwards, the prepared sols were filtered through 0.45 m mesh size syringe filter into one of the ink cartridges, the others remained empty. This cartridge was installed to into the printer to the black ink position. Consequently, a series of head cleaning was performed to obtain a perfect nozzle check pattern. This check patterns had to be observed under UV-A light source because the sol is essentially color less when observed under daylight. Under UV- A light sol appeared yellow while the paper was bright blue because of the fluorescent brightening agents present in the paper. Fig. 31 Used inkjet printing Epson R220 with modified CD holder Subsequently, glass substrates were mounted into a modified CD holder (Fig. 31), fed into the printer and printed with black only drives setting. It means that only the ink from the black cartridge which is now filled by TiO 2 sol was utilized for printing. One of the main advantages of this technique of coating is the possibility to direct control the amount 49
 we can observe the creation of printed layer. Different grey levels need to be converted into a halftone screen patter.")
51 of the deposited sol (i.e. the sol loading) by changing the grey scale level of printed image (Fig. 32). Fig. 32 Layers build-up for different sol loading 104 In this figure (Fig. 32) we can observe the creation of printed layer. Different grey levels need to be converted into a halftone screen patter. In the case of inkjet printing, a combination of amplitude modulation screening and frequency modulation screening is used. Ink droplets of varying size are placed at different pitch. The printed substrate can be completely covered by sol because the printed droplets spread on the surface and have much larger diameters than diameter of eject droplets which roughly correspond to the nozzle diameter. In this work, we used three levels of sol loading (100%, 90% and 80%). Before the printing we needed also choose from three modes of the printer operation available: Slow, Medium and Rapid. For our purpose we chose mode Rapid. In this mode, the printhead runs very quickly above the glass surface and it prints continuously in both directions. Because the motion of the printhead and the sol deposition is very fast, the evaporation of the printed solution takes after the printing phase is finished. Hence, in this way smooth and glossy layer of TiO 2 can be obtained. All deposited glass plates were placed into an oven and dried at the temperature for 30 minutes and subsequently they were thermally treated in a calcination furnace at the temperature 450 C for 4 hours with the ramp of 3 C/min Characterization of TiO 2 thin layers Thickness measurement The thickness of prepared titania layers was determined by specular reflectance measurement using NanoCalc This method can be used for transparent as well as for semi-transparent films. The technique is based on the evaluation of how the layer interacts with light and we can measure the films with thickness in the range from 10 nm to 250 m. The main advantages of this method are accuracy, high speed, simplicity, non destructive 50

52 approach and no need of sample preparation. Each TiO 2 film was measured ten times and consequently, the average value was calculated. Fig. 33 NanoCalc-2000 for measurement thickness of titania layers Optical microscopy The quality of prepared layers was investigated by optical microscope Nikon Eclipse E200. The images were obtained from a digital camera Nikon D70 mounted on the optical microscope. The influence of the PEG and the sol loading on cracking intensity was evaluated from the optical images. The camera parameters were adjusted follows; exposure program of Aperture priority, ISO 400, chromatic temperature of 2800 K, white balance in auto mode. Microphotographs were obtained with magnification ten times Scanning electron microscopy The surface topology was studied by scanning electron microscopy using electron microscope MIRA II LMU, Tesan. The size of primary crystals as well was film thickness was also evaluated by this method Atomic force microscopy Apart from the scanning electron microscopy, there are others methods which can be used for the study of surface topology. One of them is atomic force microscopy. Topology of the samples was investigated by Veeco Di CP-II machine. Generally, AFM analysis can be performed in three different modes; contact, noncontact and tapping. Our analysis took place in tapping mode Photoinduced hydrophilicity The photoinduced hydrophylicity was examined by the contact angle measurement of water droplets placed onto the titania layers. This determination was performed on the OCA20 by applying a sessile drop method. After the creation of droplet its evolution is recorded by a CCD camera and the contact angle was obtained by the processing the tangent method. The volume of the deposited droplets was 5 L and the droplets were recorded in the 10 seconds after the creation. We studied freshly prepared glass as well as the glass stored 51

53 in the darkness for 10 days and we evaluated the changes in the hydrofilicity of these titanium dioxide thin films. Subsequently, the photoinduced hydrophilic conversion was investigated using UV irradiation. A high pressure mercury lamp (OSRAM HQL 125 W) was used for this purpose and the intensity of irradiation was 15 W/cm 2. The contact angle of water droplets on the irradiated layers was measured in the 1, 3, 5 and 10 minutes. Every time five droplets were deposited and the average of found values was calculated. Fig. 34 Apparatus for contact angle measurement OCA Photocatalytic activity Photocatayltic activity was studied as a degradation rate of 2,6-dichloroindophenol (DCIP) with initial concentration mol dm 3. The experiments were performed in a reactor consisting of two beakers, which were connected by peristaltic pump. Total volume of the degradated solution was 150 cm 3. The samples were placed in one of the beaker and the other beaker was used as a storehouse for DCIP solution (Fig. 36). UV irradiation was provided by the high pressure mercury lamp (Osram HQL 125W). The distance of the lamp from the samples was the same during all experiments. The intensity of irradiation was 10 W m 2 and X97 irradiance meter with X9-7 probe was used for this measurement. The emission spectrum of used lamp is shown in Fig. 35. Each sample was irradiated for 10 minutes to activate the photocatalyst before reaction. Immediately after the filling of a reactor by DCIP, the beaker was covered by a water cell to block IR radiation. Required amount of reaction solution (2 cm 3 ) was sampled every 5 minutes for UV-VIS analysis. Total duration of the experiments was 30 minutes. This time was enough for complete decolorisation of the reaction solution. 52
54 Spectral irradiance, mw.m -2.nm [nm] Fig. 35 Emission spectrum of used UV lamp Source of UV light Sample Peristaltic pump DCIP solution Fig. 36 Arrangement of photocatalytic reactor 53
55 4.4 Hydrothermal synthesis The main goal of this work is to compare final properties, particularly the photocatalytic activity, of titanium dioxide prepared by different methods. In the first part, we dealt with printed thin films of TiO 2 prepared by the sol-gel method. Now, we concentrate on the preparation of colloidal titanium dioxide by hydrothermal synthesis. We studied the influence of different process conditions and different ph on physical properties and photocatalytic activity of prepared colloidal titania slurry Synthesis of colloidal TiO 2 Titanium oxo-chloride (TiOCl 2 ) was used as a precursor for preparation the colloidal suspension of TiO 2. This compound was added dropwise to an aqueous solution of KOH (with concentration 5 mol dm 3 ) until neutral reaction of the resulting mixture. Consequently, the mixture was washed by deionised water to remove excess chloride ions. Prepared and washed mixture was diluted to 400 cm 3. We used 50 cm 3 of this solution with 50 cm 3 KCl (0.006M) for hydrothermal synthesis. This amount of potassium was evaluated in previous work as the best for photocatalytic activity. Finally, we added required amount of KOH (with concentration 1 mol dm 3 ) to achieve the required basic ph (10) or HCl to reach acid ph (2). TiO 2 mixtures prepared by this way were hydrothermally treated under different conditions. We changed the time and temperature of the treatment. Synthesis took place for 6 hours, 24 hours or 48 hours and temperature of the process was 110 C or 160 C UV-VIS spectroscopy Optical characterization of TiO 2 colloidal suspension was accomplished using UV-VIS spectrometer with an integration sphere with diameter of 5 cm. The system consists of two lamps. One of them was a deuterium lamp for UV region and the other a tungsten lamp for visible region. The measurement was performed in the range of nm. The spectra of total and diffused reflectance and transmission were recorded under the following parameters: data interval of 1 nm, scan speed of 240 nm min 1, smooth of 2 min, slit of 4 nm and lamp change at 326 nm. The measurement was performed in 0.1 cm cuvette. The principle of transmission a reflectance measurement is explained in Fig
56 Fig. 37 Principle of transmission and reflectance measurement, total and diffused transmission (top), diffused and total reflectance (bottom) Total transmission: Opposite the sample there is a spectralon situated, the surface of which reflects transmitted light. Incident light beam goes through the sample which causes scattering of the beam. The sensor, placed in the middle of sphere, receives the sum of all transmitted light. Diffused transmission: Position of the sample is the same as in the previous case but contraty to the total transmission configuration there is no spectralon. It means that sensor receives diffused light beam collected by the sphere only. Total reflectance: During this measurement the sample is inclined at 8 which allows the inclusion of specularly reflected beam in the sphere. So the sensor receives the sum of all reflected beams (diffused and specular). Diffused reflection: In this case, sensor receives only the beams diffused by the reflection from the sample. Specular reflected beam is emitted by the orifice. We measured the total transmission and total reflectance of all prepared samples and subsequently we calculated the absorptance of the TiO 2 according the following formula (18), where T (residual) represent the residual light of the source due to the dispersion.. A(%) 100 T(tot.) R(tot) T(residual) (18) Gravimetric analysis This method was used for the investigation of titania concentration in the solutions and also for the studying stability of these TiO 2 slurries. We took 5 cm 3 from each sample and 55
57 weighted it. Then this amount was dried to constant mass and we calculated the amount of TiO 2 in used volume. Consequently, we also evaluated the stability of prepared samples by this method. We measured the concentration immediately after the sample s preparation and then after 1 day staying at rest. After this time we could observe certain concentration decreasing which was calculated. The extend of this decreasing provides us the information about the stability of prepared samples X-ray diffraction The crystalline phase composition of prepared samples was investigated by single crystal and powder X-ray diffractometer using CuK as radiation source. The samples were examined in powder form. So for this purpose we took 5 cm 3 from all solution and this amount was dried to constant weight in an oven at the temperature 100 C. Subsequently, the crystallite size was calculated using Scherrer equation (19), where B is constant equal 0.94, is the wave length which is equal to 1.54 Å and is the width of peak at a half of maximal height. The influence of different time, temperature and ph of process was studied. B d (19) cos Photon correlation spectroscopy Photon correlation spectroscopy is method used for evaluation of particle size. Coulter N4Plus machine was used for this purpose. The rate of particle diffusion through the solution was measured and the particle size was calculated from Einstein s equation (20) using an autocorrelation function. k T D B 3 d In this equation k B is Boltzmann s constant; T is temperature; is dynamic viscosity and d is diameter of particle. This equation is usable for small spherical particle where we can consider solvent as continuous environment. The samples were illuminated by a laser beam and light scatter was examined. This method is not usable for concentrated solution due to a high absorption. Nevertheless, the concentrations of our TiO 2 colloidal solutions were not higher than 4 %wt so we were able to use this method. (20) 56
58 4.4.6 Transmission electron spectroscopy Transmission electron microscopy (TEM) was used for analysis of crystallite size as well as their shape of prepared TiO 2. For this purpose we used a JEOL JEM 2010 microscope operated at 200 kv, equipped with a LaB 6 tip. The samples were prepared by simply putting a drop of the solution containing the particles on a holey-carbon thin film supported on a microscopy copper grid Band gap energy The band gap of the prepared TiO 2 was evaluated from diffused reflectance measurement. For this purpose we used fiber UV-VIS spectrometer equipped with two lamps, deuterium lamp for UV region and halogen lamp for VIS area. The optical path consists of several optical fibers where six of them are connecter with lamp and one with CCD detector. Reflectance was measured in the range of wavelength from 200 nm to 800 nm and barium sulfate was chosen as a reference. We can calculate the molar absorption coefficient using the results from this analysis according the following formula (21) which is derived from Kubelka-Munk theory. 2 1 R (21) 2R We examined direct as well as indirect transitions. For direct transition, the dependence of ( h ) 2 on (h ) is constructed where (h ) is a photon energy. On the other hand, ( h ) 1/2 as a function of photon energy was constructed for indirect transition, and we estimated the exactly band gap energy from extrapolation to = Photocatalytic activity Photocatalytic activity of titania colloidal solutions was investigated as the degradation rate of formic acid (FA). This compound was chosen because of direct mineralisation to H 2 O and CO 2 without the creation of any stable intermediate species. 125, 126, 132, 133 Moreover, it also represents a possible final step in the photodegradation of more complex organic compounds. 134 The photocatalytic experiments took place at ambient temperature in a pyrex reactor (Fig. 38) with 50 cm 3 of reaction solution under constant stirring. The concentration of TiO 2 in the reaction solution was 1 g dm 3 and the final concentration of FA in the solution was 100 ppm. Firstly, the reaction solution was placed to darkness for 30 minutes under continuous stirring in order to reach adsorption equilibrium of FA on TiO 2 surface. In the certain time steps of photocatalytic degradation, 1 cm 3 of the reaction solution was sampled for HPLC analysis. The total reaction time was 60 minutes. The photocatalytic activity of prepared TiO 2 was compared with commercial TiO 2 (P25, Degussa). The intensity 57
59 of radiation used during the photocatalytic testing was mw cm 2 in the UVA region mw cm 2 in the UVB region and no radiation of the UVC region was presented. Pyrex reaktor Magnetic agitator Reaction solution UV radiation Magnetic stirrer Optical filter Watter cooling circulation Philips HPK 125W lamp Fig. 38 Experimental setup for photocatalytic experiments 58
60 4.5 Printed layers of TiO 2 prepared by hydrothermal synthesis Preparation of printed titania thin films From previous study (5.2.3), we discovered that the solutions of TiO 2 prepared in acid environment were more stable than the same samples prepared in basic ph. That was the reason why we chose exactly these samples for the next work. The coating process demands stability of printing mixture and it was assured by using acid ph. The stability of colloidal suspension increases with decreasing ph. Hence we prepared the samples of TiO 2 in ph 1. The process was the same as in the previous case i.e. TiOCl 2 was added to 480 cm 3 of KOH to neutral reaction. Consequently, this mixture was centrifugated for 15 times and finally we added 3 cm 3 KOH to final amount mol and required amount of HCl to set ph 1. Solutions were treated for different times (6, 24, and 48 hours) and we used two process temperatures (110 C and 160 C). Coating deposition was performed in a novel way utilizing specialized experimental printer FUJIFILM Dimatix. Soda-lime glass plates of size mm were chosen as the substrate for immobilization of titania thin layers. The glass plates had to be pre-treated before the deposition in sulphuric acid in order to prevent sodium ions diffusion which would cause a reduction of photocatalytic activity. 135 Subsequently, the plates were washed in a surfactant solution to remove dust, grease and other residues. TiO 2 colloidal solution was used for the formation of printing mixture which consisted of 1 cm 3 mentioned TiO 2 slurry, 1 cm 3 HCl, 1 cm 3 acyl benzene sulfonic acid (Abesone), and 1 cm 3 water, respectively. Abesone is an anion-active surfactant which was used in our case as a stabilizing agent of TiO 2 colloidal particles. HCl was added in order to maintain acid ph after the addition of water. H 2 O was added to reach required viscosity of printing mixture. The prepare mixture was necessary to sonicated for five minutes and filtered through a 0.45 m mesh size syringe filter before filling the cartridge. The printed head contained 16 nozzles and it was attached to the filled tank and mounted into the Dimatix printer. The temperature of nozzle was set to 40 C. The printer settings optimization is very important to obtain satisfactory results. Viscosity is just one of the few properties that predict the suitability of sol solution for inkjet printing deposition. Wetting ability of sol, which is generally low, needs to be mentioned as a relevant factor in layer preparation. Wettability is closely associated with changing nozzle span. Too large nozzle span leads to a banding structure of layers. The nozzle span was 20 m, the nozzle shift was 4.5. In this part of study we investigated the influence of the film s thickness, for this purpose we prepared samples with one and two layers. We also compared the properties of thin films created from the TiO 2 by hydrothermal synthesis under the different conditions. Finally all deposited substrates were placed to calcinations furniture and dried during temperature increasing up to 500 C with a ramp 3 C/min. Glasses with TiO 2 layer were subsequently dried at this temperature for 30 minutes. 59
61 The amount of deposited TiO 2 was analyzed by gravimetric measurement. It means that the substrate was weighted before and after the titania deposition and we calculated the final mass of created layers from the difference X-ray diffraction X-ray powder diffraction of TiO 2 was performed using X-ray diffractometer Empyrean, Panalytical. The powder was prepared by drying of the TiO 2 solutions at temperature 50 C to constant mass. The crystallite phase of prepared TiO 2 as well as their percentage representation was investigated Optical properties The optical properties of prepared thin films were studied by optical microscope Nikon Eclipse E200. The records were obtained form a digital camera Nikon D70 mounted on the optical microscope. The influence of a film thickness on homogeneity and presence of cracks was evaluated from recorded images. The camera parameters were adjusted follows; exposure program of Aperture priority, ISO 200, white balance in auto mode. The samples were measured in reflected light because of layers opacity. Used magnification was Scanning electron microscopy Topology of TiO 2 layers prepared as well as homogeneity of these films was studied by SEM. Imaging was performed by the LabSensNano laboratory (The Faculty of Electrical Engineering and Communication, Brno University of Technology). Scanning electron microscope MIRA II LMU, Tescan, was used for this purpose and all prepared films were analyzed by this technique Atomic force microscopy Atomic force microscope Veeco Di CP-II was used for examine prepared samples. By this method we studied and compared topology and roughness of all monolayers. The analysis was carried out in tapping mode Photoinduced superhydrophilicity The supperhydrophilic properties of TiO 2 deposited glass plates can be characterized by the measurement of water drop contact angle on the titania surfaces. This analysis was performed on the OCA20 by applying a sessile drop method. Immediately after the drop deposition its development was recorded by a CCD camera and the contact angle same as in previous case ( ) was obtained by the software processing using the tangent method. 60
62 Spectral irradiance, mw.m 2.nm The total volume of deposited droplets was 5 L and the droplets were recorded in the 10 seconds after the formation. The hydrofilic properties were studied on all prepared samples. Each TiO 2 thin film was irradiated by UV light with intensity 10 mw/cm 2. Philips Metal-halide lamp HPA 400/30 SD was used as light source. We examined the angle decreasing during 30 minutes caused by UV irradiation. The final contact angle in certain time was calculated as the average of three measurements Wavelength nm Fig. 39 Emission spectrum of used metal-halide lamp Philips HPA 400/30 SD Photocatalytic activity The photocatalytic activity of these printed layers of TiO 2 was examined by monitoring the degradation rate of 2,6-dichloroindophenol. The experiments were performed in a flow reactor with a rotary sample holder. Each sample was placed on this holder and it was irradiated by UV light with intensity 7.5 mw/cm 2 for 10 minutes to activate TiO 2 photocatalyst. Philips Metal-halide lamp HPA 400/30 SD was used as the light source. The intensity was measured by Radiometer X 97 The initial concentration of 2,6-DCIP was mol dm 3 and total volume of this solution used for one measurement was 70 dm 3. Immediately after 10 minutes of irradiation, aqueous solution of 2,6-DCIP was poured to the reactor and the reactor chamber was immediately covered by a transparent PE foil to prevent solution evaporation. A peristaltic pump maintained a continuous flow of DCIP solution and the surface of active TiO 2 layers was constantly watered. Spectra Suite Ocean Optics software of fibre spectrometer provided on-line data collecting every 1 minute. The maximum of absorption peak is occurred at wave length 600 nm so 61

63 the concentration decreasing was studied at this wave length. The total time of the degradation reaction was 40 minutes. Light source Reactor Measuring cell Magnetic stirring device Pumping device Fig. 40 Arrangement of photocatalytic reactor and light source 62


64 4.6 Chemical vapour deposition Preparation of titania thin layers Apart from the material printing, also chemical vapour deposition was chosen as a technique for the preparation of thin TiO 2 layers. Glassy carbon was used as substrate and silicon was chosen as a reference. Each substrate was pre-treated before the deposition. Glassy carbons were polished (Fig. 41) by Si-paper with different roughness (Si-P1000, Si- P1200, Si-P2400 and Si-P4000; respectively). Afterwards these polished substrates were ultrasonicated in absolute ethanol for 5 minutes and dried by Ar stream. Silicon was only washed in absolute ethanol and dried by Ar stream. Titanium (IV) isopropoxide (TTIP) was used as the precursor, similarly in the case of solgel. The whole process was performed in a vertical cold wall CVD reactor (Fig. 42); it means that only the substrate was heated not the whole chamber where the substrate was placed. Vacuum was created in the first step of deposition. Consequently, a susceptor with substrates (Fig. 41), gas lines and water bath with precursor were heated to require temperatures. N 2 was used as carrier and dilution gas. Fig. 41 Machines for polishing the substrates (left) and susceptor with substrates (right) Temperature, pressure and duration of process are the main parameters which very significantly influence the final properties of prepared layer. Temperature affects the final crystallite phase and size of created titania grains. Pressure influences the deposition rate and subsequently the thickness of prepared layers. Duration of the process has mostly an effect on layers thickness. Our coating process was performed at temperature 350 C, pressure 20 Torr and total time of all depositions was 3 hours. All samples were prepared during two depositions. The differences between these depositions were in the time for vacuum creation in the system and in the age of the precursor. The parameters of all performed deposition reaction are summarized in Table 3. 63
 80.6 81.2 Dilution gas flow (%) 90 97.1 Susceptor T ( C) 380 380 GC-2; GC-3; GC-4; Si-2 Age of precursor 3 months 2 weeks Time of creation vacuum (h) 1.5 2.0 Fig.")
65 Table 3 Parameters of all CVD CVD First Second Samples GC-1 Si-1 Distance from shower head to susceptor (mm) T of gas lines ( C) T of bath ( C) Pressure (Torr) Duration (min) Carrier gas flow (%) Dilution gas flow (%) Susceptor T ( C) GC-2; GC-3; GC-4; Si-2 Age of precursor 3 months 2 weeks Time of creation vacuum (h) Fig. 42 Used CVD reactor 64
66 4.6.2 Gravimetric analysis Gravimetric analysis was performed for investigation of titania amount on the substrates. The weight of substrates was measured before and after the deposition and from the difference of the values the final amount of deposited TiO 2 was calculated X-ray diffraction The crystallite phase of prepared TiO 2 was evaluated by XRD measurement. Analysis was performed using difractometer SEIFERT. The measurement was carried out with fixed position of sample and source while the detector was moving. The analysis took place on TiO 2 thin films Scanning electron microscopy Scanning electron microscopy (SEM) analysis was performed on LEO43VP microscope. Morphology as well as layers thickness were studied in this analysis. We compared samples prepared during different CVD Atomic force microscopy This analysis was used for investigation of surface morphology especially for the evaluation of roughness. The measurement was took place using atomic force microscope ATM/STM 5500 (Pico Plus) in tapping mode. Used type of a tip was SiN with frequency of oscillation from 200 to 400 khz Photocatalytic activity Photocatayltic experiments were performed in a flow reactor (4.5.7) on a rotary sample holder as well as in previous case. Photocatalytic activity was again evaluated as a degradation rate of DCIP. Before the experiment, each sample was irradiated for 10 minutes under the light source with required intensity to activate titania photocatalyst. The total volume of used DCIP was 80 cm 3. The initial concentration of DCIP was mol dm 3 and as the UV light source was used Philips Metal-halide lamp HPA 400/30 SD. Its emission spectrum is shown in Fig. 39. The experiments run under the same conditions as in case However two intensities of irradiation (7.5 W cm 2 and 10 W cm 2 ) were used for comparison of their effect on final samples activity. Each sample was measured twice and subsequently the average value of rate constant was calculated. The final time for all experiments was 40 minutes. The photocatalytic activity of these titania layers was compared with the results for hydrothermal printed layers. Reactivity of TiO 2 was calculated for 1 gram of photocatalyst. The activity of these samples could not be compared with results for sol gel method because arrangement of experiments was different and also different source of light with varied intensities were used. 65
67 viscosity (mpa s) 5 RESULTS AND DISCUSSION 5.1 Sol-gel process In this part of study we investigated the influence of added amount of PEG and sol loading on final physical properties and photocatalytic activity. PEG was used as anticracking agent and all sols were prepared according the procedure describing above (4.3.1). All layers of TiO 2 were prepared by the sol-gel process and deposited by new technique called material printing onto pre-treated soda-lime glasses. We used three different types of sol loading (100 %, 90 % and 80 %) Study of viscosity and density The prepared sols were characterized by examination of their viscosity and density. The viscosity was measured during seventeen days because it was the maximal time for their storage before their deposition. Changes in rheological properties of prepared coating mixture were studied during this time. We discovered that the viscosity changed negligible. These results indicate that all sols can be stored at the temperature of 5 C for the time without any significant change of their rheological properties PEG PEG PEG PEG time (day) Fig. 43 Changing of the viscosity during seventeen days The density of prepared coating mixture was measured by densitometer DMA4500. After the comparison we discovered that density increases with increasing amount of added PEG to the samples. The exact values are summarized in the following table (Table 4). Table 4 Density of prepared sols Type of sol Density (g/cm 3 ) PEG PEG PEG PEG

68 5.1.2 Study of the thickness The thickness of all prepared thin films was studied using NanoCalc We investigated the influence of added amount of PEG and sol loading on final thickness value. We observed insignificant difference between the samples PEG 0 and PEG 1. On the other side, there is the notable decreasing in the thickness for PEG 16 apparently caused by the removal of the organic matrix. We discovered that viscosity is changing with the addition of PEG in the previous study. This variation of viscosity would have a significantly influence in spin-coating or in dipcoating. Nevertheless, the observed change of the viscosity does not affect the film thickness of the inkjet printed layers. Within the studied viscosity range, the drops are formed in the same way, their amount as well as their volume are constant, so also the thickness of the printed layers has to be independent on the viscosity (but influenced by the organic matrix fraction content). We also confirmed that with increasing sol loading the thickness of prepared TiO 2 films increase. This result was supposed because when we have sol loading 100 % it means that we had to use more droplets during the printing. And because also in case of 80 % sol loading we created homogeneous layer it means that thickness had to be smaller than case of 100 % sol loading. Received results are shown in Fig. 44. Fig. 44 The influence of PEG s amount and sol loading on final thickness of thin layers Optical microscopy The quality of prepared titania films was studied by optical microscope in polarized light, with the magnification 10. We found out that all prepared layers adhered well to the sodalime glass after the calcinations process and all were optically transparent. 67


69 80 % 90 % 100 % PEG 0 PEG 1 PEG 4 PEG 16 Fig. 45 The influence of the sol loading and amount of PEG on the cracking intensity 68
 the cracks are less frequent.")
. This phenomenon was observed in all prepared samples.")
70 The influence of sol loading and PEG content on the optical properties of prepared layers was examined. After the comparison of different sol loading we found out that with decreasing film thickness (decreasing sol loading) the cracks are less frequent. In case of 80 % sol loading, there were no cracks present in the structure (Fig. 45). This cracking is caused by a tensile stress, which arises during the thermal treatment of layers. The added PEG to the sol induced a gradual suppression of cracking. After the reaching concentration 4 g dm 3 all cracks disappeared (Fig. 45). This phenomenon was observed in all prepared samples. We supposed that the free volume created by PEG decomposition enables a stress-free arrangement of titania crystallites created during the calcinations step and in this way the formation of cracks is suppressed Scanning electron microscopy SEM analysis was performed using microscope MIRA II LMU, Tesan. The SEM images (Fig. 46) give us a detailed look at appearance of the printed layer at the nanoscale. We can roughly estimate the size of primary crystallites to be approximately in the range of nm. We can also clearly see that the way the primary cracks develop at the nanoscale is different: with the addition of PEG, the primary nanocracks are shorter and more frequent. We assume this contributes to better relaxation of tensional stresses occurring during the calcination of the layer and thus prevent the formation of larger microcracks. 69
 during this analysis.")
. The mean roughness is the arithmetic average of the absolute values of the roughness profile ordinates. 136 R q 1 L L 0 Z 2 ( x) dx (22) Fig.")
71 Fig. 46 SEM images of titania layers Atomic force microscopy The surface topology of prepared layers was studied by AFM analysis. Using this method, the influence of added PEG amount on the final roughness of prepared films was investigated. We calculated the root mean square roughness (R q ) during this analysis. The root mean square roughness is the root mean square average of the roughness profile ordinates calculated according the following formula (22), where Z(x) is profile ordinates of roughness profile (Fig. 47). The mean roughness is the arithmetic average of the absolute values of the roughness profile ordinates. 136 R q 1 L L 0 Z 2 ( x) dx (22) Fig. 47 Roughness profile 136 We compared the sample without PEG (PEG 0) and the sample with the highest amount of PEG (PEG 16). We discovered that PEG causes an increase of surface roughness (surface 70


72 roughness of the sample PEG 0 was 0.28 nm; surface roughness of PEG 16 was 0.41 nm). The obtained records are shown in the following figure (Fig. 48). a R q =0.28nm 2.07 nm 500 nm 500 nm 250 nm 250 nm 0 nm 0 nm b R q =0.41 nm 3.25 nm 0 nm 500 nm 500 nm 250 nm 250 nm 0 nm 0 nm Fig. 48 Comparison of the roughness; a) PEG 0; b) PEG Photoinduced hydrophylicity The hydrophilic properties of prepared layers were evaluated by measuring water contact angle as a function of the incident UV light exposure dose. Firstly, we studied the freshly prepared films. It means the films which were not older than 24 hours. We discovered that all these films showed superhydrophilic character (Fig. 49). Superhydrophilic layers are considered those contacts angles of which are lower than 5. a b Fig. 49 Water droplets placed onto the freshly prepared layers; a) PEG 0; b) PEG 16 Afterwards titania samples were stored in darkness for 10 days. After this time, quite a high increasing of contact angle could be observed. All contact angles were higher than 50. Nevertheless, after the irradiation of these layers by UV light with intensity of irradiation 71
73 15 W/m 2 all samples converted to hydrophilic nature again within 10 minutes. This could be explained in two ways. One of them is that by UV illumination the holes are transferred to the surface, creating oxygen vacancies most likely at the two coordinated bridging sites, which are suitable for dissociative water adsorption. Photoproduced electrons are also transferred to the surface Ti 4+, forming Ti 3+ followed by the electron transfer to adsorbed 137, 138 oxygen molecules. But on the other side, recent communication by Yates and co-workers suggest that photoproduced hydrophilic behavior on TiO 2 does not involve the production of surface oxygen vacancy defect sites, enhanced surface Ti-OH coverage on defect sites, or the modified surface bonding of bridging OH groups. They explain the hydrophilic properties as the production of the critical surface condition at the perimeter of a water droplet, which covers a hydrocarbon coated TiO 2 surface. And they discovered that gas phase O 2 is necessary to cause the photoinduced hydrophilicity effect. 139 Exposure dose (kj/m 2 ) PEG0 PEG1 PEG4 PEG Fig time (min) Decreasing of water contact angle after 10 minutes of irradiation In this study we discovered that the conversion from hydrophobic to hydrophilic properties was faster with increasing of PEG amount in the sol (Fig. 50). It could be caused by a smaller hydroxyl group content and smaller surface roughness for PEG 0 so in this case water could not so easily enter the interior region of the thin films. In part we found out that with increasing amount of PEG the roughness of titania surface increase so also larger surface area. The coating films with larger surface area are more easily attacked by the water vapour to produce more hydroxyl groups. Hydroxyl groups existing in the coating films are attributed to the chemically adsorbed H 2 O and also some H 2 O is physically adsorbed on the surface of TiO 2 coating films. Generally, with the increasing of chemically adsorbed hydroxyl groups on the surface, van der Waals forces and hydrogen bonds interactions between water and hydroxyl groups will be 72
74 absorbance increased. Water can easily spread across the surface and the hydrophilic character will be enhanced Photocatalytic activity The photocatalytic activity was evaluated as a degradation rate of DCIP realized in bath reactor. The first step of the degradation is dechloration accompanied by discoloration. Then, the oxidation of carbon skeleton follows, leading to the creation of short carboxylic acids. Finally, these acids undergo decarboxilation and are totally cleaved. 141, 142 DCIP was chosen due to its very easy detection in VIS range and a very low absorption at 360 nm wavelength. DCIP solutions of known concentration were prepared to create a calibration curve. Absorption characteristic were measured in range nm. We observed that the absorption maximum corresponds to 600 nm (Fig. 51). The calibration curve was obtained as a dependence of maximum absorbance on the molar concentration of the solution. The linear function was calculated as y = 14601x with R 2 = M M M M M M M M wavelength (nm) Fig. 51 VIS absorption spectrum of DCIP We discovered that a dependence of logarithm of concentration on time is linear (Fig. 52) so it means that photochemical degradation of DCIP runs according to first order kinetics. The oxidation reaction of the DCIP is much more complicated process than the first order reaction described by the equation (5). On the other hand the determination coefficient calculated for all studied samples was more than 0.98, which means that the selected reaction model was correct. The degradation reaction is than characterized by a formal rate constant. An experiment with the blank (without photocatalyst) was carried out and final value of direct photolysis was subtracted from the final measurement values to obtain the net photocatalytic efficiency. The rate constant was calculated according to the equation (23), 73
75 ln (c 0 /c) where the rate constant is equal to the slope of the straight line. It was observed that not only photocatalytic degradation of DCIP on the TiO 2 surfaces with the rate constant k i as an average of three measurements occurred. Also direct degradation of the dye appeared under the set irradiation conditions. That is why the average rate constant k 0 for the direct degradation out of two measurements was calculated. The rate constant k describes 0 a degradation reaction of the DCIP without any TiO 2 layer present in the reactor. The final formal rate constant was calculated as ki k0 for each sample. The standard deviation of the formal rate constants was calculated according to the equation (24). c c f t ln (23) A0 A Δ 2 2 Δk i Δk 0 (24) i 0 k i k 0 k i k 0 k k PEG0 PEG1 PEG4 PEG time (min) Fig. 52 Dependence of logarithm of concentration on time We compared the influence of PEG and sol loading on final photocatalytic activity of prepared TiO 2 in this part of study. We discovered that samples with PEG have higher activity than the sample without PEG (Fig. 53). This can be accounted for the higher roughness of the thin layers surface, which is created by the present of PEG (5.1.5). Consequently, we investigated the influence of sol loadings on the titania photocatalytic reactivity. We found out that the samples with 100% sol loading were the most photocatalytically active (Fig. 53). It can be explained by presence of higher amount of photocatalysts with increasing sol loading. 74
76 k (min -1 ) % 90% 100% PEG 0 PEG 1 PEG 4 PEG 16 Fig. 53 Photocatalytic activity of prepared TiO 2 75
77 Absorptance (%) absorptance (%) Absorptance (%) absorptance (%) 5.2 Hydrothermal synthesis Preparation of TiO 2 colloidal solution Twelve samples were prepared by hydrothermal synthesis with varying process conditions, especially ph, temperature or duration of process. Subsequently, the physical properties of prepared solutions were examined by UV-VIS spectroscopy, XRD analysis, Photon correlation spectroscopy, Transmission electron microscopy. Finally, the photocatalytic activity was evaluated as the degradation rate of formic acid UV-VIS spectroscopy Total transmission and total reflectance were measured using UV-VIS spectroscopy. Consequently, the final absorption was calculated according the formula (18). The results from this analysis are shown in Fig. 54. As we can observe the absorption maximum is situated in all samples nearly in the same position, closely 323 nm. basic, 110 C acid, 110 C h 24h 48h h 24h 48h (nm) (nm) basic, 160 C 6h 24h 48h (nm) acid, 160 C 6h 24h 48h (nm) Fig. 54 Absorptance calculated from transmission and reflectance measurement 76
78 For better understanding of the relationship between the optical properties and the photocatalytic activity, the average UV absorption (Ā UV ) of titania colloidal solutions was determined. We expected that TiO 2 with higher (Ā UV ) are more photocatalytic active. The values of (Ā UV ) were calculated from the sum of integrated absorptance in the range of wavelength from absorptance minimum to the absorptance value at 290 nm divided by the difference of these wavelength values 143 (25). All received results are summarized in Table 5. A UV ( 290 A A min) 100 ( A min) d 290 (25) We can observe, higher values for acid titania slurries indicate that these samples should be more active than the same samples prepared in basic ph. After the comparison of different temperature of hydrothermal synthesis we discovered that higher values were reached for temperature 110 C in acidic samples. We consequently discovered that the samples prepared at this temperature were more stable (Fig. 55). In the case of basic ph, higher average absorption was observed in for 160 C. Again these solutions were more stable and we supposed that also they should be more active. Table 5 Wavelength of minimal and maximal absorption and average UV absorption of colloidal suspensions of TiO 2 ph Temperature Time Amin (nm) Amax (nm) Average UV absorption 6 h C 24 h Acid 48 h h C 24 h h h C 24 h Basic 48 h h C 24 h h
79 5.2.3 Gravimetric analysis Firstly, the concentration of prepared samples was examined gravimetrically. All obtained results are summarized in Table 6. When we compared received values, we discovered that the concentration of the samples decreased with increasing time of hydrothermal synthesis. We also found out that more concentrated solutions were prepared in basic environment. Table 6 Comparison of concentration ph Temperature Time Acid 110 C 160 C Concentration (% wt.) 6 h h h h h 1.03 Basic 110 C 160 C 48 h h h h h h h 0.70 We investigated the stability of prepared colloidal solution after 1 day of leaving in a rest using gravimetric analysis. The obtained results are shown in Fig. 55. We discovered that with increasing time of hydrothermal treatment the stability of TiO 2 particles increases except the samples prepared at 110 C in basic ph. These slurries had constant stability. This result can be explained by decreasing of particle size with increasing time of hydrothermal treatment (Fig. 57) so the sedimentation was lower in the case of longer time. After the comparison of different ph we found out that samples prepared in acidic environment were more stable. When we compared different temperatures, 110 C in acid ph and 160 C in basic ph was evaluated as better temperature for preparation hydrothermal titania solutions. 78
80 stability of samples (%) stability of samples (%) ph 10 ph C 160 C C 160 C h 24 h 48 h time 0 6 h 24 h 48 h time Fig. 55 Stability of samples after 1 day Study of crystallinity and crystallite size Crystalline phase in the sample was identified from X-ray powder diffraction pattern. Obtained spectra are shown in Fig. 56. After the results evaluation we discovered that all samples prepared in basic ph were pure anatase with the main peak in position around 25.2 (Fig. 56). This result is in a good agreement with our assumption because it is well known that basic ph support the creation of pure anatase phase. 144 When we evaluated the spectra obtained for TiO 2 prepared in acid ph we discovered that in all cases except the sample prepared at 110 C and treated for 6 hours, we received a mixture of anatase and rutile. In the mentioned case we obtained a mixture of rutile and anatase with main peak in the position 27.4.This deviation could be caused by reaching lower ph than 2 after the addition of 0.9 cm 3 of HCl. We added still the same amount for HCl but for this sample we reached ph of only 1.7 instead of 2. This decreasing caused probably creation of rutile as the major phase. In other cases as well as in basic environment the dominant phase was anatase with the position of the main peak in 25.2 (Fig. 56). We also found out that with increasing temperature the width of the main peak decreases. This dependence was observed in acidic as well as in basic environments. Also, this dependence was discovered for increasing ph at temperature 160 C. No similar dependence was presented for temperature 110 C. Generally it is known that narrow peak indicates higher crystallite size. 79
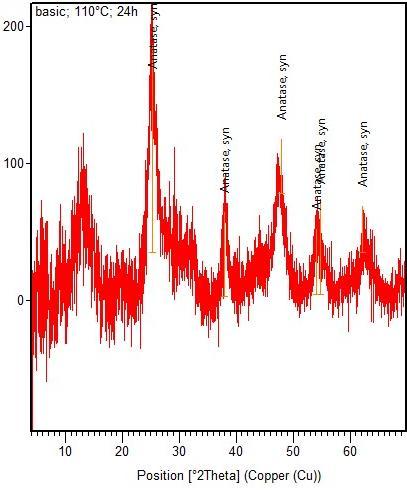
81 80
82 81
83 Fig. 56 XRD spectra for all studied TiO 2 solutions Using the Scherrer equation (19) we could calculate the mean crystallite size. The obtained results are summarized in table (Table 7). We found out that the crystallite size decreases in the acidic environment with increasing time. However, we could observe no such dependence between the time of hydrothermal treatment and the crystallite size in the basic environment. After the comparison of samples prepared in same ph but with using different temperature we discovered that with increasing temperature the crystallite size increases as well. This 42, 145 result is in a good agreement with the previously published data. 82
84 Table 7 Crystalllite size ph Temperature Time Acid 110 C 160 C Crystallite size (nm) 6 h h h 9 6 h h h 26 Basic 110 C 160 C 6 h h 9 48 h 14 6 h h h Evaluation of particle size The analysis of particle size was performed by photon correlation spectroscopy techniques. All prepared samples were studied by this analysis. Obtained results are summarized in Table 8. When we compared these results with results from XRD analysis we discovered that results do not correlate. However we needed only the information if the particles were not higher than 450 nm what is the limit for printing technique. By this method we discovered that aggregates in our solutions were not higher than 200 nm so there slurries were usable for material printing. 83
85 Table 8 Particle size ph Temperature Time Acid 110 C 160 C Particle size (nm) 6 h h h 12 6 h 3 24 h h 30 Basic 110 C 160 C 6 h h h 16 6 h h h Transmission electron microscopy Transmission electron microscopy was used for particle size comparison of the TiO 2 prepared at temperature 160 C. The aggregation of particles can be observed by this method. TiO 2 colloidal systems created at 160 C was chosen because for these samples we discovered increasing of particle size with increasing time of hydrothermal treatment. This result was in disagreement with the results from XRD analysis. We supposed that this increasing could be caused by particles aggregation. We could not observe any dependence between crystallite size and time of hydrothermal treatment for basic solutions by XRD analysis. However, we received quite difference results from this electron microscopy analysis. We found out that with increasing duration of the hydrothermal treatment the crystallite size decrease (Fig. 57). It is the same dependence which we observed in the acidic environment by XRD analysis. By this method we also confirmed that really in the case of longer time of hydrothermal treatment we saw higher particles aggregation. This aggregation might be the main reason why we recorded such high value of particle size by photon correlation spectroscopy. Indeed, the particles were smaller than 15 nm actually for time 48 hours. 84


 and consequently used to establish the type of")
86 Fig. 57 TEM images for basic samples prepared at 160 C; left- 6h; middle-24h; right-48h Subsequently, we used this method for investigation of TiO 2 crystallinity. We compared the particles shape of samples prepared in acidic and in basic ph. We discovered that in basic solutions, strictly cubic particles were present (Fig. 58). This result confirmed the result from XRD analysis where we found out that these TiO 2 were pure anatase because cubic shape is typical for anatase phase. 146 In the case of acidic environment, we could observe also rods apart from the cubic shape (Fig. 58). This shape confirms the presence of rutile phase. 147 So we affirmed that the samples prepared in ph of 2 consist of anatase and rutile mixture. These results are consistent with the results of XRD analysis. Fig. 58 TEM images samples prepared in basic ph (left) and in acid ph (right) Band gap energy Absorption coefficient was calculated according equation (21) and consequently used to establish the type of band-to-band transition in these TiO 2 nanoparticles. The dependence of molar absorption coefficient was recorded as a function of the photon energy for direct (Fig. 59) as well as for indirect transition (Fig. 60). Subsequently, the extrapolation for value = 0 was performed from which the band gap energy was found. Generally, it is known that band 85
87 gap energy of TiO 2 in anatase phase is 3.23 ev and rutile phase 3.03 ev. Obtained results are summarized in table (Table 9). Table 9 Band gap energy for direct and indirect transition ph Temperature Time Band gap energy (ev) Direct Indirect 6 h C 24 h Acid 48 h h C 24 h h h Basic 110 C 160 C 24 h h h h h h 24h 48h basic, 110 C h 24h 48h acid, 110 C ( h ( h h h 86
88 ( h h 24h 48h basic, 160 C h ( h h 24h h acid, 160 C h Fig. 59 Evaluation of band gap energy from direct transition 6 6h 24h 48h basic, 110 C 8 6 6h 24h 48h acid, 110 C 4 ( h ( h h h 8 6 6h 24h 48h basic, 160 C 8 6 6h 24h 48h acid, 160 C ( h 4 ( h h h Fig. 60 Evaluation of band gap energy from indirect transition 87
89 We discovered that all prepared TiO 2 were indirect semiconductors from this analysis. After the comparison of individual samples, we found out that TiO 2 prepared in basic ph had their band gaps around value of 3.23 ev what is typical for anatase phase. On the other side we can observe the blue shift for acid samples. It can be caused by presence of rutile phase Photocatalytic activity The photocatalytic activity was evaluated by the degradation rate of formic acid. We compared the rate constant of prepared TiO 2 and evaluated the best conditions of hydrothermal treatment for final activity. We investigated the decreasing of FA concentration because of UV radiation by HPLC analysis. A record of this analysis is shown in the Fig. 61. It is the dependence of peak intensity (mau) on the retention time (min). In this figure we can observe decreasing of FA peak (in the position 11.4 min) which characterized the decreasing of FA concentration. There is also noticeable peak in the position 4.7 min that correspond to the injection peak. The concentration of FA was calculated from the height of the peak. For this purpose it is necessary to perform a calibration (Fig. 62). A linear function was calculated as y = x with R 2 = Fig. 61 Record of HPLC analysis; acid sample; 160 C; 6 hours 88
90 height (mau) y = x c ( mol / dm 3 ) Fig. 62 Calibration curve of formic acid We examined the decreasing of relative concentration as a function of time. We discovered that the profile of time-dependent photocatalytic reactivity is linear within the studied range (Fig. 63), so we conclude that our degradation reactions run according to the zero kinetics model. Subsequently, we calculated the rate constants (k) and their standard errors (SE) for all prepared samples. The comparison of received results is shown in Fig basic; 110 C 1.0 acid; 110 C c / c h 24h 48h P25 c / c h 24h 48h P time (min) time (min) 89
91 1.0 basic; 160 C 1.0 acid; 160 C c / c h 24h 48h P25 c / c h 24h 48h P time (min) time (min) Fig. 63 FA concentration decreasing during degradation process We discovered that the higher photocatalytic activity was reached for samples prepared in acid ph from this investigation. This phenomenon was observed for both used temperatures. This result was expected because in these solutions we found higher values of absorptions (Table 5). Also we found out that with increasing ph we received higher particle size (Table 8). And it is well known that the bigger particles have smaller specific surface areas which lead to lower photocatalytic activity. The other factor which can contribute to lowering of TiO 2 activity was the reduction of rutile phase with increasing ph. It is discovered that mixture of anatase and rutile has higher photocatalytic activity than pure anatase. Finally, the stability of prepared colloidal solutions can also contribute to results photocatalytic activity and we discovered that higher stability was observed for the samples prepared in acid ph than the basic samples. After the comparison of process temperature we could observe differences between the basic and acidic titania solutions. We discovered that the photocatalytic activity decreases with increasing treatments temperature in acidic environment. This result can be explained by increasing crystallite size with increasing process temperature (Table 7) which means that the specific surface area decreases entailing the decreasing of TiO 2 activity. We also found that samples prepared in acid ph at higher temperature had a lower absorption and smaller stability which also leads to lower photocatalytic activity. In the case of basic ph, we observed the opposite dependence. It means that with increasing process temperature the activity of prepared samples increased. We found out that TiO 2 solutions prepared at temperature 160 C showed higher stability and absorption of UV light. We also discovered higher band gap energy for these samples (Table 9) which can contribute to lower probability of recombination and consequently to higher activity. When we studied the influence of treatment time on the final photocatalytic activity, we discovered that in acidic environment at lower temperature the photocatalytic activity increases with increasing duration of hydrothermal treatment. This dependence was not observed at 160 C. This phenomenon can be explained by crystallite size. As was written in previous part, (5.2.4) the crystallite size decreases with increasing treatment time at 90
92 k (min --1 ) k (min --1 ) k (min --1 ) k (min --1 ) temperature 110 C what leads to higher specific surface area and consequently to higher photocatalytic activity. The differences between the crystallite sizes in case of 160 C was not so significant what correspond to similar value of photocatalytic activity. basic; 110 C acid; 110 C h 24h 48h P25 0 6h 24h 48h P25 basic; 160 C acid; 160 C h 24h 48h P25 0 6h 24h 48h P25 Fig. 64 Comparison of rate constants k ( 10 6 min 1 ) In basic ph at temperature 160 C we also observed the increasing of photocatalytic activity. We suppose that decreasing of particle size discovered in section contributed to this enhance. At the temperature 110 C, the photocatalytic activity for this kind of samples is again similar. According to this analysis, the best samples were prepared in acid ph at 110 C. After the comparison of these samples with commercial TiO 2 (P25) we discovered that our best samples (acidic, 110 C, 24 hours and 48 hours) were comparable with P25. In this part of work we discovered that the process conditions have the significant influence on the photocatalytic activity and also on the final physical properties of prepared samples. We discovered that acid solutions had better physical properties and also better final photocatalytic activity. Therefore these samples were chosen for further investigation. 91

93 5.3 Printed layers of TiO 2 prepared by hydrothermal synthesis Preparation of thin titania films The colloidal solutions of TiO 2 were prepared by hydrothermal synthesis under the different conditions. These samples were used for formation of printing mixtures. Sodalime glass substrates were coated using experimental printer FUJIFILM Dimatix. Different surfactants were used as stabilization agents. Firstly, we tried the neutral (Tween 20) (Fig. 65). We observed decreasing of aggregation using this compound but this decreasing was not sufficient. It means that still quite high amount of TiO 2 particles remained in the mesh size syringe filter. Consequently, we tried one anion active surfactant (Abesone) (Fig. 65) and one cation active surfactant (CTAB) (Fig. 65). We observed that only in case of anion active surfactant the aggregation of colloidal particles was completely removed. Cation active Anion active Neutral Fig. 65 Used surfactant; CTAB (left); Abesone (right); Tween 20(bottom) We prepared TiO 2 one- and two-layers samples by material printing. This part of study focuses on investigation of thickness influence on final physical properties and photocatalytic activity of the prepared samples. TiO 2 thin films were fixed on the substrate drying at temperature 550 C for 30 minutes. The amount of deposited titania particles was evaluated by gravimetric measurement. The obtained results are summarized in table (Table 10). We discovered that in the case of double-layers, the amount increased twice. It means that deposition rate during whole printing 92
94 process was constant because printing of double-layer takes twice more time than in case of one-layer. Table 10 Results from gravimetric analysis Sample 110 C 160 C P25 6 h 24 h 48 h 6 h 24 h 48 h 1 layer layers layer layers layer layers layer layers layer layers layer layers layer layers Amount of TiO 2 (g) XRD analysis The X-ray diffraction patterns of the systems allowed us to identify the crystal phase in TiO 2 systems. All studied powders were pure rutile. This result indicates that the final crystallite phase is mostly dependent on used ph, on temperature and time of hydrothermal synthesis in less extent. All investigated samples were prepared at ph 1 in contrast of the previous work (5.2.4) where TiO 2 was prepared at ph 2. This ph decreasing brought about change of TiO 2 crystallite phase from mixture of anatase and rutile to pure rutile (Fig. 66). This result is in good agreement with published data of Yin et al. 148 where they published that pure rutile is obtained at lower temperature of hydrothermal synthesis using ph around 1. 93
95 hours, 110 C 6 hours, 160 C hours, 110 C 24 hours, 160 C hours, 110 C 48 hours, 160 C Fig. 66 XRD records 94


96 5.3.3 Optical microscopy The quality of prepared layers was examined using Nikon Eclipse E200 optical microscope connected with a digital camera Nikon D70. The used magnification was 20 which were necessary for our purpose because the aim of our study was to compare the homogeneity of prepared films. All TiO 2 films deposited onto soda-lime glass plates showed milk color and they adhered to the glass substrate after the drying process. We studied the influence of different thickness on final homogeneity and appearance of prepared samples. We discovered that all doublelayers were darker that was caused by higher thickness and higher presence of TiO 2 nanoparticles. We also found out that more homogeneous samples were double-layer samples. We suppose that was caused again by higher amount of TiO 2 in the layers. When we compared the samples prepared by the sol-gel method where we had used ordinary printer Epson R220 ( ) and these samples prepared by material printer Dimatix we discovered that in these samples there were not presented any cracks. In the case of layers prepared by the sol-gel method we had to use PEG for removing these cracking (Fig. 45). 1 layer 2 layers 110 C 6 h 110 C 24 h 110 C 48 h 95


.")
97 160 C 6 h 160 C 24 h 160 C 48 h Fig. 67 Images from optical analysis Scanning electron microscopy The morphology of printed layers was examined by SEM method. The grains size of TiO 2 and the homogeneity of prepared layers were compared for samples synthesized under different conditions. This analysis confirmed that used time of hydrothermal treatment had an enormous influence of final morphology of printed layers Results form this analysis indicated that with increasing time of hydrothermal treatment the homogeneity of printed layers increased (Fig. 68). It is in a good agreement with the results from TEM analysis (5.2.6). The grain size of each sample was evaluated and we found out that the grain size decrease with increasing time of treatment (Fig. 68). These results were observed for both used temperatures. 96
; 24 h (middle); 48 h (right) 5.3.")


98 Fig. 68 Printed layers of titania synthesized at 110 C for different time; 6 h (left); 24 h (middle); 48 h (right) Atomic force microscopy We confirmed the result from SEM measurement by AFM analysis where we observed that with increasing time of hydrothermal treatment the grain size decreases (Fig. 69). The comparison of grain sizes was carried out from scans across 1 m 2 area. Apart from the evaluation of grain size, we also examined the roughness of prepared layers. We can observe obtained results in Table 11. We discovered that roughness (R q ) of prepared samples increases with increasing time of hydrothermal treatment 1 µm 6 hours 24 hours nm 1 µm nm 0.5 µm 0.00 nm 0.5 µm 0.00 nm 0 µm 0 µm 0.5 µm 1 µm 0 µm 0 µm 0.5 µm 1 µm 48 hours 97
 R q (nm) 6 40 110 C 24 84 48 91 6 60 160 C 24 53")
99 1 µm nm 0.5 µm 0.00 nm 0 µm 0 µm 0.5 µm 1 µm Fig. 69 Images from AFM analysis Table 11 Roughness of titania printed layers Temperature Time (hours) R q (nm) C C Photoinduced hydrophilicity Contact angle measurement by the method of sessile drop was carried out for the evaluation of hydrophilic properties of TiO 2 thin films. The analysis was performed during 30 minutes and we discovered that this time was not sufficient for reaching superhydrophylic properties for some samples. As a superhydrophilic surface we consider such surface where the contact angle of deposited drop is lower than 10. All obtained values are summarized in the tables (Table 12, Table 13). We found out that the contact angle decreasing was nearly the same for one-layers as well as for double-layers TiO 2 thin films in case of 6 hours and 24 hours (this result was observed for both treatment temperatures). The samples synthesized for the longest time had the smallest tendency change their hydrophobic properties. We observed the smallest decreasing of contact angle after 30 minutes of irradiation by UV light. 98
100 Table 12 Contact angle after different duration of irradiation for one-layer samples UV: 0 min UV: 10 min UV: 20 min UV: 30 min (0 30) min Exposure dose (kj m 2 ) h C 24 h h h C 24 h h Table 13 Contact angle after different duration of irradiation for two-layers samples UV: 0 min UV: 10 min UV: 20 min UV: 30 min (0 30) min Exposure dose (kj m 2 ) h C 24 h h h C 24 h h When we compared the results for one and two layers we discovered that for the same samples we obtained similar contact angle decreasing. After the absorption of quantum of light the electrons are generated in the conduction band and these electrons caused the reduction of Ti(IV) to Ti(III). Simultaneously in the valence band there were generated holes which oxidize the O 2 anions. During this process, oxygen atoms are ejected, creating oxygen vacancies. Water molecule can then occupy these oxygen vacancies, producing adsorbed OH groups, which tend to make the surface hydrophilic. 99
101 ln (c/c 0 ) ln (c/c 0 ) By comparing of contact angles decreasing for samples synthesized at different temperature we discovered that higher changes were reached for TiO 2 printed layers where titania colloid solution was prepared at lower temperature. This result was observed in all cases (for both thickness of layer and also for sample synthesized for different hydrothermal time) Photocatalytic activity The photocatalytic activity was evaluated as the degradation rate of DCIP in a flow reactor. The absorption maximum of DCIP was found at wave length 600 nm so the absorbance was recorded each minute at this value. The total time of reactions was 40 minutes because of complete decolonization of DCIP solution. Subsequently the constant rates for examined samples were calculated. The influence of layers thickness was investigated. The activities of our samples were compared with the photocatalytic activity of common commercial TiO 2 (P25). We discovered that logarithm dependence of relative concentration on time was linear for all prepared titania layers (Fig. 70). So we assumed that reaction runs according the first order kinetics within the studied range. The reaction rate constants (k), their standard errors (SE) and conversion degree were calculated (Table 14). 110 C; one layer time (min) h 24h 48h 110 C; two layers time (min) 100
102 ln (c/c 0 ) ln (c/c 0 ) h 24h 48h 160 C; one layer time (min) h 24h 48h 160 C; two layers time (min) Fig. 70 Confirmation of the first order kinetics The analysis was performed with intensity 7.5 mw cm 2. We discovered from this measurement that double-layers samples were more active. This result was supposed because of higher presence of TiO 2 in the double-layers, i.e. more photocatalyst and so higher amount of photoactive sites. Although the amount of deposited TiO 2 in case of double-layers increased twice (Table 10) we did not observe increasing of photocatalytic activity two times. It means that all titania particles didn t participate of photocatalytic degradation process. It could be cause by using insufficient intensity for activation of all photocatalysts. Also there could be the influence of a steric effect which could cause adsorption of lower amount of DCIP. When we compared TiO 2 hydrothermally treated for different time we discovered that samples synthesized for longest time were the most active (Table 14). It could be caused by the decreasing of crystallite size with increasing of treated time which was found out in previous part of the study (Table 7) and also by SEM (5.3.4) and AFM (5.3.5) analysis. Smaller crystallite size leads to higher specific surface area and to increasing of photocatalytic activity
103 Table 14 Formal 1st order rate constant, their standard errors and conversion degree for experiment took place using intensity 7.5 mw cm 2 Sample k (min 1 ) SE (min 1 ) Conversio n degree (%) 110 C 160 C P25 6 h 24 h 48 h 6 h 24 h 48 h 1 layer layers layer layers layer layers layer layers layer layers layer layers layer layers Photocatalytic activities of all samples including P25 per 1 g of photocatalyst are shown in Fig. 71. The final standard error was influenced by the SE of partial measurement (calculation of constant rate and SE of weighting). Final standard error was calculated according the equation (26) 150. When the considered values are independent r is equal to 0. When there is a total dependence r is equal 1. Because rate constant is dependent on the amount of photocatalysts only in a small range and consequently it is independent we considered r equals 0. Sk / m k / m 2 Sk k 2 Sm m 2 Sk 2r k Sm m (26) We discovered that P25 is the best photocatalyst. Most of prepared samples had activity much lower than P25 only TiO 2 synthesized for 48 hours at 160 C showed a comparable efficiency. This difference between our TiO 2 and P25 was probably caused by the different phase of TiO 2. In case of P25 there was mixture of anatase and rutile however all our titania were pure 102
104 k/m (min -1. g -1 ) rutile. So this result was expected because it is well known that mixture of anatase and rutile is much more active than only pure anatase or pure rutile. So this supposition was confirmed in this part C; 6h 110 C; 24h 110 C; 48h 160 C; 6h 160 C; 24h 160 C; 48h P layer 2 layers Fig. 71 Photocatalytic activity per gram 103
.")

105 5.4 Samples prepared by CVD Preparation of samples Apart from the material printing, CVD method was used as a second technique for the preparation of thin TiO 2 films. The samples were prepared during two depositions cycles. The duration of vacuum creation and age of precursor were the parameters which were different (Table 3). Physical properties as well as photocatalytic activity of the titania layers was evaluated and we studied the influence of substrate positions and influence of different parameters of CVD on final properties. The position of substrates on susceptor is shown in Fig. 72. Fig. 72 Position of glassy carbon during CVD processes Gravimetric analysis Gravimetric analysis was performed for each sample and deposited amount of TiO 2 was evaluated. We can observe the results from this analysis in Table 15. We discovered that in case of sample 1, higher amount of TiO 2 was deposited. This difference was probably caused because of different CVD process. Sample 1 was prepared in the first deposition where we used old precursor. Before the second deposition we had to change TTIP and the others samples were prepared with the new precursor. We supposed that this difference comes from using the new precursor. Table 15 Amount of deposited TiO 2 by CVD method Sample Amount of TiO 2 GC-1 GC-2 GC-3 GC mg mg mg mg 104
106 5.4.3 XRD analysis XRD analysis was used for the characterization of crystallite phase of prepared TiO 2 layer. Because used temperature has the main influence on crystallite phase that, we supposed the preparation of the same titania modification in all cases. We worked at temperature 350 C in both cases (Table 3). We found out that all prepared titania were pure anatase. Obtained spectra are shown in Fig. 73. GC-1 GC Fig. 73 XRD spectra SEM analysis SEM analysis was performed on LEO43VP microscope. The SEM images give us a detailed look at the appearance of the TiO 2 layers (Fig. 74). We can observe difference between the grain size of first sample (GC-1) and the others. This sample was prepared during a different CVD process (Table 3). The parameters which were changed in the second CVD were time for the creation of vacuum and the age of precursor. In the first case, the duration of vacuum creation was 1.5 hours in the second one there was 2 hours. It means that only small changes in the process parameters can influence the final properties of prepared layers. Also the age of TTIP could influence the morphology of prepare TiO 2 layer. Consequently, the thickness of prepared TiO 2 layers was evaluated by a cross section analysis (Fig. 75). We discovered that thicker layers were prepared during the first CVD (around 2.6 m). Thickness of the second films was evaluated around 2 m. 105


107 GC-1 GC-2 GC-3 GC-4 Fig. 74 SEM images of titania surface First CVD Second CVD Fig. 75 SEM images (cross section) 106
.")
108 5.4.5 AFM analysis The topology and roughness of prepared layers was examined by AFM. We studied 1 m 2 area and each sample was analyzed on five different places. Roughness was calculated as an average value from five records (Table 16). The mean roughness R a (roughness average) was calculated according the following formula (27) 136, where Z(x) is the profile ordinate of roughness profile. R a 1 L L 0 Z( x) dx (27) Obtained results are summarized in the following table (Table 16). After the comparison of a grain size of sample GC-1 (sample prepared during first CVD process) and the other samples we discovered that this sample is consisting of bigger grains (Fig. 76). This result confirmed the result from SEM analysis (Fig. 74). We also observed higher roughness in this case (Table 16). GC-1 GC-2 Fig. 76 Images from AFM analysis Table 16 Roughness of TiO 2 layers prepared by CVD Sample GC-1 GC-2 GC-3 GC-4 R a 65.2 nm 47.1 nm 39.6 nm 25.9 nm 107
Litosil - application
 Litosil - application The series of Litosil is primarily determined for cut polished floors. The cut polished floors are supplied by some specialized firms which are fitted with the appropriate technical
CARBONACEOUS PARTICLES IN THE AIR MORAVIAN-SILESIAN REGION
 UHLÍKATÉ ČÁSTICE V OVZDUŠÍ MORAVSKO- SLEZSKÉHO KRAJE CARBONACEOUS PARTICLES IN THE AIR MORAVIAN-SILESIAN REGION Ing. MAREK KUCBEL Ing. Barbora SÝKOROVÁ, prof. Ing. Helena RACLAVSKÁ, CSc. Aim of this work
Effect of temperature. transport properties J. FOŘT, Z. PAVLÍK, J. ŽUMÁR,, M. PAVLÍKOVA & R. ČERNÝ Č CTU PRAGUE, CZECH REPUBLIC
 Effect of temperature on water vapour transport properties J. FOŘT, Z. PAVLÍK, J. ŽUMÁR,, M. PAVLÍKOVA & R. ČERNÝ Č CTU PRAGUE, CZECH REPUBLIC Outline Introduction motivation, water vapour transport Experimental
Inorganic technology
 Inorganic technology Sulfur and sulfur compounds Deposits: Elemental sulfur in sedimentary or volcanic deposits Sulfates Sulfides H 2 S in natural gas 1 Sulfuric acid Principle of sulfuric acid manufacture
CHAPTER 5 MODIFIED MINKOWSKI FRACTAL ANTENNA
 CHAPTER 5 MODIFIED MINKOWSKI FRACTAL ANTENNA &KDSWHUSUHVHQWVWKHGHVLJQDQGIDEULFDW LRQRIPRGLILHG0LQNRZVNLIUDFWDODQWHQQD IRUZLUHOHVVFRPPXQLFDWLRQ7KHVLPXODWHG DQGPHDVXUHGUHVXOWVRIWKLVDQWHQQDDUH DOVRSUHVHQWHG
Melting the ash from biomass
 Ing. Karla Kryštofová Rožnov pod Radhoštěm 2015 Introduction The research was conducted on the ashes of bark mulch, as representatives of biomass. Determining the influence of changes in the chemical composition
Gymnázium, Brno, Slovanské nám. 7 WORKBOOK. Mathematics. Teacher: Student:
 WORKBOOK Subject: Teacher: Student: Mathematics.... School year:../ Conic section The conic sections are the nondegenerate curves generated by the intersections of a plane with one or two nappes of a cone.
SPECIFICATION FOR ALDER LED
 SPECIFICATION FOR ALDER LED MODEL:AS-D75xxyy-C2LZ-H1-E 1 / 13 Absolute Maximum Ratings (Ta = 25 C) Parameter Symbol Absolute maximum Rating Unit Peak Forward Current I FP 500 ma Forward Current(DC) IF
Introduction to MS Dynamics NAV
 Introduction to MS Dynamics NAV (Item Charges) Ing.J.Skorkovský,CSc. MASARYK UNIVERSITY BRNO, Czech Republic Faculty of economics and business administration Department of corporate economy Item Charges
FIRE INVESTIGATION. Střední průmyslová škola Hranice. Mgr. Radka Vorlová. 19_Fire investigation CZ.1.07/1.5.00/
 FIRE INVESTIGATION Střední průmyslová škola Hranice Mgr. Radka Vorlová 19_Fire investigation CZ.1.07/1.5.00/34.0608 Výukový materiál Číslo projektu: CZ.1.07/1.5.00/21.34.0608 Šablona: III/2 Inovace a zkvalitnění
Transportation Problem
 Transportation Problem ١ C H A P T E R 7 Transportation Problem The transportation problem seeks to minimize the total shipping costs of transporting goods from m origins (each with a supply s i ) to n
Výukový materiál zpracovaný v rámci operačního programu Vzdělávání pro konkurenceschopnost
 Výukový materiál zpracovaný v rámci operačního programu Vzdělávání pro konkurenceschopnost Registrační číslo: CZ.1.07/1. 5.00/34.0084 Šablona: II/2 Inovace a zkvalitnění výuky cizích jazyků na středních
Projekt SPOLEČNÉ VZDĚLÁVÁNÍ PRO SPOLEČNOU BUDOUCNOST. Současná kosmonautika a kosmické technologie 2014
 Projekt SPOLEČNÉ VZDĚLÁVÁNÍ PRO SPOLEČNOU BUDOUCNOST Současná kosmonautika a kosmické technologie 214 Projekt přeshraniční spolupráce SPOLEČNÉ VZDĚLÁVÁNÍ PRO SPOLEČNOU BUDOUCNOST Carbon quantum dots as
Electrochemistry of Selected Phosphorus Oxoacids on a Bulk Pt Electrode. Tomas Bystron Martin Prokop Karel Bouzek
 Electrochemistry of Selected Phosphorus Oxoacids on a Bulk Pt Electrode Tomas Bystron Martin Prokop Karel Bouzek High Temperature PEM Fuel Cell (HT PEM FC) Operation temperature 130-200 C Enhanced rate
EXACT DS OFFICE. The best lens for office work
 EXACT DS The best lens for office work EXACT DS When Your Glasses Are Not Enough Lenses with only a reading area provide clear vision of objects located close up, while progressive lenses only provide
SOIL ECOLOGY the general patterns, and the particular
 Soil Biology topic No. 5: SOIL ECOLOGY the general patterns, and the particular patterns SOIL ECOLOGY is an applied scientific discipline dealing with living components of soil, their activities and THEIR
STUDYING OF NANOIRON PARTICLES MIGRATION IN HOMOGENEOUS ARTIFICAL CREATED AQUIFER IN 3-D ORDERING
 STUDYING OF NANOIRON PARTICLES MIGRATION IN HOMOGENEOUS ARTIFICAL CREATED AQUIFER IN 3-D ORDERING VEGAS (Research facility for subsurface remediation) Institute for Modelling Hydraulic and Environmental
GUIDELINES FOR CONNECTION TO FTP SERVER TO TRANSFER PRINTING DATA
 GUIDELINES FOR CONNECTION TO FTP SERVER TO TRANSFER PRINTING DATA What is an FTP client and how to use it? FTP (File transport protocol) - A protocol used to transfer your printing data files to the MAFRAPRINT
The Over-Head Cam (OHC) Valve Train Computer Model
 Valve Train Computer Model") The Over-Head Cam (OHC) Valve Train Computer Model Radek Tichanek, David Fremut Robert Cihak Josef Bozek Research Center of Engine and Content Introduction Work Objectives Model Description Cam Design
The Over-Head Cam (OHC) Valve Train Computer Model Radek Tichanek, David Fremut Robert Cihak Josef Bozek Research Center of Engine and Content Introduction Work Objectives Model Description Cam Design
Aktivita CLIL Chemie I.
 Škola: Gymnázium Bystřice nad Pernštejnem Jméno vyučujícího: Mgr. Marie Dřínovská Aktivita CLIL Chemie I. Název aktivity: Uhlíkový cyklus v přírodě Carbon cycle Předmět: Chemie Ročník, třída: kvinta Jazyk
DATA SHEET. BC516 PNP Darlington transistor. technický list DISCRETE SEMICONDUCTORS Apr 23. Product specification Supersedes data of 1997 Apr 16
 zákaznická linka: 840 50 60 70 DISCRETE SEMICONDUCTORS DATA SHEET book, halfpage M3D186 Supersedes data of 1997 Apr 16 1999 Apr 23 str 1 Dodavatel: GM electronic, spol. s r.o., Křižíkova 77, 186 00 Praha
Possibilities of removing H 2. S from gas from gasification of biomass
 Possibilities of removing H 2 S from gas from gasification of biomass Ing. Pavel Machač, CSc, Dr. Ing. Vladislav Krystl, Ing. Sergej Skoblja, Ing. Petr Chalupa Institute of Chemical Technology Prague Technická
Biosensors and Medical Devices Development at VSB Technical University of Ostrava
 VŠB TECHNICAL UNIVERSITY OF OSTRAVA FACULTY OF ELECTRICAL ENGINEERING AND COMPUTER SCIENCE Biosensors and Medical Devices Development at VSB Technical University of Ostrava Ing. Martin Černý Ph.D. and
PC/104, PC/104-Plus. 196 ept GmbH I Tel. +49 (0) / I Fax +49 (0) / I I
 / I Fax +49 (0) / I I") E L E C T R O N I C C O N N E C T O R S 196 ept GmbH I Tel. +49 (0) 88 61 / 25 01 0 I Fax +49 (0) 88 61 / 55 07 I E-Mail sales@ept.de I www.ept.de Contents Introduction 198 Overview 199 The Standard 200
E L E C T R O N I C C O N N E C T O R S 196 ept GmbH I Tel. +49 (0) 88 61 / 25 01 0 I Fax +49 (0) 88 61 / 55 07 I E-Mail sales@ept.de I www.ept.de Contents Introduction 198 Overview 199 The Standard 200
Outline of options for waste liquidation through gasification
 Outline of options for waste liquidation through gasification 1 Schematic diagram of co-gasification 2 Conditions for the waste and brown coal coprocessing - physical and mechanical properties (grain sizing,
Střední průmyslová škola strojnická Olomouc, tř.17. listopadu 49
 Střední průmyslová škola strojnická Olomouc, tř.17. listopadu 49 Výukový materiál zpracovaný v rámci projektu Výuka moderně Registrační číslo projektu: CZ.1.07/1.5.00/34.0205 Šablona: III/2 Anglický jazyk
Střední průmyslová škola strojnická Olomouc, tř.17. listopadu 49
 Střední průmyslová škola strojnická Olomouc, tř.17. listopadu 49 Výukový materiál zpracovaný v rámci projektu Výuka moderně Registrační číslo projektu: CZ.1.07/1.5.00/34.0205 Šablona: III/2 Anglický jazyk
Compression of a Dictionary
 Compression of a Dictionary Jan Lánský, Michal Žemlička zizelevak@matfyz.cz michal.zemlicka@mff.cuni.cz Dept. of Software Engineering Faculty of Mathematics and Physics Charles University Synopsis Introduction
Zubní pasty v pozměněném složení a novém designu
 Energy news4 Energy News 04/2010 Inovace 1 Zubní pasty v pozměněném složení a novém designu Od října tohoto roku se začnete setkávat s našimi zubními pastami v pozměněném složení a ve zcela novém designu.
Tento materiál byl vytvořen v rámci projektu Operačního programu Vzdělávání pro konkurenceschopnost.
 Tento materiál byl vytvořen v rámci projektu Operačního programu Vzdělávání pro konkurenceschopnost. Projekt MŠMT ČR Číslo projektu Název projektu školy Klíčová aktivita III/2 EU PENÍZE ŠKOLÁM CZ.1.07/1.4.00/21.2146
Univerzita Pardubice
 Univerzita Pardubice Fakulta chemicko-technologická Společná laboratoř chemie pevných látek Ústavu makromolekulární chemie AV ČR a Univerzity Pardubice Fyzikálně-chemické vlastnosti některých skel a tenkých
SEMI-PRODUCTS. 2. The basic classification of semi-products is: standardized semi-products non-standardized semi-products
 Second School Year SEMI-PRODUCTS 1. Semi-products are materials used for further processing. We produce them from incoming materials, for example from ingots, powders and other materials. We most often
Czech Republic. EDUCAnet. Střední odborná škola Pardubice, s.r.o.
 Czech Republic EDUCAnet Střední odborná škola Pardubice, s.r.o. ACCESS TO MODERN TECHNOLOGIES Do modern technologies influence our behavior? Of course in positive and negative way as well Modern technologies
Enabling Intelligent Buildings via Smart Sensor Network & Smart Lighting
 Enabling Intelligent Buildings via Smart Sensor Network & Smart Lighting Petr Macháček PETALIT s.r.o. 1 What is Redwood. Sensor Network Motion Detection Space Utilization Real Estate Management 2 Building
CHAIN TRANSMISSIONS AND WHEELS
 Second School Year CHAIN TRANSMISSIONS AND WHEELS A. Chain transmissions We can use chain transmissions for the transfer and change of rotation motion and the torsional moment. They transfer forces from
T E S T R E P O R T No. 18/440/P124
 CENTRUM STAVEBNÍHO INŽENÝRSTVÍ a.s. Zkušebna fyzikálních vlastností materiálů, konstrukcí a budov - Praha Zkušební laboratoř č. 1007.4 akreditovaná ČIA dle ČSN EN ISO/IEC 17025 Pražská 16, 102 00 Praha
Proč by se průmysl měl zabývat výzkumem nanomateriálů
 Proč by se průmysl měl zabývat výzkumem nanomateriálů Měření velikost částic Jak vnímat nanomateriály Pigmenty x nanopigmenty Nové vlastnosti? Proč se věnovat studiu nanomateriálů Velikost (cm) 10-1000
Spectroscopy. Radiation and Matter Spectroscopic Methods. Luís Santos
 Spectroscopy Radiation and Matter Spectroscopic Methods Spectroscopy Spectroscopy studies the way electromagnetic radiation (light) interacts with matter as a function of frequency, thus, it studies the
Characterization of soil organic carbon and its fraction labile carbon in ecosystems Ľ. Pospíšilová, V. Petrášová, J. Foukalová, E.
 Characterization of soil organic carbon and its fraction labile carbon in ecosystems Ľ. Pospíšilová, V. Petrášová, J. Foukalová, E. Pokorný Mendel University of Agriculture and Forestry, Department of
Laboratoř na čipu. Lab-on-a-chip. Pavel Matějka
 Laboratoř na čipu Lab-on-a-chip Pavel Matějka Typy analytických čipů 1. Chemické čipy 1. Princip chemického čipu 2. Příklady chemických čipů 3. Příklady analytického použití 2. Biočipy 1. Princip biočipu
CONTRIBUTION TO METALLURGICAL TECHNOLOGY CONTROL PROBLEMS PŘÍSPĚVEK K PROBLEMATICE ŘÍZENÍ METALURGICKÝCH TECHNOLOGIÍ
 CONTRIBUTION TO METALLURGICAL TECHNOLOGY CONTROL PROBLEMS Bajger Z. 1, Michalec J. 1, Kret J. 2, Bajgerová D. 2 1 VÍTKOVICE a.s., R&D division 2 VŠB - Technical University Ostrava PŘÍSPĚVEK K PROBLEMATICE
filtrační polomasky disposable respirators
 filtrační polomasky disposable respirators 347-351 respirátory REFIL respirators REFIL 352 masky a polomasky 3M masks and halfmasks 3M 353-362 respirátory a masky JSP respirators and masks JSP 363-366
Klepnutím lze upravit styl předlohy. nadpisů. nadpisů.
 1/ 13 Klepnutím lze upravit styl předlohy Klepnutím lze upravit styl předlohy www.splab.cz Soft biometric traits in de identification process Hair Jiri Prinosil Jiri Mekyska Zdenek Smekal 2/ 13 Klepnutím
WORKSHEET 1: LINEAR EQUATION 1
 WORKSHEET 1: LINEAR EQUATION 1 1. Write down the arithmetical problem according the dictation: 2. Translate the English words, you can use a dictionary: equations to solve solve inverse operation variable
Air Quality Improvement Plans 2019 update Analytical part. Ondřej Vlček, Jana Ďoubalová, Zdeňka Chromcová, Hana Škáchová
 Air Quality Improvement Plans 2019 update Analytical part Ondřej Vlček, Jana Ďoubalová, Zdeňka Chromcová, Hana Škáchová vlcek@chmi.cz Task specification by MoE: What were the reasons of limit exceedances
DC circuits with a single source
 Název projektu: utomatizace výrobních procesů ve strojírenství a řemeslech egistrační číslo: Z..07/..0/0.008 Příjemce: SPŠ strojnická a SOŠ profesora Švejcara Plzeň, Klatovská 09 Tento projekt je spolufinancován
ACOUSTIC EMISSION SIGNAL USED FOR EVALUATION OF FAILURES FROM SCRATCH INDENTATION
 AKUSTICKÁ EMISE VYUŽÍVANÁ PŘI HODNOCENÍ PORUŠENÍ Z VRYPOVÉ INDENTACE ACOUSTIC EMISSION SIGNAL USED FOR EVALUATION OF FAILURES FROM SCRATCH INDENTATION Petr Jiřík, Ivo Štěpánek Západočeská univerzita v
By David Cameron VE7LTD
 By David Cameron VE7LTD Introduction to Speaker RF Cavity Filter Types Why Does a Repeater Need a Duplexer Types of Duplexers Hybrid Pass/Reject Duplexer Detail Finding a Duplexer for Ham Use Questions?
Klepnutím lze upravit styl Click to edit Master title style předlohy nadpisů.
 nadpisu. Case Study Environmental Controlling level Control Fifth level Implementation Policy and goals Organisation Documentation Information Mass and energy balances Analysis Planning of measures 1 1
Výukový materiál zpracovaný v rámci operačního programu Vzdělávání pro konkurenceschopnost
 Výukový materiál zpracovaný v rámci operačního programu Vzdělávání pro konkurenceschopnost Registrační číslo: CZ.1.07/1. 5.00/34.0084 Šablona: II/2 Inovace a zkvalitnění výuky cizích jazyků na středních
VYSOKÁ ŠKOLA HOTELOVÁ V PRAZE 8, SPOL. S R. O.
 VYSOKÁ ŠKOLA HOTELOVÁ V PRAZE 8, SPOL. S R. O. Návrh konceptu konkurenceschopného hotelu v době ekonomické krize Diplomová práce 2013 Návrh konceptu konkurenceschopného hotelu v době ekonomické krize Diplomová
VYSOKÉ UČENÍ TECHNICKÉ V BRNĚ
 VYSKÉ UČENÍ TECHNICKÉ V BRNĚ BRN UNIVERSITY F TECHNLGY FAKULTA CHEMICKÁ ÚSTAV FYZIKÁLNÍ A SPTŘEBNÍ CHEMIE FACULTY F CHEMISTRY INSTITUTE F PHYSICAL AND APPLIED CHEMISTRY PREPARATIN F STUCTURED THIN LAYERS
Vliv metody vyšetřování tvaru brusného kotouče na výslednou přesnost obrobku
 Vliv metody vyšetřování tvaru brusného kotouče na výslednou přesnost obrobku Aneta Milsimerová Fakulta strojní, Západočeská univerzita Plzeň, 306 14 Plzeň. Česká republika. E-mail: anetam@kto.zcu.cz Hlavním
Název společnosti: VPK, s.r.o. Vypracováno kým: Ing. Michal Troščak Telefon: Datum:
 Pozice Počet Popis 1 ALPHA2 25-6 18 Výrobní č.: 9799321 AUTOADAPT function automatically finds the best setpoint and thus reduces the energy consumption and setup time. Insulating shells are supplied with
Czech Technical University in Prague DOCTORAL THESIS
 Czech Technical University in Prague Faculty of Nuclear Sciences and Physical Engineering DOCTORAL THESIS CERN-THESIS-2015-137 15/10/2015 Search for B! µ + µ Decays with the Full Run I Data of The ATLAS
MOŽNOSTI TVÁŘENÍ MONOKRYSTALŮ VYSOKOTAVITELNÝCH KOVŮ V OCHRANNÉM OBALU FORMING OF SINGLE CRYSTALS REFRACTORY METALS IN THE PROTECTIVE COVER
 MOŽNOSTI TVÁŘENÍ MONOKRYSTALŮ VYSOKOTAVITELNÝCH KOVŮ V OCHRANNÉM OBALU FORMING OF SINGLE CRYSTALS REFRACTORY METALS IN THE PROTECTIVE COVER Kamil Krybus a Jaromír Drápala b a OSRAM Bruntál, spol. s r.
B1 MORE THAN THE CITY
 B1 MORE THAN THE CITY INTRODUCTION ÚVOD B1 Budova B1 je součástí moderního kancelářského projektu CITY WEST a nově budované městské čtvrti Západní město, Praha 5 - Stodůlky. Tato lokalita kromě vynikající
Unit 3 Stereochemistry
 Unit 3 Stereochemistry Stereoisomers hirality (R) and (S) Nomenclature Depicting Asymmetric arbons Diastereomers Fischer Projections Stereochemical Relationships Optical Activity Resolution of Enantiomers
Střední průmyslová škola strojnická Olomouc, tř.17. listopadu 49
 Střední průmyslová škola strojnická Olomouc, tř.17. listopadu 49 Výukový materiál zpracovaný v rámci projektu Výuka moderně Registrační číslo projektu: CZ.1.07/1.5.00/34.0205 Šablona: III/2 Anglický jazyk
Caroline Glendinning Jenni Brooks Kate Gridley. Social Policy Research Unit University of York
 Caroline Glendinning Jenni Brooks Kate Gridley Social Policy Research Unit University of York Growing numbers of people with complex and severe disabilities Henwood and Hudson (2009) for CSCI: are the
UPM3 Hybrid Návod na ovládání Čerpadlo UPM3 Hybrid 2-5 Instruction Manual UPM3 Hybrid Circulation Pump 6-9
 www.regulus.cz UPM3 Hybrid Návod na ovládání Čerpadlo UPM3 Hybrid 2-5 Instruction Manual UPM3 Hybrid Circulation Pump 6-9 CZ EN UPM3 Hybrid 1. Úvod V továrním nastavení čerpadla UPM3 Hybrid je profil PWM
Výukový materiál zpracovaný v rámci operačního programu Vzdělávání pro konkurenceschopnost
 Výukový materiál zpracovaný v rámci operačního programu Vzdělávání pro konkurenceschopnost Registrační číslo: CZ.1.07/1. 5.00/34.0084 Šablona: II/2 Inovace a zkvalitnění výuky cizích jazyků na středních
Sborník vědeckých prací Vysoké školy báňské - Technické univerzity Ostrava číslo 1, rok 2006, ročník LII, řada strojní článek č.
 Sborník vědeckých prací Vysoké školy báňské - Technické univerzity Ostrava číslo 1, rok 2006, ročník LII, řada strojní článek č. 1521 Petr TOMČÍK *, Radim TROJAN **, Petr MOHYLA THE PULSED MAGNETIC TREATMENT
DUPLEXNÍ POVLAKOVÁNÍ PM NÁSTROJOVÉ OCELI LEGOVANÉ NIOBEM DUPLEX COATING OF THE NIOBIUM-ALLOYED PM TOOL STEEL
 DUPLEXNÍ POVLAKOVÁNÍ PM NÁSTROJOVÉ OCELI LEGOVANÉ NIOBEM DUPLEX COATING OF THE NIOBIUM-ALLOYED PM TOOL STEEL Pavel Novák Dalibor Vojtěch Jan Šerák Michal Novák Vítězslav Knotek Ústav kovových materiálů
Dynamic Development of Vocabulary Richness of Text. Miroslav Kubát & Radek Čech University of Ostrava Czech Republic
 Dynamic Development of Vocabulary Richness of Text Miroslav Kubát & Radek Čech University of Ostrava Czech Republic Aim To analyze a dynamic development of vocabulary richness from a methodological point
VY_32_INOVACE_06_Předpřítomný čas_03. Škola: Základní škola Slušovice, okres Zlín, příspěvková organizace
 VY_32_INOVACE_06_Předpřítomný čas_03 Autor: Růžena Krupičková Škola: Základní škola Slušovice, okres Zlín, příspěvková organizace Název projektu: Zkvalitnění ICT ve slušovské škole Číslo projektu: CZ.1.07/1.4.00/21.2400
STUDY EDITS FOR BETTER TRANSPORT IN THE CENTRE OF NÁCHOD
 CZECH TECHNICAL UNIVERSITY IN PRAGUE Faculty of transportation sciences Title of project STUDY EDITS FOR BETTER TRANSPORT IN THE CENTRE OF NÁCHOD 2006 Petr Kumpošt Basic information about town Náchod Náchod
TechoLED H A N D B O O K
 TechoLED HANDBOOK Světelné panely TechoLED Úvod TechoLED LED světelné zdroje jsou moderním a perspektivním zdrojem světla se širokými možnostmi použití. Umožňují plnohodnotnou náhradu žárovek, zářivkových
Vypracováno: Telefon:
 Počet Popis ALPHA2 25-8 8 Výrobní č.: 98649757 Pozn.: obr. výrobku se může lišit od skuteč. výrobku AUTOADAPT function automatically finds the best setpoint and thus reduces the energy consumption and
Stojan pro vrtačku plošných spojů
 Střední škola průmyslová a hotelová Uherské Hradiště Kollárova 617, Uherské Hradiště Stojan pro vrtačku plošných spojů Závěrečný projekt Autor práce: Koutný Radim Lukáš Martin Janoštík Václav Vedoucí projektu:
Energy Saving Fund City of Litoměřice. Riga 25 th September 2015
 Energy Saving Fund City of Litoměřice Riga 25 th September 2015 Overview Introduction - City of Litoměřice Main activities in the energy sector Support of solar system for citizens Reasons for ESF establishment
USING VIDEO IN PRE-SET AND IN-SET TEACHER TRAINING
 USING VIDEO IN PRE-SET AND IN-SET TEACHER TRAINING Eva Minaříková Institute for Research in School Education, Faculty of Education, Masaryk University Structure of the presentation What can we as teachers
SGM. Smart Grid Management THE FUTURE FOR ENERGY-EFFICIENT SMART GRIDS
 WHO ARE WE? a company specializing in software applications for smart energy grids management and innovation a multidisciplinary team of experienced professionals from practice and from Czech technical
CZ.1.07/1.5.00/34.0527
 Projekt: Příjemce: Digitální učební materiály ve škole, registrační číslo projektu CZ.1.07/1.5.00/34.0527 Střední zdravotnická škola a Vyšší odborná škola zdravotnická, Husova 3, 371 60 České Budějovice
PREPARING OF AL AND SI SURFACE LAYERS ON BEARING STEEL
 METAL 28 PŘÍPRAVA ALITOSILITOVANÝH POVRHOVÝH VRSTEV NA LOŽISKOVÉ OELI PREPARING OF AL AND SI SURFAE LAYERS ON BEARING STEEL Pavel Doležal, Ladislav Čelko, Aneta Němcová, Lenka Klakurková, mona Pospíšilová
MC Tlumiče (řízení pohybu) MC Damper
 MC Damper") MC Tlumiče (řízení pohybu) MC Damper Fitness a volný čas Leisure and Training equipment Strojírenství Machinery Automobilový průmysl Vehicle Industry MC Tlumiče (pro řízení pohybu) se používají jako bezpečnostní
MC Tlumiče (řízení pohybu) MC Damper Fitness a volný čas Leisure and Training equipment Strojírenství Machinery Automobilový průmysl Vehicle Industry MC Tlumiče (pro řízení pohybu) se používají jako bezpečnostní
DYNAMICS - Force effect in time and in space - Work and energy
 Název projektu: Automatizace výrobních procesů ve strojírenství a řemeslech Registrační číslo: CZ.1.07/1.1.30/01.0038 Příjemce: SPŠ strojnická a SOŠ profesora Švejcara Plzeň, Klatovská 109 Tento projekt
Název společnosti: VPK, s.r.o. Vypracováno kým: Ing. Michal Troščak Telefon: Datum:
 Pozice Počet Popis 1 SCALA2 3-45 A Datum: 2.7.217 Výrobní č.: 98562862 Grundfos SCALA2 is a fully integrated, self-priming, compact waterworks for pressure boosting in domestic applications. SCALA2 incorporates
Rapid tooling. Rapid tooling. Zpracoval: Přemysl Pokorný. Pracoviště: TUL- KVS
 Zpracoval: Přemysl Pokorný Pracoviště: TUL- KVS Tento materiál vznikl jako součást projektu In-TECH 2, který je spolufinancován Evropským sociálním fondem a státním rozpočtem ČR. In-TECH 2, označuje společný
Project Life-Cycle Data Management
 Project Life-Cycle Data Management 1 Contend UJV Introduction Problem definition Input condition Proposed solution Reference Conclusion 2 UJV introduction Research, design and engineering company 1000
CZ.1.07/1.5.00/
 Projekt: Příjemce: Digitální učební materiály ve škole, registrační číslo projektu CZ.1.07/1.5.00/34.0527 Střední zdravotnická škola a Vyšší odborná škola zdravotnická, Husova 3, 371 60 České Budějovice
where NANOSPIDERTM was born cxi.tul.cz
 cxi.tul.cz where NANOSPIDER TM was born o o Institute for Nanomaterials, Advanced Technologies and Innovation Institute for Nanomaterials, Advanced Technologies and Innovation Institute for Nanomaterials,
PAINTING SCHEMES CATALOGUE 2012
 Evektor-Aerotechnik a.s., Letecká č.p. 84, 686 04 Kunovice, Czech Republic Phone: +40 57 57 Fax: +40 57 57 90 E-mail: sales@evektor.cz Web site: www.evektoraircraft.com PAINTING SCHEMES CATALOGUE 0 Painting
LOGOMANUÁL / LOGOMANUAL
 LOGOMANUÁL / LOGOMANUAL OBSAH / CONTENTS 1 LOGOTYP 1.1 základní provedení logotypu s claimem 1.2 základní provedení logotypu bez claimu 1.3 zjednodušené provedení logotypu 1.4 jednobarevné a inverzní provedení
STLAČITELNOST. σ σ. během zatížení
 STLAČITELNOST Princip: Naneseme-li zatížení na zeminu, dojde k porušení rovnováhy a dochází ke stlačování zeminy (přemístňují se částice). Stlačení je ukončeno jakmile nastane rovnováha mezi působícím
UNIVERZITA PARDUBICE FAKULTA CHEMICKO-TECHNOLOGICKÁ DISERTAČNÍ PRÁCE
 UNIVERZITA PARDUBICE FAKULTA CHEMICKO-TECHNOLOGICKÁ DISERTAČNÍ PRÁCE 2009 Ing. David Kahoun UNIVERZITA PARDUBICE FAKULTA CHEMICKO-TECHNOLOGICKÁ ANALÝZA BIOLOGICKY AKTIVNÍCH LÁTEK V MEDOVINÁCH METODOU HPLC
Střední průmyslová škola strojnická Olomouc, tř.17. listopadu 49
 Střední průmyslová škola strojnická Olomouc, tř.17. listopadu 49 Výukový materiál zpracovaný v rámci projektu Výuka moderně Registrační číslo projektu: CZ.1.07/1.5.00/34.0205 Šablona: III/2 Anglický jazyk
Database systems. Normal forms
 Database systems Normal forms An example of a bad model SSN Surnam OfficeNo City Street No ZIP Region President_of_ Region 1001 Novák 238 Liteň Hlavní 10 26727 Středočeský Rath 1001 Novák 238 Bystřice
Moderní technologie dokončování velmi přesných děr vystržováním a její vliv na užitné vlastnosti výrobků
 Moderní technologie dokončování velmi přesných děr vystržováním a její vliv na užitné vlastnosti výrobků Stanislav Fiala 1, Ing. Karel Kouřil, Ph.D 1, Jan Řehoř 2. 1 HAM-FINAL s.r.o, Vlárská 22, 628 00
MĚŘENÍ ÚČINNOSTI FOTOKATALYTICKY AKTIVNÍCH LÁTEK MEASUREMENT OF EFFICIENCY OF PHOTOCATALYTIC ACTIVE SUBSTANCES
 MĚŘENÍ ÚČINNOSTI FOTOKATALYTICKY AKTIVNÍCH LÁTEK MEASUREMENT OF EFFICIENCY OF PHOTOCATALYTIC ACTIVE SUBSTANCES Ing. Miroslav Šenkeřík, Ing. Katarína Hovorková, CSc. Stavební výzkum, s.r.o., Nad Ovčírnou
Metoda CLIL. Metody oddělování složek směsí FILTRACE FILTRATION
 Metoda CLIL Anglický jazyk - chemie Metody oddělování složek směsí FILTRACE FILTRATION Metodický list PaedDr. Jitka Voráčová Tato práce vznikla jako výstup vzdělávacího programu: Projekt CLIL Obsahově
Fytomineral. Inovace Innovations. Energy News 04/2008
 Energy News 4 Inovace Innovations 1 Fytomineral Tímto Vám sdělujeme, že již byly vybrány a objednány nové lahve a uzávěry na produkt Fytomineral, které by měly předejít únikům tekutiny při přepravě. První
ENVIRONMENTÁLNÍ VHODNOST STAVEBNÍCH MATERIÁLŮ Z POHLEDU VNÍMANÉ KVALITY VZDUCHU POVRCHOVÉ ÚPRAVY. INGRID ŠENITKOVÁ a PETRA BEDNÁŘOVÁ.
 ENVIRONMENTÁLNÍ VHODNOST STAVEBNÍCH MATERIÁLŮ Z POHLEDU VNÍMANÉ KVALITY VZDUCHU POVRCHOVÉ ÚPRAVY INGRID ŠENITKOVÁ a PETRA BEDNÁŘOVÁ Vysoká škola technická a ekonomická v Českých Budějovicích, Okružní 517/1,
Fourth School Year PISTON MACHINES AND PISTON COMPRESSORS
 Fourth School Year PISTON MACHINES AND PISTON COMPRESSORS 1. Piston machines Piston machines are classified as machines working with volume changes. It means that the working medium is closed by a in a
Čtvrtý Pentagram The fourth Pentagram
 Energy News 4 1 Čtvrtý Pentagram The fourth Pentagram Na jaře příštího roku nabídneme našim zákazníkům již čtvrtý Pentagram a to Pentagram šamponů. K zavedení tohoto Pentagramu jsme se rozhodli na základě
VLIV METEOROLOGICKÝCH PODMÍNEK NA KONCENTRACE ŠKODLIVIN V OVZDUŠÍ V AGLOMERACI BRNO A JIHOMORAV- SKÉM KRAJI
 Mikulov 9. 11.9.28, ISBN 978-8-8669--1 VLIV METEOROLOGICKÝCH PODMÍNEK NA KONCENTRACE ŠKODLIVIN V OVZDUŠÍ V AGLOMERACI BRNO A JIHOMORAV- SKÉM KRAJI Robert Skeřil, Jana Šimková Český hydrometeorologický
Inovace bakalářského studijního oboru Aplikovaná chemie. Reg. č.: CZ.1.07/2.2.00/
 Inovace bakalářského studijního oboru Aplikovaná chemie Reg. č.: CZ.1.07/2.2.00/15.0247 Lecture vocabulary: State Equation Pressure Volume Temperature Quantity Unit Gas Value Mass Current Amount Substance
SUBSTRUCTURES underground structures
 SUBSTRUCTURES underground structures FUNCTION AND REQUIREMENTS Static function substructure transfers the load to the foundation soil: vertical loading from upper stucture horizontal reaction of upper
Foster Bohemia s.r.o. Laboratoř měření imisí Immission Measurement Laboratory. Mezi Rolemi 54/10, 158 00 Praha 5, Jinonice, Česká republika
 Foster Bohemia s.r.o. Laboratoř měření imisí Immission Measurement Laboratory Mezi Rolemi 54/1, 15 Praha 5, Jinonice, Česká republika 1 Identifikace metodou: Identification by the method: Objekt: Building:
20 ka / 1 s (dle typu cívky) přirozené
 přirozené") KATALOG CATALOGUE 051/03/2013 VÝKONOVÝ REAKTOR NN, NASTAVITELNÝ LOW VOLTAGE POWER REACTOR COIL, ADJUSTABLE pro napětí do 1000 V for voltages up to 1000V TYP LNN ISO 9001:2009 ISO 14001:2005 VŠEOBECNĚ Výkonový
KATALOG CATALOGUE 051/03/2013 VÝKONOVÝ REAKTOR NN, NASTAVITELNÝ LOW VOLTAGE POWER REACTOR COIL, ADJUSTABLE pro napětí do 1000 V for voltages up to 1000V TYP LNN ISO 9001:2009 ISO 14001:2005 VŠEOBECNĚ Výkonový