MORAVIAN GEOGRAPHICAL REPORTS VOLUME 15 NUMBER ISSN
|
|
|
- Simona Holubová
- před 4 lety
- Počet zobrazení:
Transkript


1 MORAVIAN GEOGRAPHICAL REPORTS VOLUME 15 NUMBER ISSN

 Fig.")

")
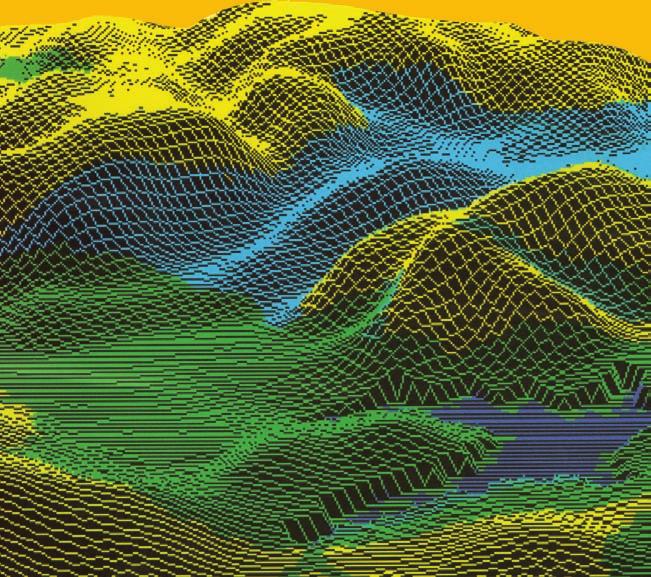
2 Fig. 6: Flood extension in the 3D model (shown in green colour) Fig.7: Flood of 2006 in Svitava River valley (Photo J. Kolejka) Illustrations related to the paper by J. Kolejka
3 Vol. 15, 3/2007 Moravian geographical Reports MORAVIAN GEOGRAPHICAL REPORTS EDITORIAL BOARD Bryn GREER-WOOTTEN, York University, Toronto Andrzej T. JANKOWSKI, Silesian University, Sosnowiec Petr KONEČNÝ, Institute of Geonics, Ostrava Ivan KUPČÍK, University of Munich Henrik LIGMAJER, Göteborg Sebastian LENTZ, Leibniz Institute for Regional Geography, Leipzig Petr MARTINEC, Institute of Geonics, Ostrava Oldřich MIKULÍK, Institute of Geonics, Brno Jozef MLÁDEK, Comenius University, Bratislava Jan MUNZAR, Institute of Geonics, Brno Metka ŠPES, University of Ljubljana Milan TRIZNA, Comenius University, Bratislava Pavel TRNKA, Mendel University, Brno Antonín VAISHAR, Institute of Geonics, Brno Miroslav VYSOUDIL, Palacký University, Olomouc Arnošt WAHLA, University of Ostrava Jana ZAPLETALOVÁ (editor-in chief), Institute of Geonics, Brno Georgette ZRINSCAK, University Sorbonne, Paris EDITORIAL STAFF Bohumil FRANTÁL, technical editor Zdeněk NOVOTNÝ, technical arrangement Martina Z. SVOBODOVÁ, linguistic editor PRICE 280 Kč (excluding VAT) per copy plus the postage 800 Kč (excluding VAT) per volume four numbers per year) plus the postage PUBLISHER Academy of Sciences of the Czech Republic Institute of Geonics, v. v. i., Branch Brno Drobného 28, CZ Brno Identifical number: MAILING ADDRESS MGR, Institute of Geonics ASCR, v. v. i. Drobného 28, Brno Czech Republic (fax) ( ) (home page) Articles: Mojmír HRÁDEK, Ireneusz MALIK dendrochronological records of the floodplain morphology transformation of desná river valley in the last 150 years, the hrubý jeseník mts. (czech republic)... 2 (Dendrochronologické záznamy morfologických transformací nivy Desné za posledních 150 let, Hrubý Jeseník (Česká republika)) Jaromír KOLEJKA PHYSICAL GEOGRAPHY AND CRISIS MANAGEMENT A TOPICAL CHALLENGE FOR APPLIED GEOGRAPHIC RESEARCH (Fyzická geografie a krizové řízení aktuální výzva pro aplikovaný geografický výzkum) Jan MUNZAR, Stanislav ONDRÁČEK, Tomáš ŘEHÁNEK THE FLOOD IN AUGUST 1880 ONE OF THE MOST SEVERE NATURAL DISASTERS OF THE 19 th CENTURY IN THE OSTRAVA REGION (CZECH REPUBLIC) Povodeň v srpnu 1880 jedna z největších přírodních katastrof 19. století na Ostravsku (Česká republika)) Darko OGRIN OLIVE GROWING IN SLOVENIAN ISTRIA AND CLIMATIC LIMITATIONS TO ITS DEVELOPMENT (Vliv klimatických podmínek na možnost rozšíření pěstování oliv ve slovinské Istrii) Milan TRIZNA RUNOFF MODELLING AND ITS SPATIAL VARIABILITY IN DEPENDENCE ON LAND USE...41 (Modelování odtoku a jeho prostorové variability v závislosti na využívání krajiny) Reports: Evžen QUITT REVIEW...59 (Recenze) Brno, September, 2007 PRINT Ing. Jan Kunčík, Úvoz 82, Brno INSTITUTE OF GEONICS 2007 ISSN
4 Moravian geographical Reports 3/2007, Vol. 15 DENDROCHRONOLOGICAL RECORDS OF THE FLOODPLAIN MORPHOLOGY TRANSFORMATION OF DESNá RIVER VALLEY IN THE LAST 150 YEARS, THE HRUBÝ JESENíK Mts. (CZECH REPUBLIC) Abstract Mojmír HRÁDEK, Ireneusz MALIK A system of palaeochannels, covered with trees, was discovered in the floodplain of the Desná River Valley. In the course of previous floods, new erosion channels were formed and gradually forested. Trees were wounded or even killed by transported boulders, gravel or ice floes. As a result, ring reductions and abrupt growth releases occur in tree trunks. Eight cores and two root samples from trees growing in the floodplain were taken to investigate the origin of the palaeochannels, as well as the floods and erosion events occurring in the same period. The results of these dendrochronological investigations were compared with historical and hydrological data. These analyses have shown that the palaeochannel system was probably formed during the great flood in The morphology of palaeochannels was changed during the floods of 1921, when a lot of trees were killed and abrupt growth releases occur within surviving tree trunks. Tree ring reductions occurred after the floods in 1938 and Dendrochronological results suggest that the river floodplain was transformed in the first half of the 1950s, as well as in the second half of the 1960s. River floodplain transformation took place most recently in 1997, when the flood eroded the channel banks and exposed some tree root systems. 1 Shrnutí Dendrochronologické záznamy morfologických transformací nivy Desné za posledních 150 let, Hrubý Jeseník (Česká republika) Při výzkumu erozních povodňových koryt v údolní nivě řeky Desné u Loučné byla v její břehové části nalezena podobná, zjevně však starší koryta porostlá listnatými dřevinami. Na kmenech některých stromů byla patrná poranění způsobená balvany, plovoucími kmeny nebo ledovými krami nesenými některou z minulých povodní. Tato poranění vedla k redukci letokruhů v poraněných částech kmenů nebo naopak k jejich náhlému nárůstu. Osm vzorků z jader kmenů a dva z kořenů stromů rostoucích v nivě bylo odebráno k určení stáří koryt a erozních událostí za povodní, které je vytvořily. Výsledky dendrochronologického výzkumu byly porovnávány s historickými a hydrologickými údaji. Výsledky analýz ukázaly, že systém starších paleokoryt vznikl pravděpodobně za velké povodně v roce Ke změnám morfologie těchto koryt došlo i za povodní v roce 1921, kdy mnoho stromů odumřelo a u přeživších došlo k prudkému nárůstu. K redukci letokruhů u stromů došlo po povodních v roce 1938 a Dendrochronologické výsledky naznačují, že k transformaci nivy Desné došlo v první polovině padesátých let minulého století a také ve druhé polovině 60. let. Naposledy byla niva transformována v roce 1997, kdy také došlo k erozi břehů paleokoryt a obnažení některých kořenů. Key words: floodplain morphology, palaeochannels, historical floods, tree ring reductions, abrupt growth release, exposed roots. Hrubý Jeseník Mts., Czech Republic. Introduction Studies of floodplain morphology transformation are often based on the comparison of topographic maps produced at different times or on the analyses of aerial photographs. Fluvial landforms are unfortunately very rarely depictured in maps because of their small size or hidden position within the riparian forests. This comparison of maps or aerial photographs concern much more likely changes in active channel arrangements 1 The research was funded from the project of GA ASCR A
5 Vol. 15, 3/2007 Moravian geographical Reports or distribution of gravel bars. In the traditional research, changes in floodplain morphology are usually recorded and mapped in detail after extreme floods and comparison with the situation before the floods is possible only in the case of older detailed mapping. Very helpful in researching floodplain aggradation are analyses of sediments, especially contents of the 137 Cs isotope and heavy metals (Macklin, Klimek, 1992; Ciszewski, Malik, 2004). One of relatively new methods of floodplain transformation dating is the tree ring analyses (Alestalo, 1971). There are dozens of anatomical features of tree trunks growing on the floodplains recording erosion and accumulation (Butler, 1987) - for example the dating of trees growing on the homogenous floodplain levels or in palaeochannels (Malik, 2005). New floodplain landforms are gradually overgrown by trees. Tree age indicates a minimum age of the forested floodplain forms thus allowing for an estimation of the forms age (Hupp, 1988; Malik, 2006). Another dendrochronological method of floodplain morphology transformation is based on tree ring reduction dating. During large floods, boulders, gravels and logs are transported due to erosion. These materials wound the tree trunks which produce reduced annual tree rings as a result of mechanical stress during several following years after the event (Schweingruber, 1996). Dating of tree ring reductions allows estimate the age of floodplain transformation events (Shroder, 1980). Sometimes after large erosion episodes a part of trees growing on the floodplain are dead. Trees surveyed after such an episode produce wide tree rings (abrupt growth release) as a result of less sun and nutrients competition (Schweingruber, 1996). Another dendrochronological method that may be used for the reconstruction of floodplain morphology transformation is the investigation of anatomical changes in exposed roots (Gärtner et al., 2005). During floods there are sometimes new channels occurring within the floodplain and often erosion occurs in the existing palaeochannels. As a result of these processes tree roots are often exposed. After the exposure the trees would produce smaller and numerous cells in the root rings than before the exposure. The number of tree rings with anatomical changes determine the age of erosion (Malik, Matyja, 2006) The most important advantage of dendrochronological method used in fluvial morphology investigation is the continual recording of valley bottom transformation reflecting the annual rhythm of tree ring production. Main limitation of dendrochronological method is the age of trees growing in Europe. Tree trunks are as a rule not older than 500 years but most often below 200 years. Therefore, the dendrogeomorphological reconstructions can cover up to years. The aim of the study consists in the use of tree ring analyses (trees dating, tree ring reductions dating, abrupt growth release dating, root exposure dating) in order to investigate the floodplain morphology transformation of Desná River Valley in the last 150 years. Study area: The Desná River (326.3 km 2, 43.6 km in length), is the left side tributary of the Morava River in the basin of Danube. The valley of Desná River is running in the north - south direction and is located in the Eastern Sudetes in Czechia, its upper section being situated in the southern part of the Hrubý Jeseník Mts. (heads at 1310 m a.s.l.) and the lower one in the Šumperk Basin (joins the Morava River at 275 m a.s.l.) which is surrounded by the Hanušovická vrchovina Upland which is in foothill position to the former (Fig. 1). The bedrock of the upland area consists mainly of metamorphic complexes of gneiss, mica schist, phyllite and quartzite intensely folded and faulted, partly as a result of Neogene orogenic events. The Šumperk Basin is filled with Quaternary alluvia. Steep mountain slopes are covered by coarse regolith produced in Pleistocene. Block fields are relatively common. In mountain section the valley bottom of the Desná R. is narrow with boulder bed channel and with average slope of 40 m km -1. In the basin reach the valley is getting gradually wider with the floodplain width ranging from 0.2 to 1.2 km. The Desná R. flows in an alluvial channel which is entrenched into generally fine-grained overbank flood deposits of low resistance and with an average slope >15. In the study reach at Loučná, the channel of Desná R. has a low sinusoity. Floods represent a very frequent phenomenon in the Desná R. catchment area being predisposed by natural conditions in the neighbouring upland. Main factor affecting the magnitude and frequency of floods is extreme precipitation or abrupt snow thaw in the mountain ranges. Mean annual precipitation on the highest range (Praděd 1491 m) amounts to 1,203 mm and much higher in extreme events. Most rainfall comes usually in June or July. Mean July precipitation on the Praděd Mt. is 185 mm but in July 1997 it was mm. Rainfall distribution is controlled by windward orographic effect and then it depend on the individual frontal situation and on the direction of air masses circulation. The highest amounts of rainfall are followed by very high values of runoff. From the end of the 16 th century, the Desná R. and its tributary have experienced almost 40 large floods. The most extreme floods occurred in the years 1880, 1897, 3
6 Moravian geographical Reports 3/2007, Vol. 15 Fig.1: Study area location 1903, 1921 and Peak discharge in July 1997 in Šumperk was 191 m 3.s -1 and the largest gauged flood discharge before 1997 was in May 1940 with Q = 105 m 3.s -1. The above mentioned historical floods left depositional and erosion traces of the overbank flow activity. Methods The first phase of palaeochannel study was 1:10,000 geomorphological mapping of the Desná River floodplain (Hrádek, Lacina, 2003). Next step was the selection of trees and roots for sampling. Trees C1, C2, C4 were sampled to establish date of the minimum age of the palaeochannels because they grow in the palaeochannel bottoms (Fig. 2; Fig. 6 see cover p. 4). Trees C5, C7, C8, C10, C11 date the widening of palaeochannels because they grow on the palaeochannel upper edge and were undercut during floods (Fig. 2). Trunks of trees in this position are leaned and than become erect again (Fig. 6 see cover p. 4). Roots C12, C13 were sampled to date palaechannel bank erosion. Every tree was sampled by 40 cm Pressler borer up to a height of 1.5 m. Trees C1, C2 and C4 were sampled from the south side, C5 from the east side and the remaining trees from the west side. Sampling directions were identical for trees leaning direction to better control ring reduction of stem. Ten cm pieces of roots were cut by handsaw. Cores taken from the trees were glued to planks and cut by knife to see better the wood anatomy. Tree rings were counted and tree ring reduction was established under the binocular microscope. For every tree ring width curves were prepared. Cross-sections of sampled roots were smoothed by 240 and 500 granulated sand paper to better see the wood anatomy. Tree rings with anatomic changes were counted under the binocular microscope. Dendrochronology results were put together into one graph and compared with flood events collected by Polách, Gába (1998) and Štekl et al. (2001) to find episode/episodes responsible for the transformation of the Desná River floodplain. Precision of dendrochronological dating Tree rings reductions may occur not only as a result of mechanical stress. Some of them are affected by climatic conditions, outbreaks and other factors (Schwiengruber, 1996). However, after mechanical stress the trees produce 4
, 3 banks of palaeochannel 0.7 2 m high, 4 dtto 0.3 0.7 m, 5 palaeochannel pools, 6 channel of the Desná R.")
7 Vol. 15, 3/2007 Moravian geographical Reports Fig. 2: The location scheme of sampled trees and roots in relation to the studied palaeochannel and the active channel of the Desná R. 1 floodplain, 2 lowered surface of the floodplain or erosion terrace (bank berm), 3 banks of palaeochannel m high, 4 dtto m, 5 palaeochannel pools, 6 channel of the Desná R., 7 palaeochannels under study, 8 location of sampled tree trunks and roots. several reduced tree rings while after non-mechanical stress they often produce a single reduced tree ring. It means that three maybe four series of tree ring reductions are probably affected by mechanical stress. The dating of trees may be inaccurate due to the possible presence of false, missing or wedging rings in sampled cores (Fritts, 1972). However, the relatively short ring sequences limited the risk of inaccurate dating and large errors. The time of tree ring reduction, abrupt growth release and root exposure (dendrochronological marks) as identified from the analysis of anatomic changes within their tree rings does not always coincide with the actual year of flood and erosion episodes. Tree rings are formed in temperate climates in the period from May to November (Zielski, Krąpiec, 2004). In the mid-mountain areas the growing season is reduced to 3-4 months. When floods and erosion episodes occur at this time, anatomic changes are visible in the area of a tree ring. If the floods and erosion episodes occurr during the first part of the year, before the growing season, the tree ring may be changed in the same year in which the episode occurred. If the floods and erosion episodes occurred in latter part of the year, after the growing season, the tree ring with anatomic changes would occur only in the following year. Thus, the dendrochronological marks may be recorded in tree rings one year after the flood or erosion episode. If a tree is wounded after the flood event, tree ring reductions occur one or two years after the floods, when the tree starts producing the callus tissue which gradually covers the scar (Schweingruber, 1996). Palaeochannel system morphology After the flood in July 1997, an anastomosing system of overbank channels and assemblage of other erosion and depositional landforms were found in the floodplain of Desná R. and mapped in detail (Fig. 3). Origin of the new flood channels is derived from river flowing in out-of-bank condition and from the operation of sediment-deficient water moving across the floodplain and supported by the rising overbank discharge (Baker, 1987). The new channels were classified as chutes or crewasse channels. Typical feature of the flood overbank channels was a rather wide (up to 15 m) and flat channel bed (Hrádek, Lacina, 2003). Depth of channels is determined by thickness of fine-grained overbank deposits which is up to 1.5 m. Flat bottom of the channels is built of flat lying fluvial gravels. Bottom of some new channels is in a step-like way separated into two height levels with higher level creating erosion steps. During the surveys older palaeochannels were found, too, but their placement onto the time scale was very difficult. While erosion channels from the time of the last flood spread over the whole floodplain surface and far out from the river because of water flow diversion due to road and railway embankment constructions (Hrádek, Lacina, 2003), the palaeochannels follow very closely active channel in the belt up to 50 m from the river and shorten the arch of the current meander. These channels were, similarly as the overbank channels of the last flood, classified either as chutes or old channels of the Desná River. The riverside belt which is currently covered by riparian forests is dissected at least by five palaeochannels 5
 1 floodplain of the Desná R.")
8 Moravian geographical Reports 3/2007, Vol. 15 Fig. 3: Geomorphological map of the Desná R. floodplain at Loučná and flood channels cross-sections (after Hrádek, Lacina, 2003) 1 floodplain of the Desná R. after flood 1997, 2 overbank flood channels, 3 distinct erosional channels (chute), 4 system of anastomosing channels, 5 active channel of Desná R., 6 railway embankment, 7 road embankment (a-b) older and deeper channel derived from the flood in 1897 with developed bank terrace (berm), (c-d) younger channel arisen during the flood in 1997 with a lower mid-channel bar bifurcating flood channel into two branches. The left has returned back to the present Desná River channel and the right has intricately anastomosed into a crewasse splay fan. at different stages of development. Some of them are very shallow buried in fine grained overbank deposits, other have a very expressive erosional form (Fig. 7 see cover p. 4). Palaeochannels have been preserved in the reaches of straight direction. For more detailed dendrochronological investigations, samples from trees growing within the largest palaeochannel were taken. Length of the preserved mentioned channel segment is ca. 100 m at a maximum width of 12 m and depth 2.2 m below the floodplain level. In the initial upper reach the palaeochannel splits into two more shallow branches which merge again after 35 m (Fig. 6 see cover p. 4). In its distal lower part the channel widens and deepens with a lower bank terrace (bench) developed on the right side (Fig. 3). Results and discussion Origin of the palaeochannel system Trees C1, C2 and C3 approximately started growing in about 1895, 1877 and 1897 (Fig. 4). It means that the palaeochannel system was formed in the second part of XIX century or earlier. The palaeochannel may originate during the big flood in 1897 because the sampled trees started growing very nearly to that date (Fig. 5). It is interesting that tree C2 is older than the flood in 1897, but grows on the edge of the right palaeochannel and was probably only undercut during the 1897 flood (Fig. 2). Great intensity of floods was observed at the end of the XIX. century, therefore it is really difficult to say when the palaeochannel system was formed. Probably more than one generation of palaeochannel system was formed on the study area, during the big floods new palaeochannels occurred and old ones were buried in sediments or transformed. Floods and morphology transformation events recorded in the existing palaeochannel system Groups of dendrochronological markers better indicate the Desná River Valley transformation than a single marker. The first group was recorded in (Figs. 4, 5). These markers occurred as results of flood on 1 June 1921 (Polách, Gába; 1998; Štekl, 2001) most of them representing abrupt 6
9 Vol. 15, 3/2007 Moravian geographical Reports growth release. It means, after the extraordinary flood in 1921 a lot of trees were killed by transported material, but a part of them survived. Thereby abrupt growth release occurred within the stem of the trees. It would be interesting to know why the tree rings reduction after wounding did not occurred in the survived trees. One less probable possibility is that within the sampled trees which survived wounds did not occur, the second possibility is that abrupt growth release levelled the tree ring reduction. The period from represents the second group of four dendrochronological markers (Figs. 4, 5). The markers are probably affected by two floods which occurred in the Hrubý Jeseník Mts. in 1938 and 1940 (Polách, Gába, 1998; Štekl, 2001). The third group of markers was recorded in All of them represent tree ring reductions (Figs. 4, 5). In means, that the trees are intensively wounded. Responsible for these wounding are probably floods which occurred in March 1947 and August Flood in 1947 was connected with ice float transport (Polách, Gába, 1998). The ice float is often transported on the top of water, wounding trees even during not so big floods. Fig. 4: Annual ring series from the sampled trees 7
10 Moravian geographical Reports 3/2007, Vol. 15 Fig. 5: The results of dendrochronological investigation and main precipitation and flood events occurred in the Hrubý Jeseník Mts. 8
11 Vol. 15, 3/2007 Moravian geographical Reports Next two groups of dendrochronological markers were recorded in and (Figs. 4, 5). It is difficult to say what flood episodes were most decisive for wounding trees in the period Great precipitation events occurred in Hrubý Jeseník Mts. in May 1971 and August 1972 (Štekl, 2001). During that time, three tree rings reductions occurred and one root was exposed. Periods with double dendrochronological markers occurred three times in , 1977 and 1997 (Figs. 4, 5). The markers were recorded as results of floods in November 1930, July 1977 and July 1997 (Polách, Gába, 1998; Štekl, 2001). Based on the dendrochronological study of extreme flood which took place in Central Europe in 1997, only a little was transformed in the studied reach of Desná R. floodplain with the mentioned palaeochannel. Only at one place lateral erosion was recorded at the end of the studied palaeochannel (tree C12). There are a lot of examples of mountain stream valley floors transformation affected by 1997 flood (Zieliński, 2002; Malik, 2006), some of them with the flat bottom were recorded in the Hrubý Jeseník Mts. (Hrádek, 2000; Hrádek, 2002; Klimek et al., 2003). Weak transformation of the riparian part of floodplain can be explained by the protective function of the high-grown riparian forest which impeded the erosion activity of flood thalweg. The forest was flooded but the flood strength and impact were weakened Main erosion and deposition activity of the overbank flow occurred in the floodplain part outside the forest. The outer transformed part of the floodplain is now overgrown with young broad-leaved forest (Hrádek, Lacina, 2003). Original meadows, pastures and fields were after the flood left to natural succession. However, the composition of this young forest is rather different from the riparian forest. Tree species composition of the young forest is dominated by alder (Alnus incana, Alnus glutinosa) and willow (Salix fragilis and Salix caprea and other), while the riparian forest is dominated by lime (Tilia platyphillos), elm (Ulmus glabra), maple (Acer pseudoplatanus) and alder. Interesting is the lack of marks recording the extraordinary flood which took place in Trees that were sampled were relatively young during that flood. Such young trees are very flexible and probably gravels transported flowed around not wounding them. Conclusions Floodplain of the Desná River valley was affected by more than 40 floods during the last 150 years. The floods have left behind several generations of palaeochannels of different age and different stage of geomorphic development. The form of channel cross-sections of 1997 and palaeochannel corroborate their similar flood erosion origin. Accurate dating method of floodplain morphology transformation is dendrochronology. Our investigations have shown the well-preserved palaeochannel system hidden now in the riparian forest that occurred in the second half of the 19 th century, most probably during the extraordinary flood of There is no doubt that the palaeochannel system functioned before the 1897 flood, maybe older palaeochannels were buried within sediments and new ones were formed after following floods. Nevertheless, the dendrochronological research demonstrated once again a great significance of the flood from July 1897 for the transformation of floodplains in Central European rivers. Other dendrochronological markers of floods were found within the trees growing on the Desná River Valley floodplain as an effect of 1921, 1938, 1947, 1948, 1971, 1972, 1977 floods. Abrupt growth release occurred as an effect of necrosis in some trees after the flood in It suggests that a great alluvium transfer occurred during this flood with a possible redeposition of boulders. Only the transported boulders could cause the tree necrosis. Tree ring reductions were not found in the stems after the extreme flood in 1997, but one of roots was exposed during the flood, which suggests a low intensity of bank erosion in the studied palaeochannel in the Desná River Valley reach. References: ALESTALO, J. (1971): Dendrochronological interpretation of geomorphic processes. Fennia Vol. 105, p BAKER, V.R. (1987): Flood erosion. In. Baker, V., Kochel, R., Patton P. (eds.): Flood geomorphology, Wiley, New York, p BUTLER, D.R. (1987): Teaching general principles and applications of dendrogeomorphology. Journal of Geological Education No. 35, p CISZEWSKI, D., MALIK, I. (2004): The use of heavy metal concentrations and dendrochronology in the reconstruction of sediment accumulation, Mała Panew River Valley, southern Poland. Geomorphology Vol. 58, p FRITTS, H.C. (1971): Dendroclimatology and dendroecology. Quaternary Research No.1, p GÄRTNER, H., SCHWEINGRUBER, F.H., DIKAU, R. (2001): Determination of erosion rates by analysing structural changes in the growth pattern of exposed roots. Dendrochronologia Vol. 19, No. 1, p
12 Moravian geographical Reports 3/2007, Vol. 15 HRÁDEK, M. (1999): Geomorphological aspects of the flood of July 1997 in the Morava and Oder basins in Moravia, Czech Republic. Studia Geomorphologica Carpatho-Balcanica, Vol. 33, p HRÁDEK, M. (2000): Geomorphological effects of the flood of the July 1997 in the North Moravia and Silesia (Czech Republic) (in Czech). Geografický časopis, Vol. 52, No. 4, p. 303, Bratislava. HRÁDEK, M. (2002): Metamorphosis of floodplains after the flood of July 1997 in the upper Morava River (in Czech). In.: Kirchner, K., Roštínský, P. (eds.): Geomorfologický sborník 1. PF MU a Česká asociace geomorfologů, p , Brno. HRÁDEK, M., LACINA, J. (2003): Destructional landforms arisen from extreme events in the Desná River valley and their vegetation. Moravian Geographical Reports, Vol. 11, No. 1, p HUPP, C.R. (1988): Plant ecological aspects of flood geomorphology and paleoflood history In: Baker, Kochel and Patton (eds.): Flood Geomorphology. Wiley, New York, p KLIMEK K., MALIK I., OWCZAREK P. ZYGMUNT E. (2003): Climatic and human impact on episodic alluviation in small mountain valleys. The Sudetes. Geographia Polonica, Vol. 76, p MACKLIN, M.G., KLIMEK, K. (1992): Dispersal, storage and transformation of metal contaminated alluvium in the upper Vistula basin, south-west Poland. Applied Geography No. 12, p MALIK, I. (2005): Rates of lateral channel migration along the Mała Panew River (southern Poland) based on dating riparian trees and Coarse Woody Debris. Dendrochronologia Vol. 23, p MALIK, I. (2006): Contribution to understanding the historical evolution of meandering rivers using dendrochronological methods: example of the Mała Panew River in southern Poland. Earth Surface Processes and Landforms Vol. 31, No. 10, p MALIK, I., MATYJA, M. (2006): Bank erosion history on a mountain stream determined by means of anatomical changes in exposed tree roots over the last 100 years (Bílá Opava River Czech Republic). Geomorphology (in press). POLÁCH, D., GÁBA, Z. (1998): Historie povodní na šumperském a jesenickém okrese. Severní Morava Vol..75, p SCHWEINGRUBER, F.H. (1996): Tree rings and environment. Dendroecology. Berne, Paul Haupt Verlag. 609 pp. ŠTEKL, J., BRÁZDIL, R., KAKOS, V., JEŽ, J., TOLASZ, R. (2001): Extrémní denní srážkové úhrny na území ČR v období a jejich synoptické příčiny. Praha, p SHRODER, J.F. Jr. (1980): Dendrogeomorphology: review and new techniques of tree-ring dating. Progress in Physical Geography Vol. 4, p ZIELIŃSKI, T. (2003): Catastrophic flood effects in alpine/foothill fluvial system (a case study from the Sudetes Mts, SW Poland). Geomorphology No. 54, p ZIELSKI, A. KRĄPIEC, M. (2004): Dendrochronologia. PWN, Warszawa, 328 pp. Authors addresses: RNDr. Mojmír HRÁDEK, CSc. Academy of Sciences of the Czech Republic Institute of Geonics, v.v.i., Branch Brno, Drobného 28, Brno, Czech Republic hradek@geonika.cz Dr. Ireneusz MALIK University of Silesia, Faculty of Earth Sciences Chair of Paleogeography and Paleoecology of Quarternary ul. Będzińska 60, Sosnowiec, Polska irekgeo@wp.pl Reviewer: Prof. Dr. hab. Leszek STARKEL 10
13 Vol. 15, 3/2007 Moravian geographical Reports PHYSICAL GEOGRAPHY AND CRISIS MANAGEMENT A TOPICAL CHALLENGE FOR APPLIED GEOGRAPHIC RESEARCH Jaromír KOLEJKA Abstract The various possible ways in which physical geography can contribute to more effective crisis management (CM) at the stages of prevention, planning of interventions, the operative solution of the event, short- and mid-term measures and long-term mitigation are discussed in this paper. Current research concerns the classification of harmful phenomena in the environment (as perceived by the participants), their origins, occurrences and spatio-temporal manifestations, including scale. Current methods of geographical data acquisition and knowledge production that support crisis management, as well as their utilization at individual levels of CM activities, are described. Stress is given to the importance of presenting those elements of physical geography that support CM, in such a way that they are comprehensible for the general public. Shrnutí Fyzická geografie a krizové řízení aktuální výzva pro aplikovaný geografický výzkum V příspěvku jsou uvedeny možnosti, kterými může fyzická geografie přispět k zefektivnění krizového řízení v etapě prevence, plánování zásahu, operativního řešení události, krátko- a střednědobých opatření a dlouhodobé mitigace. Rozpracována je klasifikace škodlivých jevů v prostředí z hlediska vnímání účastníky, původu, výskytu a časoprostorových projevů, vč. měřítka. Jsou popsány dosavadní způsoby geografické datové a poznatkové podpory krizového managementu (KM) a jejich využití na jednotlivých úrovních činnosti KM. Je zdůrazněna důležitost takové prezentace fyzickogeografické podpory KM, která je pochopitelná široké veřejnosti. Key words: risk classification, planning and management, physico-geographical data, knowledge and cartographic outputs, application of geoinformation technologies, photorealistic 3D models 1. Introduction The dramatic changes, which our planet experiences, concern both natural, economic and social spheres. Global climatic changes most probably stay in the background of more frequent occurrence of extreme phenomena in the atmosphere and hydrosphere with extensive consequences in other natural factors of the environmental elements. Increased sensitivity of the environment, individual compartments or regions of which are in the out-ofbalance state, puts a question what direction and how further existence of these objects will proceed. We should therefore be prepared to unexpected (unusual) reactions of the environment to the impulses. The economic and social spheres offer even much more wider spectrum of unexpected events. Technological development brings new products (chemical, mechanical, electronic, etc.) enabling deeper interventions into the environment, whose answer again becomes more fluid. Moreover, in the hands of certain groups of population these new effective products become instruments of crime. Though it is impossible to predict reliably when and where a certain event takes place, geography is able to assess the level of environmental sensitivity in advance - its primary (natural), secondary (economic user and/or functional) and tertiary (social interest) spatial structures. Only after commencement of the event we can apply the procedures outlining the future development of the phenomenon and human tasks with a high reliability. The man remains dependent existentially on the environment, because he is unable (mainly for economic reasons) to construct a safe artificial environment for all members of the society. Man is the biological being kept alive by the natural substances (air, water, minerals, soil, biomass) which can be produced industrially only within a very low range and at a high price. The man is 11
14 Moravian geographical Reports 3/2007, Vol. 15 also a social being which in the prevailing majority of cases needs to satisfy its needs in the circle of other people, their material and intellectual creations and usually in the direct contact. This is why isolation of individuals, whole communities or society from the environmental dangers is unreal, not to mention a chain of coincidences of purely subjective and individual character. A greater attention has therefore to be paid to preparation for possible occurrence of endangering phenomena and processes. 2. Background of Applied Physical Geography initiatives Taking in view the fact that the above-mentioned and related phenomena are in general of the spatial nature, the current geography has in principal the unlimited space for community involvement. Geographers at any level of their activities - starting by elementary school teachers, through the scientific and research institution and academic sphere staff and ending by officials of the whole state administrative and self-governing spectrum can take active part in wise coping with frequently dramatic phenomena in our current environment. Geography has the ability - unlike the majority of disciplines - to integrate knowledge of miscellaneous natural, social and technical disciplines, in general as well as in case of a specific territory, with the necessary related detached point of view. Our country is endangered (due to psychological nature many people consider each pressure to change of behaviour as endangerment) by natural, economic and social processes which have to be clarified, which we have to prepare for, react to them effectively in case of realization and correct them economically (do not confuse with reinstatement). Geography and therefore also the physical geography, must be able to enter into the procedures of crisis management reliably and in the relevant way; under the words above we shall understand the system of effective preparation and reaction to the dynamic processes endangering life and property. The modern crisis management (hereinafter referred to as CM) is the set of activities focused on the preparatory, operation and corrective phases of coping with the environmental processes endangering human lives and material goods. In conformity with technological development CM is based on the capable computer and information technology. For fulfillment of the CM tasks the modern physical geography has the following prerequisites available: 1. empiric knowledge basis (evaluated and assessed information about the course of the preceding phenomena and the contexts under which they appeared, run and what were their consequences), 2. geospatial data basis (reliable geographic database incorporating spatial differentiation of the interest territories from the point of the factors relevant for the set of monitored crisis phenomena of natural or anthropogenic origin), 3. geoinformation technologies for operative collection of spatial documents (and monitoring), data transmission and storage, their processing and visualization (GIS, GPS, remote sensing, computer cartography), 4. expert systems able to assess and document competently future states of the phenomenon, based on complex processing of the geological data and specialized knowledge, by applying capable processing and visualization technologies, 5. clarify the crisis situation in wide proportions (with respect to the primary, secondary and tertiary structure of the environment), offer operative and long-time measures as well as address the specialized and lay public by a suitable and understandable methods - by applying adequately differentiated written text, spoken work, graphic models (pictures, graphs, maps, 3D models, animations, etc.). Efficiency of the crisis management action is measured by rate and correctness of the chosen measures, applied for resolving a specific event. It is therefore necessary, and geography really has such capabilities, to develop, formulate, normalize and algorithmize relevant procedures for implementation into the computeraided decisions in CM leading to development of such products (manuals, solutions) and visualizations which will support users at individual CM levels, starting by the management and ending by individual citizens. The tasks can be realized only and exclusively based on the interdisciplinary integration of the data and knowledge of the natural, economic and social aspect of the environment, where geography can play the irreplaceable role. Different data and knowledge characterize groups of activities and CM (Fig. 1) functioning at the stages of: 1. preventive measures (risk assessment - specification of the places with the highest probability of occurrence of specific unfavorable phenomena), 2. planning of interventions (modeling of the unfavorable phenomenon in its different alternatives - classification of methods and places of intervention), 3. operative decision taking (realization of intervention - place, time and method, presentation of the tasks to the management and citizens), 4. follow-up short- and mid-term corrective actions (supported and substantiated selection, localization, scope and intensity of activities), 12
.")
15 Vol. 15, 3/2007 Moravian geographical Reports 5. long-term mitigation of emergency event consequences (similarly supported and substantiated selection, localization, scope and intensity of activities). Support of these CM stages by the digital data, professional knowledge, cartographic and visualization means and knowledge can be resolved by the physical geography and its individual partial disciplines. 3. Risk Identification and Assessment in the Landscape The natural phenomena, usually out of man control, manifested by huge destructive force, are named natural hazards (Bryant, 1991) or disasters (Alekseyev, 1988). Irrespective of the cause, they are in general characterized by miscellaneous duration which may range from some minutes (e.g. avalanche), through some hours (mudflow) and days (landslides) up to several months (e.g. floods). Irrespectively of their nature, occurrence and course of the disasters (in space and time) are subject to the following regularities: 1. each kind of hazard is typical for a certain territory and location, i.e. respects specific selection and values of natural as well as anthropogenic prerequisites, 2. each kind of hazard is repeated with a certain time and spatial regularity, i.e. in the sensitive territories we can assume occurrence of the disaster, but commencement depends on fulfillment of further conditions, 3. occurrence of each disaster can be predicted with higher or lower probability with respect to its dependence on the scope, term and intensity and geological and hydrometeorological processes, but high uncertainty of the prognosis of these background natural processes remains the problem. The level of unfavorable impact of the said harmful phenomenon on the man can be classified by three categories (Mazur, Ivanov, 2004): a) discomfort there is the risk or fear that the phenomenon can develop into the harmful one, b) danger the phenomenon can already really cause damage and endanger lives and property, c) disaster the phenomenon has reached extreme uncontrollable dimensions and causes damage. According to the landscape component, which the pulse for commencement of the natural disaster is based on, the following natural hazards can be differentiated: Fig. 1: Crisis management scheme working with the geographic data A) geological-geomorphologic - with predisposition based dominantly in the lithospheric component with relief (e.g. landslips, rockfall, avalanches, erosions, subsidence, earthquakes, volcanism, and others), 13
16 Moravian geographical Reports 3/2007, Vol. 15 B) meteorological-climatic-hydrologic - initiated by atmospheric and hydric parameters of the territory from the momentary or long-term horizon (e.g. floods, tornados, draught, gale-disaster areas, waterlogging, and others), C) biotic - caused by self-development of plant or animal species, association, chain or ecosystem, though abiotic catalysts can stay in the background (deformation of the established water energy balance) (e.g. insect calamities, excessively multiplied pests, change of biodiversity, dieback/loss, invasions, etc.). Though the pulse is usually based on any of the components above, where a certain feature of the said component or the process running in it can become catalyst of the disaster, the hazard usually reaches a complex nature with consequences in all landscape components. Finally, all other components always take part - in a certain way, though with weaker impact - in occurrence of the disaster, though certain parameters of them enable or prevent the disaster. Weakened defense against the disaster can become its prerequisite (catalyst) or at least its accelerator. More detailed breakdown of the natural risks named dangerous natural processes (DNP) is offered by I. I. Mazur and O. P. Ivanov (2004): 1. Cosmogenic NPP (heliomagnetic, material and impact, gravitational), 2. Cosmogenic climatic DNP (climatic cycles, longterm deviations of ocean level tectonic and glacial, short-term deviations of ocean level and the El Niño phenomenon, current climate warming, ozone hole problem), 3. Atmospheric DNP (meteogenic front transition, cyclones, trade winds, monsoons, windstorms, hurricanes, tornados, whirlwinds, long-time downpours, rainstorms, hailstorm, winter heavy snowfall, snowstorms, ice phenomena, black frost, summer heat, draught, dry hot winds), 4. Meteogenic biogenic DNP (natural fires forest, steppe, underground), 5. Hydrologic and hydrogeological DNP (on inland waters floods, ice phenomena ice congestions, underground ice, thermokarst, free continuous ice cover, wind phenomena water drive by wind, water entrainment by wind, tsunami extreme breaking or tidal wave), 6. Geological DNP (endogenic: tectonic - epeirogenetic, volcanic, seismic phenomena, geophysical geopathogenic, radiation, geochemical aureoles, exogenic: weathering, slope landslide, rockfall, slippage, avalanches, large-area water erosion, creep, solifluction, deflation, subsistence, linear water erosion, abrasion, wind erosion), 7. Infectious diseases of people (individual cases of infections, group cases, epidemic bursts of infectious diseases, epidemics, pandemics, infectious diseases of unestablished origin), 8. Infectious diseases of animals (individual cases of infections, enzootics, epizootics, panzootics, infectious diseases of unestablished origin), 9. Contagions of agricultural cultures by diseases and pests (progressive epiphytozootics, panphytozootics, contagions of unestablished origin, mass pest spreading). From the geometrical point of manifestation the risks can obtain (depending on differentiation and scale of representation): a) point character (e.g. impacts), b) linear character (e.g. ravines, landslides, avalanches), c) large-area character (e.g. earthquake, volcanism, floods), d) spatial character (e.g. magnetic storms, atmospheric phenomena). Graded probability of occurrence of a certain kind of hazard in a specific locality is named the risk level or risk of the phenomenon in question. If the risk level equals to 1 (or 100%), we are speaking about hazard realization, i.e. the realized risk equals to hazard. Whilst occurrence of certain natural risks can be excluded in a specific locality, anthropogenic harmful processes can occur practically at any time and anywhere. Despite a certain territorial link of natural risks (selected anthropogenic risks as well within a very limited scope) in the environment, their occurrence is co-affected by the complete set of landscape components. And, vice versa, each landscape component is affected by the risk, though within a different degree and with different consequences. The natural and anthropogenous risks are thus linked with different kinds of environment (geosystems) within the graded degree and different geosystem types are endangered by them within the graded degree. The level of endangerment is reflected by the risk of their commencement. 4. General Methodological Starting Points of Risk Evaluation in the Territory Risk evaluation is represented for instance by the negative evaluation of the landscape and/or its components or territorial segments - geosystems. Risk evaluation is, all other cases of evaluation alike, always purely purposeful and specific. It means that the objective/target and/or purpose of evaluation, criteria of evaluation, scale, method of combining of partial evaluations into the uniform result (landscape assessment is always 14
17 Vol. 15, 3/2007 Moravian geographical Reports multicriterial), form of interpretation and presentation of results are preset. Assessment of the landscape in order to obtain the overview of its spatial differentiation, depending on the level of the monitored risk, can be based on: 1. knowledge of the human activity and assessment of its danger for different geosystem types or their individuals, or on, 2. definition of the process harmful for the landscape, irrespective of what human activity accelerates it to the harmful form and intensity. Whilst mainly the EIA (environmental impact assessment) methodology is concerned with the cases of negative consequences of human impact on the landscape pursuant to the relevant act, through the authorized specialists, adequate attention is not paid to assessment of landscape sensitivity to harmful processes. Absence of the social demand for coverage (large territorial units) studies is most probably the reason. Situation in this respect has been changed partially. In particular after the catastrophic floods in 1997, 1998, 2002 and 2006 a certain interest for landscape assessment from the point of differentiated risk rate and sensitivity to occurrence of floods is evident, namely in the form of SEA (Strategic Environmental Assessment) studies, assigned to the region. In connection with the need to assess state of the environment with respect to provision of health and life of the man and material values, the term ecologicgeographic situation has been introduced. The former terms - ecological situation, ecologic-economic situation, ecologic-crisis situation, geosituation for designation of a certain endangering result of integration of a number of natural and socio-economic factors - are its synonyms. Under the ecologic-geographic situation we shall understand such time-spatial constellation of mutually linked natural, economic, social and political conditions conditioning change of the environment, which induces a specific state in production of the human s life and which impacts the level of development and level of satisfaction of the needs of the society (Shestyakov, 1992). For the needs of assessment of the landscape level from the point of the crisis management we can differentiate more categories of ecologic-geographic (geoecological) situations (modified): 1. Satisfactory (favourable conditions for economic development and functioning of the social system do exist). 2. Conflict (intensive economic development, sociopolitical situation and degree of landscape conversion in the context with the developing natural process leads to the feeling of endangerment and necessity of solution of the system, for the time being without the crisis manifestations). 3. Crisis (symptoms of impairment of the existing economic, social and political life and functioning of the territory and/or development stagnation and other limitations become evident). 4. Critical (impairment of the quality of life, safety of persons and property takes place, economy limits activity, occurrence of unfavourable phenomena in the landscape, economy, society and policy is imminent). 5. Catastrophic (controllable economic and social life in the landscape is destructed, the population and property starts to migrate, the natural disaster or the state of endangerment of the highest degree is announced). Even other negative assessments, e.g. risk of occurrence of landslides, soil erosion, rockfall, draught, waterlogging, occurrence of epidemics and/or consequences of global climatic changes, etc., would certainly contribute to optimization and ecologization of landscape management. Such assessments can optimally be referred to individual geosystems in the landscape as the targets or scenes or realization of a certain risk and not only to the incomplete set and/or selection of their features. The spatial range plays an important role in evaluation, modeling and overcoming the risks, which the necessary scale of solution and geo-visualization corresponds to. For comparison we can present an example of the quantified terminology used in hydrologic risk modeling (Dooge in Blöschl, Sivapalan, 1995), modified here for the needs of the crisis management: spatial scale (dimension): local n.10 1 m 2 hillslope n.10 4 m 2 catchment n.10 1 km 2 regional n.10 3 km 2 Time scale: event seasonal long-term 1 day 1 year 100 years Practical realization of assessment of the landscape from the point of pre-determined risk cases includes: A. Observing natural structure of the landscape and its susceptibility to commencement, acceleration or in general to the course of the natural disaster. Though risk assessment concerns the landscape units as complex wholes, from the practical point of view it runs through assessment of its individual parameters (components) from the point of susceptibility to the risk in question (Bastian, Schreiber, eds., 1994). B. Considering the current functional structure of the landscape and human activities operating in the 15
18 Moravian geographical Reports 3/2007, Vol. 15 territory from the point of their contribution to the course of the natural disaster. C. Guaranteeing representativeness of selection of the evaluative criteria for assessment of the relation of the natural landscape structure and the monitored natural disaster, realization of partial and integral evaluation with the objective to determine the overall risk level of the disaster in question, differentiated place by place. D. Comparing the competently assessed risk level with real tracks of the monitored real disaster in the said territory for possible verification of the evaluative hypothesis and its results. E. Cartographic (spatially localized) presenting of the established natural disaster with the graded intensity degree in the natural territorial units for clear understanding of synergic links between the environment and the process of disaster. F. Designing and spatial projecting of the optimization actions leading to reduction or even to limitation of the risk of natural disaster and its incorporation into the project of functional landscape arrangement. Evaluation of susceptibility of the territory to the natural risks has been carried out in geography for a long time already, but application of the progressive computer engineering and GIS technology, making the multicriterial and multidisciplinary evaluation more reliable and realizable in the real time, as usually requested by the crisis management, was an extraordinary pulse for improvement of all procedures. The analytical (component) and integrated data about the territory serve in GIS for support of the crisis management oriented on simple as well as more complex evaluative operations with the objective to assess the environmental risk of the territories in question. It is most frequently the purposeful interpretation if miscellaneous data for most different evaluation of the territory (Webster, Siong, Wislocki, 1989; Estes, McGwire, Fletcher, Foresman, 1987; Sauchyn, 1989; Haber, Schaller, 1988; Caron, Merchant, 1986; Lamont, 1991; McDonald, Smith, 1991; Shasko, Keller, 1991; Taylor, Ullman, 1993 et al.). The cartographic outputs reflect premises and territories of different susceptibility to the negative phenomena, e.g. the risk of landslips, soil erosion, soil and water pollution from different sources. This way treated geodata serves directly the decision making processes in the territorial environmental and crisis management. GIS technologies focused purposefully on integration of more phenomena in the environment and on their time-spatial modeling have been developed intensively recently. Development of certain quick processes and emergencies, most frequently fires (fire management), floods, spreading of forest stand diseases, etc. (Knutson, Douhan, 1991; Wertz, 1991; Van Wagtendonk, 1991; Kessell, Beck, 1991; McRae, Cleaves, 1991; Polzer et al., 1991; PAMAP, 1993) and/or invasion or decline of the animals from certain areas in case of environmental pollution (Mueller, 1991). The simulation models of the processes serve as a certain form is scientifically based prognosis of the phenomena in question. The physical geographical data are chosen specially for purposes of modeling and are often verified randomly during processing by comparing results of individual partial stages of modeling with empiric values. Extreme specialization and single-purpose nature, practically excluding use of the data and method for other purposes, is a considerable disadvantage of the GIS focused on modeling and prediction of partial natural or man accelerated, called or directly caused phenomena. According to the approach to problem solution and the level of the final user qualification we can differentiate in principle four levels of the geo-information provision of the evaluative and search tasks of any kind: 1. Multilayer basic information provision - information models of this kind are represented by GIS, containing digital maps of those environmental factors which were considered by their author, DB GIS, relevant for the resolved issues. We are usually speaking about the systematized sequence of maps which should introduce the system user (incl. the accompanying text) to the said problem, familiarize the user with the territory, its selected features, create the spatial idea about those parameters or objects in the territory, which are important (as considered by the author) for purposeful evaluation or decision taking in specific situations. Databases of administrative units in the Czech Republic (CR) are just of this kind. The digital map set with expert instructions and guidelines is usually modified so that its can be handled by the user without any qualification in the field of computer engineering, but with complex experience in the said field of problems. The burden of responsibility for selection of the parameters, their evaluation and for decision taking is on the user s side; the latter must evaluate the system of presented information by itself and integrate it into the basic documents for alternative offer of evaluation or variant risk solution. Such systems were constructed for miscellaneous purposes, starting by protection of the population in case of the civil and war nuclear catastrophe (Roger, Stella, 1990; Heywood, Cornelius, 1993), endangerment of the population by the toxic disaster (production, storage or transport of toxic substances) on the example of urbanized studies (McMaster, 1988; Harris et al., 1991) and ending by endangerment of the population by industrial emissions (US EPA studies for the region of the Chattanooga city, Tennessee, or for Teplice city environs in Podkrušnohoří (CR) in the IIASA study - Fedra, 1995). In this form 16
. Fig. 2: Selected relevant map layer important for crisis management ( Source: ČGS) 2.")

19 Vol. 15, 3/2007 Moravian geographical Reports the geo-information CM provision exists in CR at the regional level and is based on a number of thematic data layers, from which only the crisis management selects the relevant layers for the territory in question and uses them (Fig. 2). Fig. 2: Selected relevant map layer important for crisis management ( Source: ČGS) 2. Multilayer evaluative information provision - already contains not only the basic documents prepared by the expert and the instructions how to handle them, but also their purposefully interpreted versions. The purposeful specialized GIS of this kind contain the basic information about the territory in special digital files, purposeful derivatives of which are oriented on a specific thematic evaluation of areas, structures, phenomena, factors against the monitored risk (hazard) in the territory as well as possible proposals of miscellaneous measures and actions how to reduce the risks. User is usually non-expert both in the field of the computer engineering and in the said field of problems. The user has rather the executive (administrative) control and realization role in the field of corrective actions. Systems of this kind present logic series of evaluative digital maps of the most different degrees of suitability and/or endangerment of the territory by accidents of natural and anthropogenic origin, e.g. lightning, landslides, leaks of hazardous or toxic substances (oil leaks on the land and offshore), etc. (Jensen et al., 1990; Hession, Shankholtz, 1988; Lamont, 1991; Pearson, Wadge, Wislocki, 1991 etc.) Fig Appraising static models - are based on the knowledge of relations between the conditions, causes, and consequences of the assessed crisis phenomena in the environment of both natural ands anthropic origin. Systems of this kind already contain the explicitly Fig. 3: Evaluated level from the point of a specific risk 17
 and the knowledge basis (the instructions how to handle the data, what results could be awaited and how to assess them).")
20 Moravian geographical Reports 3/2007, Vol. 15 separated data basis (set of information about the territory) and the knowledge basis (the instructions how to handle the data, what results could be awaited and how to assess them). The data operations are mostly based on the questionnaire approach, where the system asks, what should be the next step, whilst the user can select from a number of variants that variant which corresponds best to the situation. Content of operations itself (analysis) usually consists in creation of combinations of thematically differing data with the purpose to search either specific combinations (limit values, above-average or substandard combinations of factor concurrence) or all really occurring combinations which may be assessed statistically, in particular from the point of knowledge or connections between the phenomena (e.g. under what conditions a certain phenomenon will reach the intensity in question and the territorial scope of action). This way it is possible to differentiate the territory by the values of endangerment by a certain phenomenon or process (e.g. avalanches Rybár, 2001) or to reflect consequences of a disaster in a certain region territorially (Davis, Whigham, Grant, 1988; Sauchyn, 1989, etc.). 4. Descriptive and predicative dynamic models - are based on miscellaneous geo-statistical operations, utilizing functional and probability relations between relevant variables and often incorporate an equivalent fourth dimension into the problem - the time. The degree of development of these systems differs materially. The most progressive of them introduce the artificial intelligence which carries out one part of the decisionmaking processes - how to proceed - instead of the user. But the user must check activities of the system. The software, based on the expert knowledge, is usually represented by the formalized empiric experience, broken down into elementary relations, functions and instructions accepting a wide spectrum of relevant variables. If time is one of the variables, then each step of modeling of the phenomenon in question (accident, disaster, etc.) corresponds at least to plus one time unit (per 1 second, minute, hour, per 1 day, per 1 year, etc.). From the other aspect it is possible to model a certain resultant situation and to establish, when it takes place. The time sequence of the modeled (static) states can be animated, thus simulating the phenomenon dynamics visually. User of the system can be - in the extreme case - even layman with only rough knowledge of the computer art. But from the experience it follows clearly that results of modeling must be checked by the instructed user and by the experiences computer operator. This way development of relatively very dynamic phenomena is predicted most frequently, e.g. fires (Estes, McGwire, Fletcher, Foresman, 1987; Kessel, Beck, 1991; Wertz, 1991 et al.), floods (Valenta, Valentová, 1999; Knapp, 2001), movement of pollutants in the environment - air (models of atmospheric dispersion), in water (hydrologic models of pollutant outflow and dispersion), in geological environment (geochemical models) with short- and longterm prognosis (ITC, 1993), floods, etc. (Burns, et al., 1991; Fedra, 1995; Flügel, 1995; Říha et al., Fig. 4). Irrespective of the level of complexity of the GIS-based geo-information provision, preference is given to such Fig. 4: Modeled flood level compared with different flow rates 18
21 Vol. 15, 3/2007 Moravian geographical Reports differentiating capability which corresponds to the maps with the scale 1:10,000 and/or 1:25,000, smaller scale only exceptionally (Krysanova, Müller-Wohlfeil, Becker, 1996). This concerns both granting the information and assessment and modeling of landscape states according to the preset scenarios, natural and anthropogenic risk phenomena in the land and water environment. 5. Consideration of Risks in Crisis Management Planning and Territory Forecasting The territorial planning practice tries to incorporate results of risk assessment into the planning documentation. Another documentation will concern the common territorial planning practice, another documentation - planning within the scope of CM bodies at individual levels. The differing time horizon of utilization of the documents, depending on the crisis management state, is striking. Whilst the field of territorial and/or landscape planning utilizes effectively the risk assessment documentation for prevention and long-time moderation of possible consequences, the crisis management utilizes the documents for planning of interventions, operative solution of events and for realization of short- and mid-term actions. Awareness and organization of the wide public at individual crisis management stages is a quite different field of utilization of the documents. It is known that under the conditions of the Czech Republic we can speak about specialization of the territorial planning practice broken down into two qualitatively materially different kinds of territories (Mezera, et al., 1979; Jůva, Zachar, et al., 1981). 1. planning in the urbanized landscape (briefly in the town/urban residential areas), using methodological procedures and instruments of urban planning, and 2. planning in the rural landscape (briefly in the rural areas), using the procedures and mechanisms of territorial planning and landscape planning. Planning in the territory represents the set of procedures of scientifically well-reasoned and by practical experience verified rational guiding of the human activities, while observing the principles of proportional development of natural and anthropogenic factors acting mutually in time and space (according to V. Vaníček, in Nepomucký, Salašová, 1996). As the human activity, planning in the landscape is generally focused on further adaptation of the landscape/environment to the needs of living, work and rest of the man. Well being of the man in the landscape is the principle monitored more and more closely. Under the well being we can include the feeling of personal safety, protection of property and finally protection of live and non-live nature and landscape segments within a certain degree, because even in this case it is the satisfaction to the subconscious selfpreservation feeling of the well-informed man, this way trying to take care of its future. There is a wide spectrum of opinions, what are the ways how to reach this objective - starting by letting development on the free market principles through different governmental and social interventions and ending by the state paternalism (van Elzakker, 1994). Whilst planning in CM concerns efficiency of predominantly short-time rescue actions, perspective target of planning in the territory covers such functional delimitation of areas which would satisfy optimally (compromise as a minimum) requirements of all participating parties and correspond to the highest level of knowledge It is evident that in any case any plan and mainly its realization in the territory represents a multilateral compromise satisfying partially the maximum of aspects and interests with preserved basic function of the territory recommended by the project. Planning in CM can therefore be considered the form of socio-environmental planning. For the time, being planning in CM suffers from understandable simplified technocratic-bureaucratic approach, but the weakened role of natural science in all CM procedures is conditioned by its limited and also understandable caution in formulation of the applicable knowledge. All proposals contained in the planning documentation must respect a number of requirements (Bartkowski, 1979, Evans, 2004): 1. environmental safety (content), planned measure/ action, structure, functional area, etc. may not cause endangerment, on the contrary, they must reduce the risk level established by the preceding assessment, 2. functional efficiency (position), result of planning is progressively multifunctional, i.e. its degree of universality must go up with the rising time horizon (short-time, mainly operative actions, may be simple by its objective - rescue, protection), which is the necessary prerequisite of economic efficiency of the action, 3. aesthetic acceptability (form), long-time actions must consider requirements for appearance to the maximum possible degree. There is no doubt that even in this case fulfillment of the requirements above is always of the compromise nature. The activities, which realization of the well being is based on, are linked with the procedure and results of planning. They have their output in the process (according to Bastion, Schreiber, 1994) of technological mastering of the obtained knowledge and proposals and in designing their projection in the realization actions. 19
 or risk management (Marsh, 1998) represents the technology aimed at incorporation of the huge")
22 Moravian geographical Reports 3/2007, Vol. 15 The landscape planning and/or landscape designing and landscape engineering (see Vaníček, 1979) or risk management (Marsh, 1998) represents the technology aimed at incorporation of the huge complex of knowledge into the working scenario in the real territory. From the practical point of view the following distinguishing levels and/or the spatial dimension of the territorial decision taking, planning, plans or prognoses in CM are applicable suitably: 1. Local (cadastral) level - corresponds to the topic or microchoric dimension of landscape differentiation, but applied within the administrative boundary of one selected or several mutually connate cadastral territories (e.g. due to direct connection and development of neighbouring settlements). Objective of the local (topic) plan is to establish, localize precisely and assess the local risks and to eliminate the negative components and processes afterwards. The local CM plan can be elaborated for the territory of the area of ca n.10 0.km 2. In this differentiation the physical geography grants information about the primary landscape structure or about location of topical natural landscape components, homogenous from the point of their features (geological structures, terrain shape, climate, humidity conditions, soils and biotas). These units can be assessed through evaluation of features of individual components from the point of possible occurrence of individual harmful phenomena of natural origin (flood, draught, landslide, rockfall, windstorm, erosion, vegetable and animal diseases, etc.) or from the point of their relation to possible harmful processes of anthropogenic origin (consequences of disasters on solid and mobile structures). Evaluation of availability (accessibility) of the territory for the rescue engineering and vehicles is the integral part of such physico-geographical output into CM. Determination and evaluation of valuable natural structures, requesting a certain respect by the CM management, is another aspect of entry into CM. The crisis team headed by the mayor/town clerk is active at this CM level. The municipality in question is then liable (because it is in its intrinsic interests) to obtain the documents about susceptibility of individual areas in the controlled territory and respect the risk zones during everyday activities and in the long-term horizon to prevent growth of the risk level and increase of endangerment of the existing values. The mayor is also liable for awareness of the population during the period of endangerment. Here the physical geography can find its firm place by miscellaneous predicative models of the already running (commenced) risk process with due visualization of the situation in individual time horizons (Fig. 5). Fig. 5: Escape routes in case of flood of different magnitude 2. Regional (county, landscape) level - coincides more or less with the traditional choric dimension of landscape differentiation; it is applied for a wider territory or for a group of settlements or land registers, creating a characteristic cutout of the landscape territory with the area of ca n.10 2.km 2. (a certain analogy with higher territorial units or with authorized municipalities in CR). Both the rural area, i.e. open landscape, and the town residential areas, i.e. urbanized zones, represent the subject of our attention. From the viewpoint of the crisis management we assess natural structures, areas and processes in the territory with the objective of overall assessment of susceptibility of the territory to the natural crisis phenomena. The structures and areas requesting special consideration during CM operations at any stage are subject to identification and miscellaneous evaluation and assessment both in the town residential areas and out of them. The proposals are formulated in the form of the so called 20
23 Vol. 15, 3/2007 Moravian geographical Reports CM concepts and scenarios for the standardized crisis phenomena (ca 70 types of crisis phenomena are distinguished in CR). They concern mainly organization of the actions at any CM stage, should the scope of the event exceed the local level and activities of the crisis team of the municipality with extended competence have to be activated. The physical geography can find its firm place here by the documents and knowledge applicable in evaluation of the territory from the point of further development of the event (phenomenon spreading, endangerment of important areas and structures, limitation of development of the phenomenon, etc.). 3. Provincial, district (sub-national) level - represents application of the general principles of the crisis management in higher territorial units with the area of ca n km 2 (CR districts, NUTS III and NUTS II regions). At this level CM planning concerns determination and realization of the basic operations of coordination of the measures requesting high resources into the operative actions and into the overall rehabilitation of the territory, and/or determination of the concept of (poly)functional orientation of large landscape units (from the viewpoint of sustainable development) and principles of protection of the population and property in them. Specification and determination of different categories of problematic and developing territories, requesting specific approach both from the viewpoint of investment activities of the business entities, interventions of national or multinational institutions, and from the viewpoint of their role in provision of sustainable and continues development within the framework of higher (national, union, continental) structures can become the very objective. Crisis teams of the districts face here the events requesting mobilization of the means and funds under their competence. We are usually speaking about the disasters exceeding the framework of individual regions (floods, radioactive contamination, large gale-disaster areas, infections, etc.). At this level the physical geography can - in cooperation with the social and economic geography and other disciplines - activate the prediction models working on network or probability principles and estimate further territorial development of the events. 4. General and/or national level of CM activities - represents the basic coordination apparatus distributing the intervention to mitigation means into the affected regions of the country, in the optimum situation this level should cover all CM stages, but here with emphasis on the educational, technical, security, financial, material supply and information aspects. The physical geography can contribute here by the regionalization schemes of the state territory by individual risks, risk complexes and the overall risk rate or development limits. In this way it can affect the state intervention policy both from the viewpoint of the investment incentives, guarantees, program of subsidies, level of education and readiness of the population (Evans, 2004). In case of the already running even it can also outline possibilities of interaction of the event in question with other possible types of problems. Though there is the real idea that the crisis situations request cooperation of specialists (and officials) with a wide spectrum of competences (Thompson, Sorvig, 2000), the current development CM stage at the top level still relies more (except the floods) on the administrative and command system of solution of the crisis events than on the hybrid administrative and scientific approach. Rising exceptions from this rule already confirm the growing a role of natural sciences in the CM field. 6. Visualization of crisis management materials The user-addressed visualization of individual CM documents is one of the most important operations of the crisis planning in the territory, which usually stays in the background of the applied operating methods and procedures of elaboration of the post-event scenarios of the future landscape state. From the geographical point of view we are speaking about the documentation having explicit spatial and/or territorial aspect, i.e. about the cartographic documentation in the widest sense. It is assumed that the crisis teams have not only the basic cartographic and geo-information level of education, but this is not the case of CM at the local level and normal citizens. The specialized physical geography can offer the suitably interpreted specialized knowledge to the normal citizen so that the latter can understand both its content and its importance. Though the physical geography is still the normal subject of elementary schools and the majority of high schools, we can have the substantiated doubt that the teaching brings - besides memorizing the facts (by the way, necessary for creation of the standard level of education of each individual) - adequate practical habits necessary for the optimum behaviour in the landscape under normal or extraordinary situations. Cooperation of the school geography with the renewed civil defence can become a suitable solution. For the time being it is necessary to rely on the available possibilities of distribution of the geographic knowledge, comprehensible for the normal citizen. In this respect a great possibilities are offered by the progressive geoinformation technologies (geographic information systems, remote sensing, computer cartography and global navigation). The crisis management can be made much more effective at any stage, both from the point of the normal citizen and the participant of the crisis event, namely by integrated application and even operative implementation of the technologies 21
24 Moravian geographical Reports 3/2007, Vol. 15 above. The photorealistic 3D models of the territories in question with the differentiation comprehensible for the citizen are very useful. They can demonstrate both the territorially differentiated risks, and the scope of the event in question or its potential development (Fig. 6 see cover p. 2). They can offer miscellaneous solutions of the situation to the citizen (in the operative up to long-term time horizon). Availability of the visualization technologies in municipalities and individuals (home and institutional connection to internet, information kiosks inside the authorities equipped by touch screens) is another aspect of this issue. The physical geography can demonstrate the localized knowledge related to the monitored risks in the acceptable form and also present results of modeling of development of the monitored phenomena. This aspect of the public presentation of the physical geographical research has to be considered seriously, because it is a very important manifestation of the irreplaceable community involvement which will be appreciated by the wide public. 7. Conclusion The physical geography, being the traditional scientific discipline equipped by modern technologies and the open knowledge basis, can and even must contribute materially to provision of sustainable and continuous economic and natural development and to forming of well being of the population through its outputs. It is necessary not only to draw attention to the natural risks, but also to outline the methods how to manage them. The physical geography can also take effective part in the processes of struggle with consequences of technological and traffic disasters and terrorist actions. The society already acknowledges this fact very well and since 2005 the Ministry of Education, Youth and Physical Culture has been supporting materially the research project MSM Dynamic Geovisualization in the Crisis Management, which develops instruments and documents supporting the decision to respond in an optimal way to threatening phenomena around us. References: ALEKSEYEV, N. A. (1988): Stichijnyje javlenija v prirodě: projavlenije, effektivnosť zaščity. Mysl, Moskva, 254 pp. BARTKOWSKI, T. (1979): Ksztaltowanie i ochrona šrodowiska. PWN, Warszawa, 454 pp. BASTIAN, O., SCHREIBER, K. F. (eds.), (1994): Analyse und ökologische Bewertung der Landschaft. Gustav Fischer Verlag, Jena/Stuttgart, 502 pp. BLÖSCHL, G., SIVAPALAN, M. (1995): Scale Issues in Hydrological Modelling: A Review. In: Kalma, J. D., Sivapalan, M. (eds.): Scale Issues in Hydrological Modelling. Advances in Hydrological Processes, Wiley and Sons, Chichester, p BRYANT, E. A. (1991): Natural Hazards. Cambridge University Press, Cambridge-New York-Melbourne, 294 pp. BURNS, L. A., et al. (1991): PIRANHA - Pesticide and Industrial Chemical Risk Analysis and Hazard Assessment, U.S. EPA, Athens, 146 pp. CARON, L. M., MERCHANT, J. W. (1986): Geographic Information Systems for non-urban Local-Level jurisdiction: Existing Alternatives. In: Proceeding of Geographic Information Systems Workshop, Atlanta, p ECKBO, G, LAWSON, L., HOOD, W., SULLIVAN, C. (1998): People in a landscape. Prentice Hall, Upper Saddle River, New Jersey, 296 pp. ESTES, J. E., McGWIRE, K. C., FLETCHER, G. A., FORESMAN, T. W. (1987): Coordinating hazardous waste management activities using geographical information systems. International Journal of GIS, Vol. 1, No. 4, p EVANS, A. W. (2004): Economic and Land Use Planning. Blackwell Publishing, Oxford, 209 pp. FEDRA, K. (1995): Chemicals in the Environment: GIS, Models, and Expert Systems. Toxicology Modeling, Vol. 1, No. 1, p FLÜGEL, W.-A. (1995): Delineating hydrological response units by geographical information system analyses for regional hydrological modelling using PRMS/MMS in the drainage basin of the River Bröl, Germany. In: Kalma, J. D., Sivapalan, M. (eds.): Scale Issues in Hydrological Modelling. Advances in Hydrological Processes, Wiley and Sons, Chichester, p HABER, W., SCHALLER, J. (1988): Ecosystem Research Berchtesgaden - Spatial relations among landscape elements quantified by ecological balance methods. MS of the paper on European ESRI User Conference 1988, University of Technology, Freising- Weihenstephan, 30 pp. HARRIS, P. M., et al. (1991): Linking a GIS with an urban nonpoint source pollution model. In: Proceedings GIS/LIS 91, Vol. 2, The Inforum, Atlanta, p HESSION, S., SHANHOLTZ, V. O. (1988): A Geographic Information System for Targeting Nonpoint Source Agricultural Pollution. Journal of Soil and Water Conservation, Vol. 43, No. 3, p
25 Vol. 15, 3/2007 Moravian geographical Reports HEYWOOD, I., CORNELIUS, S. (1993): Managing environmental radioactivity monitoring data: a geographic information system approach. In: Haines-Young, R., Green, D. R., Cousins, S. (eds.): Landscape ecology and geographic information systems. Taylor and Francis, London-New York-Philadelphia, p HUBA, M. (1982): Štrnásť krokov na ceste za krajinným plánom. Geografický časopis, Vol. 34, No. 2, p JŮVA, J., ZACHAR, D., et al. (1981): Tvorba krajiny ČSSR z hlediska zemědělství a lesnictví. Academia/Veda, Praha/Bratislava, 592 pp. KNUTSON, R. L., DOUHAN C. (1991): GIS Use at Indiana Dunes National Lakes. GIS World, Vol. 4, No. 3, p KRYSANOVA, V., MÜLLER-WOHLFEIL, I., BECKER, A. (1996): Integrated modelling of hydrology and water quality in mesoscale watersheds. PIK Report, No. 18, p LAMONT, R. H. (1991): Avoiding Surprises in Selecting and Setting up a Geographic Information System. In: GIS Applications in Natural Resources. GIS World Inc., Fort Collins, p LIPSKÝ, Z. (1998): Krajinná ekologie pro studenty geografických oborů. Textbook. Karolinum, Praha, 129 pp. MacMILLAN, R. A., FURLEY, P. A., HEALEY, R. G. (1993): Using hydrological models and geographic information systems to assist with the management of surface water in agricultural landscapes. In: Haines-Young, R., Green, D. R., Cousins, S. (eds.): Landscape ecology and geographic information systems. Taylor and Francis, London-New York-Philadelphia, p MARSH, W. M. (1998): Landscape Planning: Environmetal Applications. 3 rd edition, John Wiley and Sons, Inc., New York- Chichester-Weinheim-Brisbane-Singapore-Toronto, 434 pp. MAZUR, I. I., IVANOV, O. P. (2004): Opasnyje prirodnyje processy. Ekonomika, Moskva, 702 pp. McDONALD, W. S., SMITH, S. M. (1991): An Integrated National Land Resource Coverage: New Zealand Experiences. In: GIS Applicationn in Natural Resources. GIS World Inc., Fort Collins, p McRAE, S., CLEAVES, D. (1986): Incorporating Strategic Data-Planning and Decision Analysis Techniques in Geographic Information System Design. In: Proceedings of Geographical Information Systems Workshop, Atlanta, p MEZERA, A., et al. (1979): Tvorba a ochrana krajiny. SZN, Praha, 476 pp. MUELLER, H. (1991): Object-oriented Simulation. A New Ecological Tool Emerges. GIS World, Vol. 4, No. 5, p NEPOMUCKÝ, P., SALAŠOVÁ, A. (1996): Krajinné plánování. Vysoká škola báňská Technická univerzita Ostrava/Ministerstvo životního prostředí ČR, Ostrava/Praha, 101 pp. OTT, T., SWIACZNY, F. (2001): Time-Integrative Geographic Information System. Management and Analysis of Spatio-Temporal Data. Springer Verlag, Berlin-Heidelberg-New York, 234 pp. PAMAP (1993): PAMAP/GIS. PAMAP Technologies Corporation. Victoria, 28 pp. PEARSON, E. J., WADGE, G., WISLOCKI, A. P. (1991): Mapping Natural Hazards with Spatial Modelling Systems (manuskript). EGIS 91 Conference, , Brussels, 9 pp. POLZER, P. L., et al. (1991): Linking GIS with Predictive Models: Case Study in Southern Wisconsin Oak Forest. In: GIS/LIS `91 Proceedings. Part 1. The Inforum. Atlanta, p RICHTER, H., SCHÖNFELDER, G. (1984): Geographische Landschaftsprognose. Geographische Berichte, Vol. 111, No. 2, p RINALDO, A., MARANI, A. (1986): Runoff and receiving water models for NPS discharge into the Venice Lagoon. In: Giorgini, A., Zingales, F. (eds.): Agricultural Nonpoint Source Pollution: Model Selection and Application. Elsevier, Amsterdam-Oxford- New York-Tokyo, p RYBÁR, R. (2001): The model application of the avalanche danger in Western Tatras. Ekológia (Bratislava), Vol. 21, No. 4, p ŘÍHA, J., et al. (1997): Matematické modelování hydrodynamických a disperzních jevů. VUT-FAST, Brno, 185 pp. SAUCHYN, D. J. (1989): Mapping and analysis of soil degradation in Southern Saskatchewan. In: Proceedings GIS - Challenge for the 1990s, EMR/CISM, Ottawa, p SHASKO, M. J., KELLER, C. P. (1991): Assessing large scale slope stability and failure within a geographic information system. In: GIS Application in Natural Resources. GIS World Inc., Fort Collins, p SCHÖNFELDER, G. (1989): Landschaftsprognose - ein Beitrag zur Gebietsentwicklung. Geoökologie, No. 6, p SHESTYAKOV, A. S. (1992): Principy klassifikacii ekologo-geografičeskich situacij. Izvěstija Rossijskogo Geografičeskogo Obščestva, Vol. 124, No. 3, p TAYLOR, M. E., ULLMAN, N. (1993): Wildlife Populations and Environmental Assessment. In: Proceeding of The Canadian Conference on GIS, Ottawa, p Thompson, J. W., Sorvig, K. (2000): Sustainable Landscape Construction. Island Press, Washington, 348 pp. 23
26 Moravian geographical Reports 3/2007, Vol. 15 van ELZAKKER, B. (1994): České zemědělství na křižovatce. Nadace pro občanskou společnost/agrospoj, New York/Praha, 85 pp. van WAGTENDONK J. (1991): GIS Highlights at Yosemite National Park. GIS World, Vol. 4, No. 3, p VANÍČEK, V. (1979): Implementation of the Czechoslovak Conservation Strategy in the Region of the Bohemian-Moravian Uplands. A case study of ecodevelopment. Ochrana přírody a krajiny, No. 11, p WEBSTER, C., SIONG, H. C., WISLOCKI, T. (1989): Text Animation or Knowledge Engineering? Two Approaches to Expert System Design. Technical Reports in Geo-Information Systems, Computing and Cartography, No. 18, Wales and South West Regional Research Laboratory, Cardiff-Bath-Southampton, 24 pp. WEICHHART, P., WEINGARTNER, H. (1983): Preliminary considerations on the application of the potential concept to alpine regions (by example of the Tennengebirge, Salzburg, Austria). In: Drdoš, J. (ed.): Landscape Synthesis. Geoecological Foundations of the Complex Landscape Management. Veda, Bratislava, p WERTZ, W. (1991): Dynamic Fire Simulation for Training and Prediction. GIS World, Vol. 4, No. 3, p Author s address: Assoc. Prof. RNDr. Jaromír KOLEJKA, CSc. Masaryk University, Faculty of Education Dept. of Geography Poříčí 7, Brno, Czech Republic Kolejka@ped.muni.cz Reviewer: Assoc. Prof. RNDr. Alois HYNEK, CSc. 24

27 Vol. 15, 3/2007 Moravian geographical Reports THE FLOOD IN AUGUST 1880 ONE OF THE MOST SEVERE NATURAL DISASTERS OF THE 19 th CENTURY IN THE OSTRAVA REGION (CZECH REPUBLIC) Abstract Jan MUNZAR, Stanislav ONDRÁČEK, Tomáš ŘEHÁNEK Taking into account the high water events in the summer of 1813, the flood of August 1880 is one of the most severe natural disasters occurring in the Odra/Oder River Basin (especially on its right-bank tributary, Ostravice R.) in the 19 th century. This flood is believed to be comparable with the flood disaster of July Having devastated the Ostrava region, it became for a long time a milestone for local people, who divided time into the period before and after its occurrence. This severe natural disaster is discussed in this paper with respect to its causes, contemporary local and regional experiences, and subsequent impacts and consequences. Shrnutí Povodeň v srpnu 1880 jedna z největších přírodních katastrof 19. století na Ostravsku (Česká republika) Povodeň v srpnu 1880 patří vedle záplav v létě 1813 k největším živelným pohromám v povodí Odry v 19. století, pravděpodobně srovnatelným s povodňovou katastrofou z července Zpustošila Ostravsko a nadlouho se stala časovým mezníkem pro tamní obyvatele, kteří dělili čas na dobu před jejím výskytem a po ní. V příspěvku je pojednáno o příčinách, průběhu, regionálním rozsahu a následcích této přírodní pohromy. Keywords: flood, Oder River, Ostrava region, Czech Republic 1. Introduction Historical sources and other extant data and information indicate that the flood which occurred in August 1880 in the Odra/Oder River basin (Fig. 1), particularly in its upper reach was of an entirely irregular extent. It was doubtlessly one of the most severe flood disasters affecting this territory in the 19 th century. Before the flood of July 1997 it was considered the greatest natural disaster ever known in the history of the Ostrava region (see e.g. Garguláková, 1983) and it was likely to be the most severe high water of the 19 th century on the Ostravice River, the right-bank tributary of the Oder R. It belonged in the category of greatest floods even on the Oder R. itself but according to Prussian water gauges that were installed at several places already at that time, the culmination water levels of some floods (e.g. in 1813, 1831 or 1854) were reaching somewhat higher (Munzar, Ondráček, 2006). 2. Reasons of the flood disaster Sunny weather changed into a heavy rain accompanied by a windstorm already on Monday 2 August Fig. 1: The Odra/Oder R. basin scheme with the demarcation of Czech, Polish and German boundaries. (Drawing: E. Kallabová) 25

28 Moravian geographical Reports 3/2007, Vol. 15 The rain continued with only a few breaks also in the following days. The dried out soil was soon soaked and could not absorb more water. Levels of local streams and rivers began to swell dangerously. Regular weekly fair was not summoned on Wednesday 4 August because some access roads were disconnected. J. Štekl et al. (2001) evaluated the synoptical situation as follows: the primary depression (moving along trajectory Vb according to van Bebber) of hpa had a centre above southern Poland on 4 August Precipitation occurred on the cyclone rear under an intensive northwestern flowing. The highest total daily precipitation amount (179 mm) was on that day measured by the Ostravice station (427 m a.s.l.). From 3-5 August, daily total precipitation amounts over 100 mm were recorded in Karviná (3 August), Chotěbuz and Jablunkov (5 August see Tab. 1). In August 1880, the precipitation measurements were made by 17 stations. The precipitation centre was in the Beskydy Mts. (Beskids Mts.), i.e. in the watershed of Ostravice R. and Olše R. The highest 3-day total precipitation amount was 302 mm measured by the Ostravice station (Fig. 2). Station Total precipitation 3-5 August (mm) Daily maximum (mm) Bernartice u Javorníku Bílovec Bohumín Černá Voda Holčovice Chotěbuz Jablunkov Karviná Kyjovice Nový Jičín Opava Ostravice Razová Rýmařov Staré Hamry Suchdol n. O Vítkov Tab. 1: The causal precipitation (Database of CHMI, Ostrava branch) Date Fig. 2: Rain gauging stations, water gauges and distribution of total precipitation amounts in the period from 3-5 August 1880 in Oder R. basin in Moravia and Czech Silesia 26
29 Vol. 15, 3/2007 Moravian geographical Reports 3. Extant data and the information on gauge heights of water stages and discharges Although the regular observation and recording of water level stage was commenced in the Czech part of the Oder R. basin as late as in 1895 in connexion with the foundation of the Central Hydrographical Office /Hydrographische Zentralbüro/ in Vienna and its provincial department in Opava, some water gauges were existing there already in August Apparently the first water gauging place in this region was the water gauge on the Oder River in Svinov near the bridge of Severní dráha (Northern Railway) established in Other water gauges were installed on the Oder R. tributaries, on the Opava River in Opava and in Jilešovice, on the Ostravice River in Frýdek and in Hrušov, and on the Olše River in Závada. At that time, there were already also some Prussian water gauges on the Oder R. near Bohumín (Oderberg), below the confluence with the Olše R. near the today s village of Olza, and another one some 20 km downstream in Racibórz. All these water gauges could take and did take the measurements of culmination water level stages during the flood in August Their values are listed in Tab. 2. Estimated or derived values of the culmination discharge for the flood in August 1880 at several places in the Oder River basin are presented in Tab. 3. Station Water course Gauge height (cm) Ostrava-Svinov Oder 240 Opava Opava 240 Frýdek Ostravice >400 Ostrava-Hrušov Ostravice 380 Annaberg (near Bohumín on the Polish side of the border) Oder 530 Bohumín (derived according to Annaberg) Oder 565 Závada Olše 320 Olza (below the confluence of the Oder R. and Olše R.) Oder 710 Racibórz Oder 730 Tab. 2: Culmination water level stages of 5 August 1880 (according to Řehánek 2004) Station Water course Discharge (m -3.s -1 ) Note Frýdek Ostravice 1000 According to Kříž et al., 1964 Opava Opava 340 According to Kříž et al., 1964 Bohumín Oder 1374 According to Der Oderstrom + confirmed by derivation Tab. 3: Culmination discharges of 5 August 1880 If the culmination discharge of the Oder R. in Bohumín on 5 August 1880 is compared with the greatest floods of the 20 th century, the high water event would occupy the third place. It was surmounted only by the floods of 1903 and 1997: on 11 July 1903 the culmination discharge in Bohumín was 1,500 m 3.s -1 and on 8 July 1997 it amounted to 2,160 m 3.s -1 (comp. Fig. 3). With the culmination discharge value the flood of August 1880 nears most the third greatest flood of the 20 th century, which occurred in July 1939 with the culminating discharge of the Oder River in Bohumín amounting to 1,360 m 3. s -1 on 27 July Fig. 3: Maximum discharges of the Oder River in Bohumín in the period

30 Moravian geographical Reports 3/2007, Vol. 15 Interesting are historical data on the measured and estimated Ostravice R. discharge in Moravská Ostrava, details of which have not been discovered so far. According to them discharges recorded on the Ostravice River were 1,710 m 3.s -1 at the bridge of the Ostrava-Frýdlant Railway, 2,195 m 3.s -1 at the lower situated bridge of the Báňská Railway, 890 m 3.s -1 on the Lučina River at the mouth, 2,328 m 3.s -1 on the Ostravice River below the confluence with the Lučina R. (at the Chain Bridge), 757 m 3.s -1 were flowing outside the river channels flooding the town, and a total discharge was 3,085 m 3.s -1 (Garguláková, 1983). However, the estimates are today considered largely exaggerated, and according to Brosch (2005) a maximum flow through the Chain Bridge could have been about a half of the then indicated value. A comparison of the culminating flood in 1880 with other eight greatest floods observed on the Oder River in Bohumín is presented in Fig. 4. Fig. 4: Culmination of the greatest observed floods on the Oder River in Bohumín The only extant epigraphic reminder of the flood in 1880 found in the Ostrava area is a flood mark on the Old Town Hall building in Masaryk Square (Figs. 5-8) situated at a distance of some 300 m from the Ostravice R. (Řehánek, 2005). 4. The extent of floods and their consequences Many natural disasters in our towns great floods, fires or plagues have doubtlessly engraved deep into the memory of contemporaries with the information on them being usually carried through from generation to generation. The oldest of them are as a rule fragmentary and we unfortunately know nothing about the course and consequences of these former floods. Nevertheless, the situation is entirely different in the case of the great flood of August 1880 in the north of Moravia and in Silesia. The high water affected namely the towns of Studénka and Bohumín on the Oder River itself, and the towns of Frýdlant nad Ostravicí, Frýdek, Místek and Moravská Ostrava in the basin of its tributary Ostravice R., Těšín on the Olše River, Příbor and Frenštát pod Radhoštěm on the Lubina River, Fig. 5: View of the southern corner of Masaryk Square in Ostrava with the Old Town Hall at the back the today s municipal museum ( Krnov and Opava in the Opava River basin, and tens of other villages in the watershed of these rivers. The flood disaster affected also the Morava (March) River basin, namely towns in the watershed of its tributary Bečva R. Vsetín, Valašské Meziříčí, Krásno, Hranice, Teplice nad Bečvou, Lipník and Přerov. 28
 Fields and grasslands, roads and railways in this vast area were under water; thousands of families had to leave their abodes of whom many were destroyed by high water or swept away and it is")
31 Vol. 15, 3/2007 Moravian geographical Reports Fig. 6: The Old Town Hall in Ostrava, which appeared flooded up to nearly 2 m in 1880 (Photo: L. Šrubařová, Fields and grasslands, roads and railways in this vast area were under water; thousands of families had to leave their abodes of whom many were destroyed by high water or swept away and it is said that there were some casualties, too. The disaster took a toll of 3 lives in Moravská Ostrava and 2 lives in Slezská Ostrava (Garguláková, 1983; Jiřík, 2000). The extent of the Ostravice R. and Lučina R. inundation on 5 August 1880 in the territory of Moravská Ostrava and its near surroundings is illustrated on a detailed colour map (Fig. 9) attached to the publication Contributions to the history of Moravská Ostrava by F. Wattolik official of the Vítkovice Mining and Metallurgy and the eye witness of flood disaster in 1881 (Munzar, Ondráček 2005). The high water flooded nearly the whole town, the only places spared were the main square and adjacent open spaces around St. Wenceslas Church. Outskirts of Moravská Ostrava were nearly all under water with hundreds of people crowding on roofs. The natural disaster was crowned by the fire of Dinger paraffin factory that was inundated up to 1.4 m, which made the extinguishment impossible and the works were left to accidence. Apart from the pervasive smell of gas leaking from the damaged gas line the town was plagued also with the smell of burning oil. In addition to several tens of houses completely destroyed, there were many industrial sites and mines flooded by water such as the coal pits Hermenegild, Salamoun, Central coking plant, municipal gasworks (so that the town was without lighting) and the baths. The Karolina Mine was protected against the penetration of superficial water by a big stop-gap. Several miner colonies found themselves under water, too. All local railways were put out of operation. But these great losses and consequent problems did not concerned only industry but agriculture as well. Only in the Ostravice River basin the swallen water inundated 5,800 ha of soil. Many field crops that were not torn out by the flowing water and that were likely to recover later were totally damaged by spilled petroleum from the paraffin factory and could not be even used as a fodder for livestock. Potatoes as a main food component for most local inhabitants were of no use because they not only caught rots but were smelling of petroleum. 29


32 Moravian geographical Reports 3/2007, Vol. 15 Fig. 8: A flood mark detail with the text: H M. = Hochwasser 1880 Marke (Photo: T. Řehánek) Fig. 7: The extant flood mark of high water in 1880 on the column of the Old Town Hall in Ostrava (Photo: T. Řehánek) With its size and extent the great natural disaster became for long a milestone for local inhabitants who got used to divide the time into before and after the flood of Of floods occurring in the 19 th century similar consequences had only the flood of August When a chain bridge across the Ostravice River began to be constructed in 1847 from Moravská Ostrava to Slezská Ostrava (in place of today s Sýkorův most Bridge), its height was set up according to the hitherto known highest water level stage on the river, which was exactly the Ostravice R. culmination in 1813; it was hence designed to be other 30 cm above this stage. The bridge later resisted even the disastrous flood of August 1880 but collapsed 6 years later during the displacement of a military troop. The enormous flood damage in the region retrieved considerations of the necessity to embark on the regulation of local rivers as soon as possible not to put into a serious doubt the possibility of living in the region. Because the hitherto steps adopted by local authorities in the matter of initiating the Ostravice River regulation ended up to now by statements on the necessity of such a regulation, all that has been achieved at higher places is unfortunately not enough to repel the fears. It remains therefore but to wish this affair of supreme importance the needed attention so that the days of misery and panic as those of 5 and 6 August 1880 cannot return wrote F. Wattolik Two months after the disastrous floods which were the most disastrous ones in the town s history Moravská Ostrava was visited by J. Hobohm, expert in hydraulic structures from Vienna who arrived to become acquainted with the terrain and with the general water regime right on the spot. Having had seen the entire Ostravice River basin up to Frýdlant and having had studied in detail all water courses in the Beskydy Mts. (Beskids Mts.) he submitted a detailed analysis on measures necessary to prevent (or to reduce at least) water inundations in the future. His draft of measures was discussed and passed by the municipal committee on 9 November The prognosis made by Ing. Hobohm ended up rather cheerless: in his opinion, the hydrological situation of rivers in the Beskydy Mts. worsened so much that inundations are to be foreseen even if there is not too much rain. Channels of mountain streams were changed so that water flowing down from the mountains is much faster and carrying away greater amounts of gravelsand. New braiding streams have emerged and the period of water retention in the mountains is shortening so that rapid torrential rains cannot be absorbed by the alluvial riverbeds. Therefore he suggested to erect multiple small hydraulic structures in the mountains in order to create a sufficiently large inundation area in valleys along the riversides that should not be built-up (Garguláková, 1983). 30

33 Vol. 15, 3/2007 Moravian geographical Reports Fig. 9: The inundation map of Ostravice R. and Lučina R. in Ostrava on 5 August 1880 (F. Bartonec in Wattolik, 1881) 31
34 Moravian geographical Reports 3/2007, Vol. 15 Fig. 10: Front page of the publication by E. Markus on the proposal to regulate the Ostravice River of 1883 This brief paper has unfortunately no more space to follow the further development of the efforts focused on flood prevention in the concerned region. The authors would like to add that not even three years after the disaster a detailed report on the Ostravice River was published in Vienna by the master of ameliorations Ing. Eduard Markus with the proposal for its regulation (Fig. 10), elaborated on the authority of the Ministry of Agriculture (Markus, 1883). In this publication he bears on the assumed estimates of culmination discharges in August 1880 which are today considered to be unrealistically high. 5. Conclusion The size and reach of the flood occurring in the Ostravice R. basin in August 1880 was surmounted at an off-set of nearly 120 years in July In a recent comparison of the overbanks of the two floods in the Ostrava area an important finding demonstrated that the flood in 1997 was of a considerably smaller extent both due to the water course regulation and thanks to the retention effect of dams (Brosch, 2005). As mentioned above, the flood situation in August 1880 affected apart from the Oder River watershed also the basin of the Morava/March River and its tributaries Desná R., Merta R. (Polách, Gába, 1998) and Bečva R. Similarly as Ostrava, the town of Přerov experienced the most severe flood disaster in history that was later surmounted only in July The authors maintain that it is useful to continue in the documentation and delimitation of area affected by the irregular event of 1880, and in addition to registration of losses to attempt also at a mapping of the development of flood measures triggered by this extreme. It would be also meaningful to try to answer a question how the flood in August 1880 concretely showed in a much larger part of the Oder River on the Polish side of the border. 32
35 Vol. 15, 3/2007 Moravian geographical Reports Acknowledgement The authors would like to express their gratitude to Grant Agency of the Academy of Sciences of the Czech Republic for supporting Project no. IAA within the framework of which this paper was prepared. References: BROSCH, O. (2005): Povodí Odry. Nakladatelství Anagram, Ostrava, 324 pp. CIMALOVÁ, L., HEP, L. (1977): Z dějin vodního hospodářství Ostravy. Technické muzeum v Brně a Národní výbor města Ostravy. GARGULÁKOVÁ, Z. (1983): Povodeň v Ostravě a okolí v roce 1880 největší známá živelní pohroma na Ostravsku. In: Ostrava sborník příspěvků k dějinám a výstavbě města, No. 12, p JIŘÍK, K. (2000): Moravská Ostrava pod vodou v roce Dobová svědectví. Vlastivědné listy (Opava), Vol. 26, No. 2, p KŘÍŽ, V. et al. (1964): Opakování velkých vod v povodí Odry. Sborník prací HMÚ ČSSR (Praha), No. 5, 132 pp. MARKUS, E. (1883): Die Regulierung des Ostrawitza Flusses. Verlag des k.k. Ackerbau-Ministeriums, Wien. MUNZAR, J., ONDRÁČEK, S. (2005): Velké povodně na Odře v 19. a počátkem 20. století a jejich impakty. In: Hydrologické dni 2005, Bratislava September 2005, CD-ROM, p MUNZAR, J. ONDRÁČEK, S. (2006): Examples of great cross-border floods in the Odra river basin and their impacts. In: Dokumentacja geograficzna. Warszawa, No. 32, p Der Oderstrom, sein Stromgebiet und seine wichtigste Nebenflüsse, Bd. 3. Dietrich Reimer, Berlin POLÁCH, D., GÁBA, Z. (1998): Historie povodní v šumperském a jesenickém okrese. In: Severní Morava, Vol. 75, p ŘEHÁNEK, T. (2004): Záznamy o historických povodních v povodí Odry. In: Sborník příspěvků z konference Říční krajina,univerzita Palackého, Olomouc, p ŘEHÁNEK, T. (2005): Analýza významných povodní v povodí Odry. Poster na konferenci Hydrologické dni 2005, Bratislava September ŠTEKL, J. et al. (2001): Extrémní denní srážkové úhrny na území ČR v období a jejich synoptické příčiny. Národní klimatický program ČR (Praha), Vol. 31, p WATTOLIK, F., 1881: Beiträge zur Geschichte der Stadt M.- Ostrau. A.Herold, Mähr. Ostrau, 242 pp. Authors addresses: RNDr. Jan MUNZAR, CSc., munzar@geonika.cz RNDr. Stanislav ONDRÁČEK, ondracek@geonika.cz Academy of Sciences of the Czech Republic Institute of Geonics, ASCR, v.v.i, Brno branch Drobného 28, CZ Brno, Czech Republic RNDr. Tomáš ŘEHÁNEK, PhD. Czech Hydrometeorological Institute, Ostrava branch, K Myslivně 3, CZ Ostrava, Czech Republic rehanek@chmi.cz Reviewer: RNDr. Ivan SLÁDEK, CSc. 33
36 Moravian geographical Reports 3/2007, Vol. 15 OLIVE GROWING IN SLOVENIAN ISTRIA AND CLIMATIC LIMITATIONS TO ITS DEVELOPMENT Abstract Darko OGRIN In Southwestern Slovenia olive trees grow at their northern climatic limit, such that they are periodically endangered by severe frosts. In the 20 th century, the average recurrent period of frosts was 20 years, and in the 18 th century, which is considered to have been colder it was years. In spite of the risk of periodic frosts, olive growing is an important and profitable economic activity, which is steadily progressing due to an increasing demand for olive oil in the last few decades. An analysis of topoclimatic conditions for olive trees shows that within the existing cultivated area, the capacities are sufficient to double at least the present-day olive groves. Expansion beyond the borders of the traditional area, however, could be questionable despite a predicted climatic warming, since the same prognoses also forecast a greater possibility of weather disasters and extremes, including frosts. Shrnutí Vliv klimatických podmínek na možnost rozšíření pěstování oliv ve slovinské Istrii V jihozápadní části Slovinska rostou olivovníky při severní klimatické hranici pro tuto plodinu a jsou tudíž periodicky ohrožovány silnými mrazy. Ve 20. století byla průměrná délka období opakování mrazů 20 let a v 18. století, které se považuje za chladnější, to bylo 10 až 15 let. Přes toto riziko periodicky se opakujících mrazů je pěstování oliv významnou a ziskovou ekonomickou činností, která se neustále rozvíjí díky rostoucí poptávce po olivovém oleji v posledních několika desetiletích. Analýza topoklimatických podmínek pro olivovníky ukázala, že kapacity stávajících ploch pěstování oliv jsou postačující pro minimálně zdvojnásobení plochy olivových hájů. Rozšíření ploch za hranice tradičního areálu však může být diskutabilní, a to i přes předpovídané oteplování klimatu, neboť tytéž prognózy rovněž předpovídají větší možnost přírodních katastrof, mrazy nevyjímaje. Key words: olive growing, Paleoclimate, topoclimate, frosts, Slovenian Istria, Slovenia 1. Introduction Plantations of olive trees in the south-western part of Slovenia, in the littoral belt of the Gulf of Trieste as well as smaller plantations of this crop in the Goriška Brda and in the Vipavska dolina valley and some growing areas in northern Italy (the Treviso region, North- Italian lakes) fall within the northernmost areas up to which olive trees can still be grown and their growing is still profitable. The quality of olive oil at the northern climatic border is better so its market value is greater, too. The disadvantage of these locations, however, is a greater threat of frost because of the advances of cold air. If frosts are too frequent, the growing of olives can become nonprofitable, due to high costs of the revitalization of plantations and the loss of income. A possible abandoning of olive growing or its decline, which already occurred after frosts in the past, would not only result in negative economic effects but would also cause great damage to the conservation of cultural landscape. A rather large percentage of agrarian plots that were restored and cultivated in the past two decades of intensive revitalization of olive groves would certainly be overgrown again, because this land is less suitable for other agrarian crops and because vocational and social structure of olive growers is rather specific, since olive growing is only a supplementary activity for the majority of them. During the recent few decades, particularly after 1980, the olive growing in Slovenian Istria has undergone a rapid progress. Olive groves cover nearly 1,300 hectares, more than 350,000 olive trees in total grow there, and the annual harvest is from 2,000 to 2,300 MT of olives, out of which about 500 MT of oil is pressed. Because of the increasing demand on the Slovenian market for qualitative home-produced olive oil (the current production meets less than a half of the demand), intensive spread of olive trees further 30 to 50 hectares are planted with olives each year and a gradual comeback of olive tree to the areas where it 34

37 Vol. 15, 3/2007 Moravian geographical Reports had already been grown in the past but frosts pushed it towards the sea, a question can be asked what are general geo-ecological possibilities of its further spread and, particularly, what are its climatic limits. 2. The State of Olive Growing in Slovenian Istria In Slovenia, olive trees are grown in the area of about 1,300 hectares of which 15 hectares, approximately, are located in the Goriška Brda and in the lower section of the Vipavska dolina valley, where olive tree has gradually returned after the frost of 1929, and the rest of these hectares are located in Slovenian Istria. Olive as a typical Mediterranean crop does not grow in the whole of Slovenian Istria but only in its coastal belt and on hills up to an elevation of 250 m, rarely even up to 300 m. Neither does it grow on the alluvium of streams because of unsuitable soil and climate conditions (occurrence of temperature inversion). It reaches into the hinterland only to sunny slopes along the streams of the Rižana, Osapska reka, Badaševica, Drnica, Dragonja and Rokava. Most of the olive groves occur in the western, slightly lower part of Slovenian Istria, west of Škofije Marezige Koštabona line (Fig. 1). Fig. 1: Geographical location of the area discussed Olive growing in Istria gained importance at the times of the Roman Rule. It was in full swing in the period of the Venetian Republic, which systematically fostered this crop to satisfy the needs of its own market. A rather great number of olive trees grew also in the initial period of the Austrian Rule over Istria, when a law was put in force of compulsory planting of a certain number of olive trees for each of new weds. In this way, the number of olive trees remained in proportion with the growth of the population (Razvoj pridelovanja..., 1985). The development of viticulture in the second half of the 19 th century marked the beginning of the decline of olive growing. The frost of 1929 was a serious shock to it because the number of trees dropped from 300,000 to 120,000. Political and social changes after World War II and the resulting partial changes in the population as well as the intense abandoning of agrarian activities and depopulation in the hinterlands of Slovenian Istria caused the decline in the number of olive trees down to 50,000 60,000. In addition, olives were heavily affected by the frost of In the 1980s, a revitalization of olive groves began but was partly impeded by the frost of In spite of this, the number of olive trees increased to about 126,000 by 1990, of which 90,000 grew in extensive and 36,000 in intensive groves (Vesel, Sedmak, 1990). The development was slightly slowed down by late frost in 1996, which mainly affected young trees (Ogrin, 1997), but it did not stop the spreading trend and the olive with more than 350,000 trees has already reached the fourth place in Slovenia after the apple, peach and pear. Olive groves in Slovenian Istria are private. Individual owners have smaller areas only (from 0.2 to 3 hectares). Even greater complexes with olive trees are but smaller; the largest one covers about 14 hectares. In the new plantations the autochtonous sort called Istrska belica prevails (50-70%). It yields abundant harvest and is rich in oil and rather well resistant to frost. To obtain a better harmony of olive oil, several sorts are required, so also leccino is planted (20-30%), and other sorts too grow in older groves, e.g. pendolino, frantoio, moraiolo, štorta, buga, črnica, drobnica, mata, etc. (Vesel, 1996). 35

38 Moravian geographical Reports 3/2007, Vol. 15 Fig. 2: More recent olive groves are monocultures. Since olive trees are mostly grown in small areas, olive picking is manual. (Photo: D. Ogrin) 3. Climatic Suitability of Slovenian Istria for Olive Growing Olive groves in Europe occur in the littoral zone of the Mediterranean and its adjacent seas; they are mainly located between 30 and 35 of N geographical latitude. They grow most fruitfully in the Mediterranean climate, with mild winters and not too hot summers. Dangerous for olives is winter when air temperature drops below -8 C. Olive tree is a xerophyte, well adapted to droughts. It also grows in areas with mm of annual precipitation; for average harvest, a minimum of 130 mm precipitation must fall from February to May, and mm from July to September. A greater amount of precipitation (over 1,000 mm) is not harmful to it provided that the ground is sufficiently permeable. As to soil conditions, it is not demanding at all. It grows in dry, sandy and stony soils which must be permeable and must contain enough calcium (Sancin, 1990). Because of the northern position of Slovenian Istria (it lies above 45 of N geographical latitude) and a mitigated influence of the Mediterranean climate, climatic conditions for olive growing in Slovenia are on the very limits. Winter minimum temperatures are the main limiting factor. According to Sancin (1990), olive trees can even stand the temperatures from -13 to -15 C during their winter dormancy; this depends on air humidity, sort of olive, nutrition level of the plant, its age, etc. The longer the duration of cold and the greater the humidity of air, the sooner the frost occurs. It is easier for olives to endure shorter spells of cold, dry weather with temperatures from -13 to -15 C than longer spells of cooling with temperatures from -5 to -8 C but with a high air humidity. Sensitivity to cold is considerably greater in young plants. The threat of damages caused by cold is greater when the growing season has already begun or still lasts. In such a case, even temperatures from -2 to -3 C can be destructive. Particularly dangerous is fast and intense cooling after early spring warming when assimilation processes in plants have already begun. In general, damage first occurs on leaves and twigs at -8 C, on larger-diameter branches and on the trunk at -10 to -12 C. If cold lasts longer, the trunk freezes at -14 to -16 C. But even at such low temperatures, roots never get damaged and in spring new sprouts will appear from them (Sancin, 1990). In general, temperatures in Slovenian Istria drop from the coast towards the higher altitudes of the inland, therefore a greater danger of frost for olive trees occurs in the inland area. Along the coast, an average January temperature is around 4 C and temperatures in the higher inland areas range between 2 and 4 C. Average minimum January temperatures in the coastal belt are still above zero, but in the inland they already drop below 0 C. The danger of frost is also greater at valley bottoms where explicit temperature inversions occur at night under anticyclonic weather conditions. The analysis of temperature data from two weather stations, one at Portorož (92 m a.s.l.) by the sea and another in the inland of Slovenian Istria, at Kubed (262 m), up to which height olives still grow, showed that during the frost of January and February of 1985 two days only had a minimum temperature below -8 C at Portorož, whereas there were as many as 11 such days at Kubed. While temperatures at Portorož did not drop below -10 C, there were six such days at Kubed. 36
39 Vol. 15, 3/2007 Moravian geographical Reports An absolute minimum temperature during this frost was -9.3 C at Portorož on 8 January 1985, and on the same day the temperature at Kubed dropped to -16 C. It was so cold at Kubed because of its position in the valley system, where temperature inversion developed. Comparison with the latest frost of 1996 is not possible because no weather station has been operated in the inland since According to the data of the period, the probability of cold days (minimum temperature below 0 C) and very cold days (minimum temperature below -10 C) differs greatly in the coastal zone and in the higher inland. On average, there is not a single very cold day by the sea in 30 years, but there is at least one in the inland. On average, 8 cold days occur annually in the coastal belt and about 30 in the inland. There is a great possibility in the inland of temperature dropping below -8 C, when first damages to olives occur. On the average, such temperatures occur every second year, while in the coastal belt, once in 15 years, which is within tolerable (current) limits of profitable olive growing. However, a question is to be asked what will happen in the future when the production of oil will increase due to the spread of olive groves and an ever higher fruitfulness of today s young plantations, and its price will likely drop because of an ever greater import. The danger of frost can be slightly reduced by a proper, carefully chosen microlocation of plantation (sunny position in the lee from bora in the thermal belt) and a proper selection of varieties. Other climatic elements, except for bora which can break branches and contribute to temperature drop, do not impede the olive growing. On average, it happens once in 30 years (theoretically) that olive trees suffer drought in summer months, when the quantity of precipitation does not exceed 50 to 70 mm, which is the lowest limit for a sufficient fruitage. Young trees are more sensitive to drought because their root system has not been completely developed, therefore, during the first few years, they need watering in summer if more severe droughts occur. Days with specified temp. in 30 years Temperature Type of damage Portorož (92 m a.s.l.) Kubed (262 m a.s.l.) > -6 0 C Undamaged to -9 C Damaged leaves and young sprouts 2 15 < -10 C Damaged twigs 0 2 < -15 C Frosted main branches and trunk 0 1 > +40/50 C Fruitage ceases 0 0 Tab. 1: Temperature thresholds for olive damages and their occurrence in Slovenian Istria in the reference period 3.1. Frosts of olives in the past Frost of olives in the Trieste Gulf is a recurrent phenomenon which must be taken into account in this economic branch. According to the chronicle of exceptional weather phenomena compiled by Braun (1935) for Trieste, Istria and eastern Friuli in the period after the 7 th century and supplemented with additional sources by Ogrin (1994, 1995), there are 20 records which directly report on frosts of olives including frosts in the 20 th century (Tab. 2). In the last 300 years, there were 16 such cases, which means one per 18 years on average. Century Count of frosts Year of frost Recurrence period 15 th th 0 17 th , th , 1709, 1738, 1763, 1782, 1789, years 19 th , 1829, 1847, years 20 th , 1929, 1956, 1985, years 18 th -20 th years Tab. 2: Frosts of olives in Slovenian Istria in the past Frosts were most frequent in the 18 th century (seven; one per 14 years), particularly in its second half. Together with the frosts in the first half of the 19 th century they belong in the end of a so-called Little Ice Age, i.e. a rather cold period which began in Europe in the mid-15 th century and had several cold climaxes, one of them at the end of this period. According to the analogy with the second half of the 19 th century and the 20 th century for which concurrent climatic measurements and descriptions of the effects of low winter temperatures are available, it can be presumed that frosts of olives were even more frequent in the past. It is highly likely that olives froze, partly at least, also in years in which chronicle writers reported 37
40 Moravian geographical Reports 3/2007, Vol. 15 ice in Venetian lagunas, at the mouth of the Isonzo river or by the coast of the Trieste Gulf. Taking account of this possibility, the recurrence period of frost in the past 300 years shortens to 14 years, and even to 9 years in the 18 th century. The 20 th century is believed to be a rather warm period in the history of climatic conditions, with a gradual rise of temperatures, namely in the winter. There were five major frosts of olives (Tab. 3) in this century, the latest one of 1996 included. Their recurrence period was 20 years on average (Fig. 4 see cover p. 3). Frost Absolute minimum temperature Damage 1929 Trieste (Feb. 11) C 90% of trees destroyed Kubed (Feb. 10) Kubed (Feb. 16) Portorož (Jan. 8) Kubed (Jan. 8) Portorož (Dec. 29) Korte (Dec. 29) C C -9.3 C C -8.5 C C Tab. 3: Frost damages on olives in Slovenian Istria in the 20 th century 30% of trees frosted to the ground. Revitalization prevented by frost. 60% of trees damaged. Harvest reduced by 80%. Nearly completely damaged one-year plantations. 4. General Topoclimatic Conditions for the Development of Olive Growing in Slovenian Istria The intensive spread of olive groves in Slovenian Istria in the past decade and the great demand for olive oil pose a question about the possibility of a further development of this branch. It depends on a number of factors, e.g. on social and economic ones, on the structure of owners, etc., and among physicogeographical factors there are also the limitations that are set within the general climatic conditions by so-called topoclimatic conditions (Vysoudil, 1993). These primarily depend on the characteristics of landforms, mainly the altitude structure, concave landforms, surface inclination and exposure. Altitude in Slovenian Istria is an important topoclimatic factor in olive growing because temperatures drop with the increasing altitude. Temperatures in the coastal belt are by 2 to 3 C higher than on the flysch hills and by about 4 C higher than on the m high Podgorski Kras plateau. The uppermost limit for olive growing, established during several centuries of olive growing tradition in Slovenian Istria, is at about 250 m a.s.l. Most olive groves are situated up to this elevation, while a smaller percentage of them also occur in favourable microlocations up to an elevation of 350 m a.s.l. Exposure is important from the aspect of energy received from solar radiation and duration of insolation and, accordingly, higher temperatures. Because of the shade cast by the surrounding slopes, bottoms of the valleys in Slovenian Istria receive the insolation which is by even more than 4 hours shorter in the winter solstice than on the south-oriented slopes. According to the calculations by Ogrin (1995), the sunniest slopes receive yearly even up to 50% more energy from solar radiation than the most shaded ones. Besides, south positions are well protected against the bora. Thus Vesel (1998) is of the opinion that most suitable for olive groves are the south, south-west and west locations. Surface inclination is decisive for energy received from solar radiation and for the amount of moisture in the soil. According to the calculations by Hočevar (1980), the most favourable locations from the aspect of received energy are the south ones, with an inclination of about 40. Such steep slopes are very rare in Slovenian Istria, since only a little more than 2% of its surface is steeper than 20. This aspect of surface inclination does not belong to relevant limiting topoclimatic factors for olive growing. More important is the aspect of water drainage which is faster on steeper slopes; therefore, terraced olive groves are arranged there. This method grants a sufficient soil moisture even in droughty summer months when precipitation is scarce. Concave landforms (valleys, basins, karst depressions) offer favourable conditions for the occurrence of temperature inversions, which means a greater danger of frost, more frequent white frost, and greater air humidity which is not favourable for olives either. Despite their location near the sea, temperature inversion is frequent in the depression landforms in Slovenian Istria, which coincides with 50 to 75% frequency of anticyclonic weather type. Inversions are explicit in fluviokarstic valley systems, on the transition of the karstic into the flysch area of Slovenian Istria (Movraška vala, Gračiška vala) and in the valleys of the Rižana, the Dragonja, the Rokava and the Drnica in the heart of the hills. Here, the differences in temperatures between the inversion air layer and the thermal belt, which begins a few tens of meters above the bottom, can amount up to 8 C or even more. Inversions are slightly weaker in the valleys by the sea, where the differences range from 3.5 to 5 C. The bottoms of fluviokarstic valleys and valley systems are not favourable for olives also due to alluvial accumulations where heavier and wetter soils developed. 38

41 Vol. 15, 3/2007 Moravian geographical Reports In order to establish areas suitable for olive growing and to calculate the percentage of suitable plots we first made a partial analysis of suitability by individual topoclimatic elements. Considered as favourable were elevations up to 250 m, inclinations up to 37, to where terraces have traditionally been made, and exposures from SE to NW, excluded as unfavourable were valley bottoms and fluviokarstic valley systems because of a greater frost danger, greater air humidity and less favourable soil conditions. By overlaying individual layers at the final stage, areas in Slovenian Istria were established which are suitable for arranging olive groves from the aspect of topoclimate. The basis for calculations and map presentations was a digital elevation model of 100 x 100 meters. The operations were performed by means of the IDRISI programme package (Eastman, 2001). The analysis showed that 20% or 83 sq km in the whole Slovenian Istria (419 sq km) are suitable for arranging olive groves from the aspect of topoclimatic factors (Tab. 4; Fig. 5). Altitude and exposure stand out as the main limiting factors. Larger continuous areas which are suitable for olive growing are as follows: littoral hills in the hinterlands of Izola and Piran, where olives are indeed most numerous today, the Muggia peninsula, slopes above the right banks of Rižana R., the Badaševica R. and the Dragonja R., and sunny slopes under the karstic step of Črni Kal. Suitable Less suitable Area (sq km) Percentage (%) Area (sq km) Percentage (%) Altitude (up to 250 m a.s.l.) Concave forms Inclination (up to 37 ) Exposure ( ) Outcome Tab. 4: Suitability of Slovenian Istria for olive growing as to topoclimatic factors Fig. 5: Areas in Slovenian Istria with favourable topoclimatic conditions for olive growing 5. Conclusions Olive growing in Slovenian Istria is a traditional branch of economy which strongly depends on climatic conditions, primarily on periodical frosts. Olive growers are sometimes insufficiently aware of the benefits and prospects and even less of the risks of growing this crop. Therefore, it is not needless to emphasize again the danger of frosts, especially because it is traditionally said that the recurrence period of stronger frosts is years. However, the data for the 20 th century which is considered to have been relatively warm, prove that frosts can be more frequent. Namely, their average recurrent period was 20 years. In colder periods, such as the 18 th century was, frosts were even more frequent: their recurrence period was as short as years. At first sight, olive growing in the last decades was also stimulated by climatic trends and forecasts for the 21 st century are optimistic, too. According to several prognoses the climate in our area is expected to warm up, especially in winter, by C. This means theoretically that the growing season will be longer and temperature conditions for more demanding crops including olives will be more favourable. But the same prognoses also warn about an increased 39
42 Moravian geographical Reports 3/2007, Vol. 15 possibility of extreme weather events including frosts. A combination of both might be unfavourable for olive trees because the most bitter frosts in the 20 th century occurred precisely in those years when the growing season was prolonged due to autumns and winters with temperatures above average, with olives unprepared when cold air broke in. In view of these facts, the spreading of olives should be planned very cautiously in the future, regardless of current climatic trends and forecasts, and should be kept in the historically tested areas and locations. In the opposite case, the risk of frost damage might be even greater. The analysis of topoclimatic conditions for olive growing in Slovenian Istria showed that within the existing and historically tested area of olive trees, there still remain enough plots suitable for spreading this crop. About 8,000 hectares were established as suitable for olive trees. If urbanized areas and those occupied by other crops, protective forests, protected landscapes, etc. are deduced, more than 3,000 hectares remain available for olive growing, which means that the current areas could at least double. References: Arhiv Urada za meteorologijo ARSO, Klimatski podatki za Koper, Portorož in Kubed za obdobje (ARSO Archives of the Office of Meteorology; Climatic data of Koper, Portorož and Kubed in the period.). BRAUN, G. (1935): Notizie meteorologiche e climatologiche della regione Giulia. Consilio Nazionale della Ricercha, Comitato Nazionale per la Geografia, Roma, 80 pp. Digitalni model Slovenije 100 x 100 m (Elevetion model of Slovenia 100 x 100 m) (DMNV 100), Geodetska uprava Republike Slovenije. EASTMAN, J.R. (2001): IDRISI 32, ver. 2, Clarc University, Worcecter. HOČEVAR, A. (1980): Razporeditev potenciala sončne energije v Sloveniji, Parts I. and II., elaborate report, BF VTOZD za agronomijo, Ljubljana. OGRIN, D. (1994): Modern Age Climatic Fluctuations in the Area of the Gulf of Trieste. Geografski zbornik 34, Ljubljana, p OGRIN, D. (1995): Podnebje Slovenske Istre. Knjižnica Annales 11, Koper, 381 pp. OGRIN, D. (1997): Ob pozebi oljk v Slovenski Istri decembra Ujma 11, Ljubljana, p OGRIN, D. (2004): Oljka v Slovenskem primorju. Geografski obzornik 51-2, Ljubljana, p Razvoj pridelovanja in predelave oljk na območju Kopra, Izole in Pirana. Elaborate report for the needs of the project entitled Razvoj proizvodnje in predelave oljk v Jugoslaviji, Ljubljana, SANCIN, V. (1990): Velika knjiga o oljki. Trst, 319 pp. VESEL, V. (1996): Oljkarstvo v Sloveniji. Sodobno kmetijstvo, 29-9, Ljubljana, p VESEL, V. (1998): Oljkarstvo v Slovenski Istri. Glasnik ZRS Koper, Anno 3, No. 5, Koper, p VESEL, V., SEDMAK, D. (1990): Oljkarstvo v Slovenski Istri. Sad, 1-12, Ljubljana. VYSOUDIL, M. (1993): Topoclimatic Mapping in Central Moravia. Geografski vestnik 65, Ljubljana, p Author s address: Darko OGRIN, PhD. Department of Geography, Faculty of Arts Aškerčeva 2, 1000 Ljubljana, Slovenia Darko.Ogrin@ff.uni-lj.si Reviewer: RNDr. Ing. Jaroslav ROŽNOVSKÝ, CSc. 40
43 Vol. 15, 3/2007 Moravian geographical Reports RUNOFF MODELLING AND ITS SPATIAL VARIABILITY IN DEPENDENCE ON LAND USE Abstract Milan TRIZNA The first section of this article presents a brief overview of contributions by different authors on the runoff problematic, stressing direct runoff as one of the components of total runoff. Specific attention is paid to modelling runoff, stressing geographically-oriented rainfall-runoff models. The second part of the article deals with simulations of various rainfall-runoff events in selected drainage basins in the territory of Slovakia. The Agricultural Non-Point Source Pollution Model (AGNPS) was used for some of the basins, while other basins were modelled by the CN-curve method, an internal part of many models including AGNPS. Possible applications of this methodological procedure in land-use planning practice are then suggested. Shrnutí Modelování odtoku a jeho prostorové variability v závislosti na využívání krajiny Tuto úvodní studii je možno rozdělit na dvě základní části. První část přináší stručný přehled stanovisek různých autorů na tuto problematiku, přičemž zdůrazňuje, že přímý povrchový odtok vody je jednou z komponent celkového odtoku. Dostatek pozornosti je věnován modelování odtoku s důrazem na geograficky orientované modely srážek a odtoku. Druhá část studie se zabývá simulací nejrůznějších případů dešťových srážek a jejich odtoku ve vybraných povodích na území Slovenska. Pro některá povodí bylo použito Modelu zemědělského nebodového zdroje znečištění (Agricultural Non-Point Source Pollution Model AGNPS), jiná povodí byla modelována pomocí metody CN-křivky, která je interní součástí mnoha modelů včetně AGNPS. Doporučení týkající se aplikace tohoto metodického postupu v praktickém plánování využití krajiny jsou uvedeny v závěru studie. Keywords: rainfall-runoff situation, SCS Curve Number Method, direct runoff 1. Introduction The knowledge of rainfall-runoff relations occurring in the landscape represents one of the most important tasks of modern hydrology today. All relevant processes being the result of these relations exercise an indispensable influence on the landscape, both its natural and cultural parts. In connection with the increasing pressure on intensive land use many natural processes have become hazards for human activities in the landscape while the degree of the hazards, land use and its intensity make it possible to assess the degree of natural risks. At present, runoff is definitely one such hazards, particularly in relation to the increased occurrence of the extreme runoff events of flood character that more or less affect vast areas of Central Europe every year. Large-scale regional floods comparable with those in Moravia in 1997 or in Bohemia in 2002 have so far avoided the territory of Slovakia. However, since 1992 flood events of a local character (Trizna, 1999) have been occurring as a result of the combination of a number of local factors: extreme rainfall events, morphometric and basin soil substratum parameters and land use. These sudden, so-called flash floods often have devastating effect on natural components and human activities in the landscape. Extreme runoff events of this type are quite difficult to predict; they occur in both small and larger basins that often lack hydrological observation and rain gauge stations. Therefore, classic hydrological methods based on the statistic analysis of measured data cannot be used nor the methods of hydrologic analogy which are limited in these cases as well (affected basins are often isolated, the very adjoining basin does not necessarily have to record any precipitation nor extreme runoff, in some cases just a part of a basin is affected or the runoff wave is small). The issue is a subject of interest to geographers also because the mentioned processes are influenced by important factors of land cover and land use. Contemporary landscape ecology and land-use planning 41
44 Moravian geographical Reports 3/2007, Vol. 15 practice lack well-proven methodological procedures allowing to assess the suitability/unsuitability of land use in terms of its impact on the runoff formation. We suppose that a suitable tool for the identification of relations between the individual components of runoff generating processes is represented by geographically oriented rainfall-runoff models. Modelling techniques have considerably improved with the dynamic development of computer science, however, other tools of geographic research have emerged - geographic information systems (GIS) whose possibilities of spatial analysis and modelling, recording of the dynamics of natural processes and mutual relations between landscape components have made them an irreplaceable tool in the hydrogeographic research. The presented study brings in the first part a brief overview of the standpoints of different authors on runoff creation in the drainage basin and than in the second part it deals with the assessment of land use impact on the runoff spatial variability by means of modelling the rainfall-runoff processes and by geographic information systems. No concrete model was used but rather a separate method of SCS CN-curves with some modifications based on the knowledge of geographic reality. The presented results originate from a number of studied basins of different landscape types and demonstrate a possibility for the utilization of the methodology in the whole basin or just in its (small) part. Important outputs are simulations of various land use changes and their influence on runoff height and spatial variability. 2. Runoff formation in drainage basin and its modelling Views on what happens in a basin after heavy rainfall or snowmelt have developed since the beginning of the last century. Acknowledged comprehensive theory, sometimes called infiltration theory or theory of surface runoff, was elaborated by Horton. According to this theory, a flood wave contains water from causative rainfall (or snowmelt) a significant part of which entered the stream as surface runoff. Horton introduced a term infiltration capacity by which he understood the amount of water that soil is able to absorb under given conditions. According to the original concept, surface runoff from a basin occurs in the whole basin area after the infiltration capacity of soil, which however is not in a state of saturation, has been exceeded. Horton s theory was generally accepted for a few tens of years and under certain environment conditions it really works in runoff processes. However, further field measurements and laboratory experiments brought knowledge that the intensity of rainfall or snowmelt in small forested basins of temperate region is rarely high enough to be able to exceed the soil infiltration capacity. Hewlet (1961) pointed out that soil moisture is an important source of water which can contribute to the basic runoff especially in mountain basins. In these conditions, water-bearing layers occur only in small areas along larger superficial streams. From this he deduced that water from the saturated zone cannot be the main source of stream water supply during dry periods. Laboratory experiments showed that during the seepage of water from a rainfall event the water that was present in the soil prior to the rainfall event is expelled. The ejection occurs namely in the lower and middle parts of the slope while in the uppermost part of the slope the new water results in increased soil moisture which slowly moves to lower situated areas. Hermann (1997) presents an overview of methods and results of the research on runoff origin. Comparison of the methods and results proved that the runoff for the duration of rainfall or snowmelt flood wave in most of the studied cases predominantly contained water which had been present in the basin before the event. Similar results were recorded also in the mountain basin of the Jalovecký potok Brook in an experimental hydrological base of the Institute of Hydrology, Slovak Academy of Science (Hlavčová, Holko, Szolgay, 2001). Concurrently with Horton, Lowdermilk (1934), Hursh (1936) and Hursh and Brater (1944) found that the movement of subsurface water represented one of the components of hydrographs of storm runoff in humid areas. Roessel (1950) recorded dynamic changes in underground water runoff on both sides of the stream. Based on studies made by Hewlett (1961), Nielsen (1959), Remson (1960) and others there is a currently recognized fact that water reserves from unsaturated zones can contribute to runoff from saturated zones constituting in this way total basin runoff. Since 1940, this theory has culminated into the present form of the subsurface runoff mechanism and it has become a part of the more integrated understanding of the runoff formation. One of the first attempts to develop the theory of infiltration was the work by Green and Ampt (1911) who, using simplified principles of physics, derived a formula still used for the calculation of infiltration capacity rate. Certain equations of Kostiakov (1932) and Horton (1933, 1935, 1939, 1940) are also used in some current drainage basin models. Studies describing the lake evaporation were made by Richardson (1931) and Cummings (1935), while Thornthwaite (1948) and Pennman (1948) contributed with important comments on the evapotranspiration models. 42
45 Vol. 15, 3/2007 Moravian geographical Reports Other tendencies comprised the quantification of components such as interception, surface accumulation and retention accumulation. Horton (1919) derived a series of empirical equations to determine interception during a storm upon various types of the vegetation cover. In 1956, Soil Conservation Service (SCS) developed a SCS Curve Number Method to calculate the amount of storm runoff while considering individual components. Although the method was originally developed to make a model of the daily runoff as influenced by land use it was and is still used for infiltration modelling and as a runoff hydrograph for continuous hydrologic simulation. In the past, the mathematical modelling of runoff formation primarily dealt with the modelling of total basin runoff and particularly flood runoff while models with the so-called space-centred parameters were preferred. These models do not explicitly distinguish the space variability of hydrological processes. While simulating the mechanisms of runoff formation they consider the basins as homogeneous units and resolve hydrological balance only vertically, proceeding from the rainfall and water reserve formation in basins to runoff. The mathematical description of hydrological processes uses common differential equations and empirical relations. A limiting factor for the use of models with centred parameters models is the fact that these models do not always adequately represent the influence of space variability of the runoff source areas in the basin on the runoff course. A possible effort to avoid the disadvantage by adding other parameters increases the number of model freedom degrees and the uncertainty of parameter values upon their calibration only on the basis of commonly used comparison of the calculated and the observed runoff. The change of the society s relationship to environment connected with the change of water management into integrated water management and integrated management of the whole basin have drawn attention to how rainfall or snowmelt water including substances transported in it get into streams. Support to the process-oriented research in hydrology increased, which helped to considerably deepen the knowledge of processes occurring on slopes in small basins in several last tens of years. The mathematical runoff modelling has endorsed spatially differentiated simulation of all processes of water movement in the basin. Theoretical and experimental hydrological procedures and results of different disciplines such as hydrometeorolgy, hydrology, hydrodynamics of porous environment, groundwater and stream hydraulics and geoinformatics are integrating into complex mathematical models of water processes in basins. The models which are sometimes called models with spatially distributed parameters are based on the solution of partial differential equations. In these models, the space variability of physiogeographic features of basins is commonly expressed by means of small homogeneous space units (most often squares, so-called grids). In a grid network, partial differential equations are resolved by numerical methods (e.g. Richards equation for water movement in unsaturated zone, kinematic wave equation for water movement over the basin surface, Saint-Venantov s equation for water movement in stream channels etc.). Practical usability of such models is sometimes limited (due to unavailability of necessary input data and measured values of environment parameters) also by the inadequacy of equations for different conditions of runoff formation. The models are criticized also with respect to the theory of gauges (e.g. the question how to correctly extrapolate the measured, mostly point values of environment parameters to quantities representing their values for the whole grid). In practice there are also problems with the stability and convergence of numerical schemes. Therefore, as a compromise, models with so-called semidistributed parameters are introduced to simplify the representation of space variability of the environment in models in such a way that they focus on the dominant mechanisms of runoff generation (e.g. surface runoff due to subsoil saturation along the streams), using larger homogeneous spatial units (e.g. so-called hydrotops). Various ways of the runoff formation and their combinations are difficult to be taken into account in existing models containing especially standard classic equations and environment parameters such as gradient, porosity or grain size curve. Thence, many new interesting models are emerging, some of which have not yet crossed the threshold of practical applicability (Faeh et al., 1997). 2.1 Basin modelling and hydrology Basin hydrology is defined as a branch of hydrology dealing with the integration of hydrological processes in a basin, which determine the basin reactions. Irrespective of basin size, determinating are the hydrological processes defined by climatic parameters (rainfall), relief morphometry, soil substratum complex, vegetation and land use. Also, the diversity of hydrological processes tightly connects to the basin size. The task of mathematical models of basin hydrology is to answer fundamental questions of hydrology on the basis of detailed problem research. The models are used in a wide range of spheres - from basin management to engineering design (Singh, 1995). They are used in planning, conceptions and management of water and soil protection projects. At local level hydrological models are used for different purposes such as planning and concepts of soil protection and irrigation systems, wetland and stream restoration and control of fresh water consumption. On a large scale, they are used in 43
46 Moravian geographical Reports 3/2007, Vol. 15 flood control projects, in the reconstruction of obsolete water reservoirs, flood area management, water quality evaluation and prognosis connected with water resources. Basin models are important in the evaluation, development and management of water reserves. They are used e.g. in the analysis of runoff quantity and quality, reservoir system management, protection and development of groundwater reserves, management of surface water and groundwater, water distribution systems, water utilization, etc. (Wurbs, 1998). Basin models are developed for a better understanding of dynamic interactions between climate and surface hydrology. Vegetation, snow cover, permafrost layer etc. are sensitive to the lower boundary of the atmosphere. Water and heat transfer between the Earth s surface and the atmosphere considerably affects hydrological characteristics and outputs (Kavvas et al., 1998). The beginnings of mathematical modelling date back to a rational method developed by Mulvany (1850) and the model of an event by Imbeau (1892) who related the peak runoff and the rainfall intensity. Four decades later, Sherman (1932) presented his concept of a unit hydrograph which out into relation the direct runoff response with excessive rain. At the same time Horton (1933) developed his infiltration theory which enabled to determine rainfall excess and improved a hydrograph separation technique. Horton studied the surface runoff and created a semi-empirical equation. Based on the theoretical research of surface runoff Keulegan (1944) concluded that it would be suitable to simplify the equations into a form of currently known kinematic wave. In 1945, Horton developed a concept of the development of relief erosion forms and runoff formation with the emphasis on the surface runoff. Digital revolution in the 1960s facilitated the integration of models of various components of the hydrological cycle as well as the whole basin simulation. First attempt to model the whole basin was a seminary paper Standard Watershed Model (SWM) by Crawford and Linsley (1966). At the same time some other, less extensive, models were developed. Similarly, many models with semi-distributed parameters able to deal with the spatial variability of hydrological processes within a basin were developed. Since the development of SWM the watershed hydrology models have recorded a great boom with the emphasis of models with a physical basis. Examples of such models are SWMM, PRMS, NWS, River Forecast System, SSARR, Systeme Hydrologique Europeen (SHE), TOPMODEL, IHDM, etc. There is a large number of models currently used round the world. These models differ significantly in the model construct of each partial process, partly because the purposes of each of these models are different. The NWS model is a standard model used for flood forecasting, the HSPF model and its extended water quality model are used in environmental projects. The MMS and USGS models are used for water reserves planning and management works. The UBC and WATFLOOD models are used for hydrological modelling namely in Canada while the RORB and WBN models are used in Australia. The TOPMODEL and SHE models are standard models in European countries while the Xinanjiang model is used in China and the Tank models in Japan (Singh, Woolhiser, 2002). Runoff simulation in some of the studied basins was carried out by an AGNPS model (Agricultural Nonpoint Pollution Model) a model working with spatially distributed parameters. This model was developed for the evaluation of water quality affected by erosion caused by agriculture and by urbanized areas (Young et al., 1987). The AGNPS model is adapted to perform its functions at a level of basin and it consists of three main components (submodules): 1. hydrological module, 2. soil erosion submodule, 3. submodule of pollution by various elements. Hydrological function enables prediction of the runoff volume and peak discharge. Soil erosion function includes erosion and sedimentation processing. Pollution function analyses the concentration of nitrogen, phosphorus and chemical oxygen in outflowing water and sediments. The modelling requires 22 input parameters that involve: digital elevation model (DEM), orientation and gradients of basin slopes, soil types, land use and information on point sources. The model provides outputs in grid network both for real and hypothetical events. The latest version of the AGNPS model is a highly efficient continual model capable to automatize a number of steps for the input data preparation. It closely cooperates with the software packages of ArcView and GRASS. However, while processing parameters in this model some of its geographical limits were revealed. Despite the fact that the slope gradient parameter is set up, the model does not work with the real grid area (e.g. 100 x 100 m) depending on the relief gradient, which can cause considerable deviations in case of a more rugged basin. Similarly, the grid itself gradually became a limiting factor and therefore another solution was looked for. Finally, it was discovered in the combination of GIS ArcView and the SCS CN-curve method. 44
47 Vol. 15, 3/2007 Moravian geographical Reports 2.2 Spatial aspect in hydrological models Spatial scale largely influences the model choice. Hydrological variables change in space. Spatial heterogeneity of basin reaction is caused by three factors: variabilities, discontinuities and processes. Spatial variabilities create a space-time continuum in climatic and hydrometeorologic inputs, soil characteristics, morphometry and land use. Basin runoff is the result of the combination of these three factors. Discontinuities create boundaries determining soil types, geologic formations or land cover. Physical characteristics control interception, surface retention, infiltration, surface runoff and evapotranspiration to various extents; subsequently these processes control the runoff. It was empirically proven that the form of a hydrological reaction changes with a spatial extent of heterogeneities (Dooge, 1981). In case the spatial extent expands from a single point to larger areas, the process of runoff formation becomes less sensitive to temporary rainfall fluctuations or spatial variances of soil characteristics, which is a consequence of generalization and averaging. It is important to determine a minimum spatial extent of elementary sections to be used in modelling in such a way that they could adequately represent the basin spatial heterogeneity being at the same time of high declarative value. Basins are usually divided into smaller representative units and subsequently a hydrological model is calibrated. Nevertheless, the exact concept of physical heterogeneity determination and compliance does not exist yet and the division process is often affected by data availability rather than by real physical characteristics. Another important factor comprises the time scale of model outputs which extremely influences the model type and details involved; for example, a model with the monthly outputs is in its structure and production different from a model with the hourly outputs (e.g. CASC2D). Various methods of simplifying geometric and other characteristics of basins can be divided into grid and conceptual methods (Singh, 1996). The both methods subdivide basins into subareas linked by routing elements. A grid method aims at a creation of model runoff patterns similar to those in the basin prototype response. This concept was introduced by Bernard (1937). Surkan (1947) developed a computer algorithm for the numerical coding of natural geometry on a rectangular grid. These days, different types of grid structures are used, depending on the numerical scheme of a model (see Fig. 4). Conceptual methods represent the basin geometry using a network of elementary sections while each section represents a certain part of the basin. These parts can be arranged to provide a detailed representation of topographic characteristics of the basin, regardless of its geometric complexity (see Fig. 5). 2.3 Impacts of the spatial variability of environment parameters upon runoff and their representation in models Hydraulic roughness Various surfaces with different degrees of roughness record the formation of so-called kinematic shocks. Using a variogram analysis Lehrsch (1987) determined eight roughness indices based on the spatial variability. Errors resulting from differences in hydraulic roughness had to be analysed and solved in basin modelling. Solution in some models comprises the application of a uniform roughness index within the whole basin. Another method uses the smoothed coefficients of hydraulic roughness. Infiltration Spatial variability of infiltration affects the surface runoff, depending on the rainfall amount and on other characteristics of the basin. The spatial heterogeneity of soil types and the depth of rainfall intrusion cause decreased cumulative infiltration but increased surface runoff. The modelling brought evident differences in the quantity of infiltration provided that average soil characteristics were used instead of characteristics considering the spatial heterogeneity. Peak discharge and runoff volume are generally higher when the spatially distributed parameters of soil hydraulic conductivity are used rather than when the uniform parameters are used. Therefore, Smith (1990) incorporated the factor of the spatial variability of saturated soil hydraulic conductivity into the infiltration model. This method is used in many models. Rainfall In addition to the spatial variability of rainfall, the runoff is affected by its temporal variability. The motion and direction as well as the speed of cyclones affect the shape, peak, time of reaching the peak and other characteristics of the runoff hydrograph. The direction of cyclone motion can increase or decrease the flood wave peak and change the hydrograph degression. Stephenson (1984) attempted to simulate the runoff hydrographs of a storm moving in the stream (basin) direction. An important factor of rainfall spatial variability that affects runoff is the elevation gradient. Depending on the basin elevation gradient uniform rainfall characteristics or spatially distributed characteristics can be used in modelling. The effect of using uniform characteristics in basins with a small elevation gradient is negligible whereas in basins with 45
48 Moravian geographical Reports 3/2007, Vol. 15 a high elevation gradient the use of these characteristics can decrease the modelled runoff to the half of actual runoff. According to Horton, the effect of rainfall spatial variability is very distinctive even in small-area basins. It generally holds that a rainfall discontinual in time creates larger peak flows than a continual rainfall. Ball (1994) studied ten different rainfall situations with the first one being a continuous rainfall event. The concentration time changed for the selected basins in the individual situations. Compared with the continual-rainfall situation, the peaks of the other events in hydrographs occurred earlier and were of different shapes (Singh and Woolisher, 2002). 3. Direct runoff and the method of SCS Curve Number Direct runoff is that part of rainfall water entering surface streams already during rainfall or snowmelt or immediately after the rainfall/snowmelt termination. Direct runoff causes extreme, often flood runoff events, i.e. temporary extensive increase of stream level induced by a sudden increase of discharge. The significance and importance of studying the direct runoff follows out also from the fact that it is a component most variable in time and values of the total runoff, which is responsible for the heaviest damage to environment (soil erosion, floods, water pollution, destruction of buildings, etc.). At the same time, direct runoff is most affected by human activity. In the solution of practical tasks the direct runoff is identified with the surface runoff of precipitation water while the hypodermic (subsurface) runoff is not considered individually (Antal, 1999). In terms of environment use and protection direct runoff characteristics are divided into: hydraulic (speed, circumferential stress and force of outflowing surface water) hydrological (maximum discharge, maximum specific surface runoff) agrohydrological (volume and height of direct runoff from the studied area induced by a certain rainfall, coefficient of surface runoff volume, coefficient of atmospheric rainfall utilization and coefficient of rainfall infiltration). 3.1 The method of Runoff Curve Numbers The method of Runoff Curve Numbers (CN Method) was developed in Soil Conservation Service in the USA and it was derived from multiyear studies of runoff from agriculturally used basins. That is why even input data for the surface runoff calculation according to the CN Method characterize in detail, except hydrological conditions, also the land use. CN value is determined in the range of 0 to 100 while CN = 100 means that all rainfall water entering the basin or its part flows off as surface runoff and CN = 0 means that all rainfall water infiltrates into the soil (Antal, 1999). The use of CN-methods requires the knowledge of: 1. hydrological characteristics of soil properties in a basin (Tab. 1) 2. hydrological characteristics of land cover (mostly determined on the basis of land use within a basin Tab. 2) 3. hydrological characteristics of individual methods of land management (Tab. 2) 4. hydrological characteristics of soil moisture regime (determination of the antecedent precipitation index). Soil category Infiltration and drainage properties of soils Characteristic soil types A Soils with high infiltration rate even when thoroughly wetted Deep sands and gravels B Soils with moderate infiltration rates when thoroughly wetted and with good permeability Moderately deep to deep sandy and sandy loam soils C Soils with low infiltration rates when thoroughly wetted and low permeability Clay loam to shallow clay soils Soils with very low infiltration rates when thoroughly wetted D and without permeability Tab. 1: Hydrological soil categories for the CN-method Clays or soils with otherwise limited permeability and infiltration ability CN values for hydrological characteristic of individual elementary basins were determined according to a table in the study of Ven Te Chow (1964) while these values were determined for a concrete rain. The calculation of direct runoff or direct runoff volume was preceded by some other partial calculations. It is necessary to start from the relation (1) for the calculation of potential retention A: (1) where the CN value is taken over from Tab. 2. Subsequently, the calculated potential retention A (mm) enters the equation for the calculation of the height of direct runoff from the basin or elementary basins (2). (2) 46
49 Vol. 15, 3/2007 Moravian geographical Reports where H 0 is the direct runoff height (mm) induced by the given rain, H Z is the given rain height (mm) and A is the potential retention (mm) calculated on the basis of relation (1). The resulting runoff value is calculated on the basis of relation (3): (3) where O is the runoff volume (in km 3 or m 3 ), H 0 is the area direct runoff height (from relation 2), S is the actual The parameter of actual area is not a standard parameter. It was introduced to consider an important factor of runoff formation - relief gradient. The area of individual elementary basins (S) was determined by means of ArcView GIS. This area is, however, area (in km 2 or m 2 ) and k P is the conversion coefficient (k P = 1000). representation of the projection of actual area into a plane which is, in comparison with the actual area (S ), smaller. S value was determined on the basis of the ratio of k S areas by means of relations (4, 5). (4) (5) Then the actual area value S is as follows (6): (6) where is the value of average gradient of a basin or an elementary basin. Hydrological Characteristics of Land Use Soil Properties Land Management Land Cover A B C D Fallow land bad in direct rows in direct rows bad good Wide-row crops along the contour line bad along the contour line good terracing terracing bad good Narrow-row crops Fodder crops on arable land, Temporary meadows Pastures Meadows, permanent meadows Forests in direct rows in direct rows along the contour line along the contour line terracing terracing in direct rows in direct rows along the contour line along the contour line terracing terracing undefined along the contour line bad good bad good bad good bad good bad good bad good bad average good bad average good good bad average good Settlements undefined Stabilized roads undefined Unstabilized roads undefined Tab. 2: Average values of CN-curves for specific land uses depending on land management Source: Ven Te Chow (1964) Note: A more detailed description of hydrological characteristics of land cover is given in the work of Antal (1999)
50 Moravian geographical Reports 3/2007, Vol. 15 The method has often been modified and subjected to critical comments. Hjelmfelt (1992) suggests to consider the CN-curve numbers as stochastic invariables. Hawkins and Ponce (1996) point out numerous problems related to the determination of concrete CN-curves values and values of the index of antecedent basin saturation. Walter and Shaw (2005) present the need of a new, more accurate and physically oriented model which would substitute the used procedures of the CN- Curves Method. These days, the method of CN-Curves is constantly given precision and it is implemented in the hydrological sphere all around the world, particularly in the USA and countries of eastern and south-eastern Asia (Shrestha, 2003) where it is often adapted to local physical geographic conditions and new optimalization procedures are investigated for the precision of simulation results (Huang, 2005). In Slovak scientific literature the issue of runoff modelling by means of the CN-Curves Method is dealt with in a number of publications. In addition to works principally dealing with the conception models (Pekárková et al., 1998, 1999), the mathematical-statistic apparatus is in details described in a publication by Antal (1999). CN-curve modelling has become a topic of many diploma theses (Hollová, 2004) as well as PhD theses (Bača, 2003). 4. Land use and the spatial gariability of runoff in selected basins In the above presented parts of our study we have introduced theoretical starting points and a methodological procedure of the analysis of runoff spatial variability in dependence on land use. In the following parts of our study our attention will be paid to the application of described approaches in chosen basins in the territory of Slovakia. Modelling of the runoff volume during a certain rainfall event in dependence on the land use was our aim. It is necessary to stress the fact that the simulation of rainfall-runoff processes for individual basins and land use types was preceded by thorough calibration on the basis of the actually measured values of rainfall amounts and peak discharges for the individual rainfall-runoff situations. The number of situations was 3 6, depending on the availability of suitable data from the respective basins. Subsequently, runoff volumes, representing basic output with regard to the aim of the study, were derived from the values of peak discharges. With regard to the extent of the study no other detailed attention is paid to the calibration issues. The issue of calibration concerning some selected basins has been extended upon in some previous studies (e.g. Trizna, Kyzek, 2002). 4.1 Selected basins and their basic characteristics The selection of basins was adapted for the purposes of this study in order to obtain information on the effect of land cover and land use changes on runoff spatial variability in different landscape types for which the chosen land use types can be declared characteristic. On the other hand, some basins lacked sufficiently long series of observation, information on rainfall amounts etc. Tab. 3 contains the basic hydrographic and hydrological parameters of selected basins. The location of individual basins in the territory of Slovakia is shown in Fig. 1. Fig. 1: Map of studied basins on the territory of Slovakia 48
51 Vol. 15, 3/2007 Moravian geographical Reports Stream Qa Elevation (m a. s. l.) Stream Station length Basin area (km2) (km) (m 3.s -1 ) min max Kľak * Žarnovica Teplička * Trenčianske Teplice Necpalský potok * Necpaly Revúca Podsuchá Rajčianka Závodie Jalovecký potok Liptovská Ondrášová Boca Kráľova Lehota * Water courses measured within the AGNPS model Tab. 3: Hydrographic and hydrological parameters of selected basins Except for data presented in Tab. 3 the selected basins differ in the variability of land cover and land use. Figures 2 and 3 show the differences in land cover and land use in two specific basins. Fig. 2: Land cover in the Revúca River basin 49

52 Moravian geographical Reports 3/2007, Vol. 15 A grid was used in the case of marked basins processed by an AGNPS model while geographic units e.g. elementary basins or microbasins were used for internal division in the other basins. Automatic delimitation of elementary basins was attempted by means of GRASS software application in Jalovecký potok Brook. In the other basins the division was carried out using digitalization in compliance with the distribution of contour lines. Fig. 4 shows a grid used in the basin of Kl ak River while Fig. 5 shows elementary basins delimitated in the basin of Revúca River. Fig. 3: Land cover in the Rajčianka River basin With regard to the need of input data for the Method of CN-Curves, groundworks on soil types were prepared for each basin (see Fig. 6 the Boca River) together with an elementary morphometric analysis of the basins (see Fig. 7 - the Necpalský potok Brook relief gradient) which was used especially for the determination of the actual area of elementary basins. An important input parameter requiring a maximum attention is rainfall. Available for all selected basins and for all runoff events was a so-called causative rainfall, i.e. rainfall immediately preceding the runoff event, in fact provoking the event. Input values of rainfall amounts were gradually improved with a gradual perfection of modelling, simulation and calibration. Simple interpolation methods were exchanged for automatic interpolation in ArcView GIS and a single value of rainfall amount for the whole basin (for an AGNPS model) was replaced by vertically and horizontally differentiated values of rainfall amounts as result of the influence of other physical geographic factors. The most accurate rainfall was calculated in the basin of Jalovecký potok Brook using regression equations taken over from studies of Kostka, Holko (2001) and in the basin of Boca River using ArcView GIS (Fig. 8). 50

53 Vol. 15, 3/2007 Moravian geographical Reports 4.2 Simulation of runoff response to the changes of land cover and land use As stated above, after the completion of all input parameters rainfall-runoff situations were modelled in selected basins stressing the height of direct runoff caused by causative rainfall. Figures 9 and 10 show a sample of the basin of Revúca River modelled in this way. Fig. 4: Grid of source data cells in the Kl ak River basin After each calibration a few simulations were carried out with the aim to find out basin runoff response either to the change of the rainfall input value with unchanged land cover and land use or to the land cover change with unchanged rainfall amount. The base of all given simulations was the modification of CN-curve values for individual rainfall-runoff situations in selected basins. Particular care was taken so that the same values of CN-curves were used for calibration in a concrete basin for all the studied situations, by which the process of calibration was made objective. Results obtained on the basis of the used values of CNcurves can be generalized. In all the cases we started from the values of CN-curves given in Tab. 2. CN-curve values used in individual basins exerting maximum conformity between model and actually measured values differ minimally. Therefore, values for the basin of Revúca River are given in Tab. 4 as model values. Land Use B Soil Type Settlement (urban structure; industrial, commercial and transport units; extraction, dump and construction sites) Fodder crops on arable land, temporary meadows (arable land, agricultural areas with natural vegetation) Meadows, permanent grass cover (pastures) Meadows, permanent grass cover (scrub and herbaceous associations) Meadows, permanent grass cover (Artificial, non-agricultural green areas) Discontinuous grass cover, scrub Forest (forests) Tab. 4: Values of CN-curves for the specific land use (following modification) C 51


54 Moravian geographical Reports 3/2007, Vol. 15 Fig. 5: Elementary basins within the Revúca River basin In the Kl ak River basin we focused on the simulation of rainfall-runoff event with regard to marginal conditions of the AGNPS model. Comparing the runoff volume values (simulation of actual conditions) and the runoff volume values with a minimum preceding basin saturation, the resulting value was 0.36, i.e. that the same total precipitation would result in a direct runoff volume at 0.36 of the actual volume at a minimum preceding watering. Conversely, if the range specification was made with the maximum values of the previous watering, the coefficient would reach the value of Fig. 6: Soil types in the Boca River basin 52

55 Vol. 15, 3/2007 Moravian geographical Reports In the case of Teplička River basin possibilities were tested of an AGNPS model simulating double rainfall amount while preserving the same length of duration. Depending on the previous basin watering the runoff volume value changed and with the maximum saturation it reached expected extreme values that are connected with higher rain intensity. Fig. 7: Relief gradient in the Necpalský potok Brook basin The simulation of land cover change was used in this basin for the very first time. In the first case the whole basin was forested fictitiously while in the other case the forest growth was substituted by the category of discontinuous grass cover, scrub. As expected, the model reacted only partially because with total basin deforestation the runoff volume value increased by as little as 5.13%. Simulated forestation caused the decrease of the runoff volume by 34%. However, the minimum decrease in the case of deforestation is not so surprising in its final consequence. It is connected with the interception properties of both original forest growth and substitute growth which do not largely differ. N mm mm mm mm mm mm mm mm Km Fig. 8: Rainfall amount causative precipitation in the Revúca River basin 53

56 Moravian geographical Reports 3/2007, Vol. 15 The same procedure was applied in the basin simulation of the Necpalský potok Brook. This time, the forested area was substituted by the category of meadows, permanent grass cover. As a result, the runoff volume increased and it reached the value of % in comparison with the basin of Teplička River. After the forestation of the whole territory the runoff value slightly decreased (by 2.3%), which is related to the total basin area to which this simulated change could be applied. Fig. 9: Spatial variability of the runoff volume in the Revúca River basin Simulations carried out in the basins of Revúca and Rajčianka rivers will not be paid any other detailed attention because they are dealt with in the study by Gajdošík, Šulík, and Trizna (2005). So far the simulation potential of the last two studied basins has not been used fully. In the case of the Jalovecký potok Brook, the attention was focused on a maximum conformity of measured and calibrated direct runoff values with the intention to use this basin as an analogy for adjoining basins lying in the same physical geographic conditions and affected by dramatic rainfallrunoff events over the past years (e.g. Smrečianka River basin in 2004). 54


57 Vol. 15, 3/2007 Moravian geographical Reports The Boca River basin was struck by a windstorm in November 2004, which distinctively affected the area of the High Tatras but also other Slovakian ranges. The affected area of Boca River basin is shown in Fig. 11. There was a need for land cover change after the territory covered by spruce monocultures aged years had been affected by a vast disaster. Therefore, the first simulation of the runoff change from this area was accomplished with the intention to carry out regular assessments of simulated and actually measured values. During the simulation the runoff volume increased by 6.2%. Potential change of actually measured values will remain under observation. Fig. 10: Runoff hydrograph and causative rainfall in the Revúca River basin Fig. 11: Area in the Boca River basin, affected by a windstorm in
58 Moravian geographical Reports 3/2007, Vol Discussion and conclusion The modelling of rainfall-runoff relations is currently one of the most important tasks for hydrology. It also follows from the fact that the hydrological response of basin to a rainfall event closely relates to the physical geographic parameters and land use of the basin. A space for closer linking of hydrological models with geographical information systems (GIS) is opening here. In the first part of the contribution we brought an overview of opinions on various aspects of the hydrological modelling, in the second part several conclusions from simulations of runoff in chosen basins in Slovakia were generalized. The study is opened to discussion about possibilities of rainfall-runoff modelling with respect to practical use, i.e. in solving actual hydrological tasks. Adamec et al. (2007) bring a relatively complete overview of modelling tools for various purposes of the hydrological practice. We can identify with the authors idea that hydrological models may be divided into rainfall-runoff and hydrodynamic ones. We classify with the first group e.g. TOPMODEL, CASC2D and AGNPS; with the second group MIKE 11 and HEC-RAS. Both groups of models have their defined use in the hydrological practice. The method of CN-curves has never been and will never be a method of operative hydrology. This method will never be able to provide the values of extreme runoff, culmination discharges or flood warning signals in real time. Based on results presented in this study we assume however that the CN method is a suitable modelling tool for the simulation of the impact of land cover and land use changes on the runoff volume in a basin with the emphasis on direct runoff. Contemporary geographic studies lack elaborate methodological procedures to assess the impact of landscape structure change on the runoff quantity with the aim to propose land use changes or modifications (e.g. of agricultural land) or at least the way of land cultivation in order to decrease the direct runoff volume. Land planning practice would surely welcome a sophisticated procedure of elaborated scenarios of potential consequences which could be implemented into the existing land planning documentation. Proposals of measurements in the sphere of both increasing landscape retention and protection against accelerated water erosion etc. will be possible to elaborate on the basis of runoff simulation for particular scenarios. The study documented possibilities of the CN-Curves Method in cooperation with modern tools of geographic research (GIS) in 7 mutually different basins from different landscape types in the territory of Slovakia. We suppose that in the future the list of the studied basins will be extended by areas in the upland territory of Slovakia. At the same time the attention will be concentrated on the possibilities of the CN-Curves Method application in the assessment of rainfall-runoff process at a microregional level within a part of a basin. Acknowledgement: The study was elaborated within a VEGA grant project, No. 1/3052/06. References: ADAMEC, M., HANZLOVÁ, M., HORÁK, J., UNUCKA, J., ŽIDEK, D. (2007): Modelování hydrologických extrémů s podporou DPZ a GIS. In: Langhammer, J. (eds.): Změny v krajině a povodňové riziko. Sborník příspěvků semináře Povodně a změny v krajině. PřF UK Praha, p ANTAL, J. (1999): Agrohydrológia. SPU Nitra, 172 pp. BAČA, P. (2003): Odtok a odnos plavenín z malého povodia spôsobený prívalovými dažďami. Dizertačná práca, ÚH SAV Bratislava, 168 pp. BALL, J.B. (1994): The influence of storm temporal pattern on catchment response. Journal of Hydrology, No. 158, p BERNARD, M. (1937): Giving areal significance to hydrological research on small areas. Headwaters control and use, Proceedings, Upstream Engineering Conf., p CRAWFORD, N.H., LINSLEY, R.K. (1966): Digital simulation in hydrology: Stanford Watershed Model IV. Technical Report, No. 39, Stanford University, Palo Alto, California, 114 pp. CUMMINGS, N.V. (1935): Evaporation from water surfaces: Status of present knowledge and need for further investigations. American Geophysical Union, Vol. 16, No. 2, p DOOGE, J.C. (1981): Parametrization of hydrologic processes. JSC Study Conference on Land Surface Processes in Atmospheric General Circulation Models, p
59 Vol. 15, 3/2007 Moravian geographical Reports FAEH, A., SHERER, S., NAEF, F. (1997): A Combined Field and Numerical Approach to Investigate Flow Processes in Natural Macroporous Soil Under Extreme Precipitation. Hydrology and Earth System Sciences, Vol. 1, No. 4, p GAJDOŠÍK, P., ŠULÍK, V., TRIZNA, M. (2005): Vplyv zmeny priestorovej štruktúry povodia na odtok vody v krajine. Geografické spectrum, No. 4, 64 pp. GREEN, W. H., AMPT, C. A. (1911): Studies on soil physics: 1. Flow of water and air through soils. Journal of Agricultural Sciences, No. 4, p HERRMANN, A., KOLL, J., MALOSZEWSKI, P., RAUERT, W. STICHLER, W. (1997): Water balance studies in a small catchment on paleozoic rock using environmental isotope tracer techniques. IAHS Publications No. 156, p HEWLETT, J. D. (1961): Some ideas about storm runoff and base flow. Southeast Forest Experiment Station Annual Report, USDA Forest Service, Athens, p HJEMFELT, M. R. (1992): Numerical study of the influence of environmental conditions on lake-effect snowstorms over Lake Michigan. Monthly Weather Review, No. 118, p HLAVČOVÁ, K., HOLKO, L., SZOLGAY, J. (2001) Tvorba a modelovanie odtoku na svahoch a z malých povodí. In: Životné prostredie, Vol. 35, No. 3, Ústav krajinnej ekológie, SAV, Bratislava, p HOLLOVÁ, J. (2004): Simulácia odtoku v závislosti na priestorovej štruktúre krajiny v povodí Jaloveckého potoka. Diplomová práca, Prírodovedecká fakulta UK, Bratislava, 85 pp. HORTON, R. E. (1919): Rainfall interception. Monthly Weather Rev., No. 147, p HORTON, R. E. (1933): The role of infiltration in the hydrologic cycle. American Geophysical Union, No. 145, p HORTON, R. E. (1935): Surface runoff phenomena, Part 1-Analysis of hydrograph. Horton Hydrology Laboratory Publication, No. 101, Voorheesville, N.Y, 65 pp. HORTON, R. E. (1939): Analysis of runoff plot experiments with varying infiltration capacities. American Geophysical Union No. 20 (IV), p HORTON, R. E. (1940): An approach toward a physical interpretation of infiltration capacity. Soil Sciences Society, Proceedings., No. 5, p HUANG, M. et al. (2005): A modification to the Soil Conservation Service curve number method for steep slopes in the Loess Plateau of China. In: Hydrological processes, New York, Vol. 20, No. 3, p HURSH, C. R. (1936): Storm water and absorption. American Geophysical Union, 17 (II), p HURSH, C. R., BRATER, E. F. (1944): Separating hydrographs into surface- and subsurface-flow. American Geophysical Union, No. 25, p CHOW, V. T. (1964): Handbook of Applied Hydrology. Mc Graw Hill Book Company, New York, 267 pp. IMBEAU, M. E. (1892): La Durance: Regime, crues et inundations. Ann. Ponts Chaussees, Mem. Doc., Ser. 3 (I), p KAVVAS, M.L. et al. (1998): A regional scale land surface parametrization based on areally-averaged hydrological conservation equation. Hydrological Science Journal, Vol. 43, No. 4, p KEULEGAN, G. H. (1944): Spatially variable discharge over a sloping plane. American Geophysical Union, 25(VI), p KOSTIAKOV, A. M. (1932): On the dynamics of the coefficient of water percolation in soils and of the necessity of studying it from a dynamic point of view for purposes of amelioration. Trans. 6th Communic., International Soil Science Society, Part 1, p KOSTKA, Z., HOLKO, L. (2001): Simulácia odtoku v horskom povodí s výrazným reliéfom pomocou modelu TOPOMODEL. Vodohospodársky časopis, Vol. 49, No. 3-4, p LEHRSCH, G. A., WHISLER, F. D., ROMKENS, M. J. M. (1987): Soil surface as influenced by selected soil physical parameters. Soil Till. Resources No. 10, p LOWDERMILK, W. C. (1934): Forests and streamflow: A discussion of Hoyt-Trozell report. Journal of Forestry, No. 21, p MULVANY, T. J. (1850): On the use of self-registering rain and flood gauges. Proc. Inst. Civil Engineering., Vol. 4, No. 2, p NIELSEN, D. R., KIRKHAM, D., van WIJK, W. K. (1959): Measuring water stored temporarily above the field moisture capacity. Soil Sciences Society, Proceedings No. 23, p PEKÁROVÁ, P., KONÍČEK, A., MIKLÁNEK, P., STANČÍK, Š., PEKÁR, J. (1998): Simulácia odtoku a znečistenia povrchových vôd z plošných zdrojov v povodí hornej Torysy (časť I. Model AGNPS a analýza výsledkov terénnych meraní z experimentálnych mikropovodí). In Vodohospodársky časopis, Vol. 46, No. 6, p
60 Moravian geographical Reports 3/2007, Vol. 15 PEKÁROVÁ, P., KONÍČEK, A., MIKLÁNEK, P., STANČÍK, Š., PEKÁR, J. (1999): Simulácia odtoku a znečistenia povrchových vôd z plošných zdrojov v povodí hornej Torysy (časť II. Výsledky simulácii modelom AGNPS). In Vodohospodársky časopis, Vol. 47, No. 1, p PENMAN, H. L. (1948): Natural evaporation from open water, bare soil and grass. Proceedings R. Society London, Series A, No. 193, p REMSON, I., RANDOLF, J. R., BARKSDALE, H. C. (1960): The zone of aeration and ground water recharge in sandy sediments at Seabrook, New Jersey. Soil Sciences, No. 89, p RICHARDSON, B. (1931) Evaporation as a function of insolation. American Society of Civil Engineering, No. 95, p ROESSEL, B. W. P. (1950): Hydrologic problems concerning the runoff in headwater regions. American Geophysical Union, No. 31, p SHRESTHA, M. N. (2003): Spatially Distributed Hydrological Modelling considering Land-use changes using Remote Sensing and GIS. [online]. Map Asia Conference. URL: SINGH, V. P. (1995): Computer models of watershed hydrology. Water resources publications, Littleton, Colorado, 85 pp. SINGH, V. P. (1996): Kinematic wave modelling in water resources: Surface Water Hydrology. Wiley, New York, 114 pp. SINGH, V. P., WOOLISHER, D. A. (2002): Mathematical Modeling of Watershed Hydrology. In: Journal of Hydrologic Engineering, Vol. 7, No. 4, p SHERMAN, L. K. (1932): Stream flow from rainfall by the unit graph method. Engineering News-Record, No. 108, p SMITH, R. E., GOODRICH, D. C., WOOLHISER, D. A. (1990): Areal effective infiltration dynamics for runoff of small catchments. Transactions of the 14 th Int. Conference Soil Science, International Soil Science Society, p STEPHENSON, D. (1984): Kinematic study of effects of storm dynamics on runoff hydrographs. Water SA, No. 10, p SURKAN, A. J. (1974): Simulation of storm velocity effects of flow from distributed channel network. Water Resources Research, No. 10, p THORNTHWAITE, C. W. (1948): An approach toward a rational classification of climate. Geographical Review, No. 38, p TRIZNA, M. (1999): Návrhy riešenia aktuálnych úloh protipovodňovej ochrany. In: J. Minár, M. Trizna (eds.): Teoretickometodologické problémy geografie, príbuzných disciplín a ich aplikácie, p TRIZNA, M., KYZEK, F. (2002): Modelovanie špecifických zrážkovo-odtokových situácií vo vybranom povodí. In: Balej, M., Jančák, V., Jeřábek, M., Oršulák, T. (eds.): Česká společnost a krajina, Sborník s XX. Sjezdu České geografické společnosti, Ústí nad Labem, p WALTER, M. T., SHAW, S. B. (2005): Curve number hydrology in water quality modeling: Uses, abuses, and future directions. J. Am. Water Resour. Assoc. Vol. 41, No. 6, p WURBS, R.A. (1998): Dissemination of generalized water resources models in United States. Water International, No. 23, p YOUNG, R.A., ONSTAD, C.A., BOSCH, D.D., ANDERSON, W.P. (1987): Agricultural Non-Point Source Pollution Model, Version 4.03 AGNPS User s Manual, USDA, Morris, Minnesota, 146 pp. Author s address: Assoc. Prof. Milan TRIZNA, Comenius University in Bratislava Faculty of Natural Science Department of Physical Geography and Geoecology trizna@fns.uniba.sk Reviewer: RNDr. J. LANGHAMMER, PhD. 58

61 Vol. 15, 3/2007 Moravian geographical Reports REVIEW Evžen QUITT Team of authors: Atlas podnebí Česka (Climate Atlas of the Czech Republic). Praha/ Palacký University in Olomouc 2007, 256 pp. + CD-ROM, CZK 700 Whilst pages of the newspapers and specialized periodicals as well have been filled up by the reports and papers of mostly compilation character about global changes of the climate, the principal work of our climatologists - Climate Atlas of the Czech Republic - was issued on the sly and without the adequate pomp at the beginning of As early as in 1919, after establishment of the State Meteorological Institute, processing of climatology of the Czech Republic, incl. the atlas, belonged among its key tasks. At that time the Institute had 8 employees that in particular managed the network of the optional monitoring stations from Aš to Jasiňa. After nearly forty years of activity of the Institute, by the end of 1958, the Climate Atlas of the Czechoslovak Republic appeared; its price was in those days CZK 300. The atlas contained 87 color maps in the 1:1,000,000 scale which included processing of nearly all climatic elements, mostly based on the monitoring period of 1901 to The isolines in individual maps were highlighted so that the interested person could deduce values of individual elements directly from the map. After nearly 50 years, in spring 2007, this key work of the Czech climatologists was issued again thanks to the Czech Hydrometeorological Institute, Publishing House of the Palacký University in Olomouc, under the support of the Ministry of the Environment and the National Climate Program. The majority of the basic climatic characteristics has been processed in it, based on the period , and the climatic elements are laid out on over 300 maps and 150 graphs. The thematic content of the atlas is similar to a certain degree with methodology of the preceding edition, it is broken down in to eleven chapters dealing with individual climatic characteristics - air temperature, precipitations, snow conditions, air humidity and evaporation, further on, with solar radiation, sunshine and cloudiness, air pressure and wind, dangerous atmospheric phenomena, phenological characteristics, soil temperature, climate dynamics and with the climatic classifications last. I miss the chapter dealing with the bioclimatic topic in the exhaustive list. These characteristics, depicting generally the forty-year averages, have been completed by processing of the selected extraordinary situations, floods of the last decade among them. The work has also been interpreted as the extensive encyclopedia about climate and therefore each phenomenon is clarified thoroughly in the accompanying text, on the photographs and in the graphs. It is also available in the digital form on CD and contains parallel Czech-English texts. Preparation of the work lasted nearly four years to the team of authors of over fifty, incorporating specialists of the Czech Hydrometeorological Institute and Universities in Olomouc, Brno, Ostrava and Bratislava. The work was awaited not only by the climatologists 59
Litosil - application
 Litosil - application The series of Litosil is primarily determined for cut polished floors. The cut polished floors are supplied by some specialized firms which are fitted with the appropriate technical
FIRE INVESTIGATION. Střední průmyslová škola Hranice. Mgr. Radka Vorlová. 19_Fire investigation CZ.1.07/1.5.00/
 FIRE INVESTIGATION Střední průmyslová škola Hranice Mgr. Radka Vorlová 19_Fire investigation CZ.1.07/1.5.00/34.0608 Výukový materiál Číslo projektu: CZ.1.07/1.5.00/21.34.0608 Šablona: III/2 Inovace a zkvalitnění
Tento materiál byl vytvořen v rámci projektu Operačního programu Vzdělávání pro konkurenceschopnost.
 Tento materiál byl vytvořen v rámci projektu Operačního programu Vzdělávání pro konkurenceschopnost. Projekt MŠMT ČR Číslo projektu Název projektu školy Klíčová aktivita III/2 EU PENÍZE ŠKOLÁM CZ.1.07/1.4.00/21.2146
GUIDELINES FOR CONNECTION TO FTP SERVER TO TRANSFER PRINTING DATA
 GUIDELINES FOR CONNECTION TO FTP SERVER TO TRANSFER PRINTING DATA What is an FTP client and how to use it? FTP (File transport protocol) - A protocol used to transfer your printing data files to the MAFRAPRINT
Czech Republic. EDUCAnet. Střední odborná škola Pardubice, s.r.o.
 Czech Republic EDUCAnet Střední odborná škola Pardubice, s.r.o. ACCESS TO MODERN TECHNOLOGIES Do modern technologies influence our behavior? Of course in positive and negative way as well Modern technologies
IS THERE NECESSARY TO RECALCULATE VLTAVA CASCADE PURPOSES??
 IS THERE NECESSARY TO RECALCULATE VLTAVA CASCADE PURPOSES?? Petr Kubala Povodí Vltavy, státní podnik www.pvl.cz 8/9/12 Mezinárodní Labské fórum 2015 Ústí nad Labem, 21. 22. April 2015 Elbe River Basin
USING VIDEO IN PRE-SET AND IN-SET TEACHER TRAINING
 USING VIDEO IN PRE-SET AND IN-SET TEACHER TRAINING Eva Minaříková Institute for Research in School Education, Faculty of Education, Masaryk University Structure of the presentation What can we as teachers
SOIL ECOLOGY the general patterns, and the particular
 Soil Biology topic No. 5: SOIL ECOLOGY the general patterns, and the particular patterns SOIL ECOLOGY is an applied scientific discipline dealing with living components of soil, their activities and THEIR
Project Life-Cycle Data Management
 Project Life-Cycle Data Management 1 Contend UJV Introduction Problem definition Input condition Proposed solution Reference Conclusion 2 UJV introduction Research, design and engineering company 1000
Air Quality Improvement Plans 2019 update Analytical part. Ondřej Vlček, Jana Ďoubalová, Zdeňka Chromcová, Hana Škáchová
 Air Quality Improvement Plans 2019 update Analytical part Ondřej Vlček, Jana Ďoubalová, Zdeňka Chromcová, Hana Škáchová vlcek@chmi.cz Task specification by MoE: What were the reasons of limit exceedances
Rozvoj vzdělávání žáků karvinských základních škol v oblasti cizích jazyků Registrační číslo projektu: CZ.1.07/1.1.07/ hod.
 Rozvoj vzdělávání žáků karvinských základních škol v oblasti cizích jazyků Registrační číslo projektu: CZ.1.07/1.1.07/02.0162 ZŠ Určeno pro Sekce Předmět Téma / kapitola Zpracovala ZŠ Školská žáky 8. a
Case Study Czech Republic Use of context data for different evaluation activities
 Case Study Czech Republic Use of context data for different evaluation activities Good practice workshop on Choosing and using context indicators in Rural Development, Lisbon, 15 16 November 2012 CONTENT
Gymnázium, Brno, Slovanské nám. 7 WORKBOOK. Mathematics. Teacher: Student:
 WORKBOOK Subject: Teacher: Student: Mathematics.... School year:../ Conic section The conic sections are the nondegenerate curves generated by the intersections of a plane with one or two nappes of a cone.
STUDY EDITS FOR BETTER TRANSPORT IN THE CENTRE OF NÁCHOD
 CZECH TECHNICAL UNIVERSITY IN PRAGUE Faculty of transportation sciences Title of project STUDY EDITS FOR BETTER TRANSPORT IN THE CENTRE OF NÁCHOD 2006 Petr Kumpošt Basic information about town Náchod Náchod
Energy vstupuje na trh veterinárních produktů Energy enters the market of veterinary products
 Energy news2 1 Energy vstupuje na trh veterinárních produktů Energy enters the market of veterinary products Doposud jste Energy znali jako výrobce a dodavatele humánních přírodních doplňků stravy a kosmetiky.
Střední průmyslová škola strojnická Olomouc, tř.17. listopadu 49
 Střední průmyslová škola strojnická Olomouc, tř.17. listopadu 49 Výukový materiál zpracovaný v rámci projektu Výuka moderně Registrační číslo projektu: CZ.1.07/1.5.00/34.0205 Šablona: III/2 Anglický jazyk
CARBONACEOUS PARTICLES IN THE AIR MORAVIAN-SILESIAN REGION
 UHLÍKATÉ ČÁSTICE V OVZDUŠÍ MORAVSKO- SLEZSKÉHO KRAJE CARBONACEOUS PARTICLES IN THE AIR MORAVIAN-SILESIAN REGION Ing. MAREK KUCBEL Ing. Barbora SÝKOROVÁ, prof. Ing. Helena RACLAVSKÁ, CSc. Aim of this work
Introduction to MS Dynamics NAV
 Introduction to MS Dynamics NAV (Item Charges) Ing.J.Skorkovský,CSc. MASARYK UNIVERSITY BRNO, Czech Republic Faculty of economics and business administration Department of corporate economy Item Charges
CZ.1.07/1.5.00/34.0527
 Projekt: Příjemce: Digitální učební materiály ve škole, registrační číslo projektu CZ.1.07/1.5.00/34.0527 Střední zdravotnická škola a Vyšší odborná škola zdravotnická, Husova 3, 371 60 České Budějovice
DC circuits with a single source
 Název projektu: utomatizace výrobních procesů ve strojírenství a řemeslech egistrační číslo: Z..07/..0/0.008 Příjemce: SPŠ strojnická a SOŠ profesora Švejcara Plzeň, Klatovská 09 Tento projekt je spolufinancován
RGCML Zpráva o hřišti Ochranná přikrývka greenu 14 Stuart Burridge, přel P.S.
 RGCML Zpráva o hřišti Ochranná přikrývka greenu 14 Stuart Burridge, přel P.S. Koncem minulé sezony bylo rozhodnuto vyzkoušet jednu ochrannou přikrývku na green. Princip greenové přikrývky je jednoduchý.
Instrukce: Cvičný test má celkem 3 části, čas určený pro tyto části je 20 minut. 1. Reading = 6 bodů 2. Use of English = 14 bodů 3.
 Vážení studenti, na následujících stranách si můžete otestovat svou znalost angličtiny a orientačně zjistit, kolik bodů za jazykové kompetence byste získali v přijímacím řízení. Maximální počet bodů je
Caroline Glendinning Jenni Brooks Kate Gridley. Social Policy Research Unit University of York
 Caroline Glendinning Jenni Brooks Kate Gridley Social Policy Research Unit University of York Growing numbers of people with complex and severe disabilities Henwood and Hudson (2009) for CSCI: are the
Aktivita CLIL Chemie I.
 Škola: Gymnázium Bystřice nad Pernštejnem Jméno vyučujícího: Mgr. Marie Dřínovská Aktivita CLIL Chemie I. Název aktivity: Uhlíkový cyklus v přírodě Carbon cycle Předmět: Chemie Ročník, třída: kvinta Jazyk
Enabling Intelligent Buildings via Smart Sensor Network & Smart Lighting
 Enabling Intelligent Buildings via Smart Sensor Network & Smart Lighting Petr Macháček PETALIT s.r.o. 1 What is Redwood. Sensor Network Motion Detection Space Utilization Real Estate Management 2 Building
PC/104, PC/104-Plus. 196 ept GmbH I Tel. +49 (0) / I Fax +49 (0) / I I
 / I Fax +49 (0) / I I") E L E C T R O N I C C O N N E C T O R S 196 ept GmbH I Tel. +49 (0) 88 61 / 25 01 0 I Fax +49 (0) 88 61 / 55 07 I E-Mail sales@ept.de I www.ept.de Contents Introduction 198 Overview 199 The Standard 200
E L E C T R O N I C C O N N E C T O R S 196 ept GmbH I Tel. +49 (0) 88 61 / 25 01 0 I Fax +49 (0) 88 61 / 55 07 I E-Mail sales@ept.de I www.ept.de Contents Introduction 198 Overview 199 The Standard 200
Digitální učební materiály www.skolalipa.cz. Česká republika základní informace
 Název školy Číslo projektu Název projektu Klíčová aktivita Dostupné z: Označení materiálu: Typ materiálu: Předmět, ročník, obor: Tematická oblast: Téma: STŘEDNÍ ODBORNÁ ŠKOLA a STŘEDNÍ ODBORNÉ UČILIŠTĚ,
The Over-Head Cam (OHC) Valve Train Computer Model
 Valve Train Computer Model") The Over-Head Cam (OHC) Valve Train Computer Model Radek Tichanek, David Fremut Robert Cihak Josef Bozek Research Center of Engine and Content Introduction Work Objectives Model Description Cam Design
The Over-Head Cam (OHC) Valve Train Computer Model Radek Tichanek, David Fremut Robert Cihak Josef Bozek Research Center of Engine and Content Introduction Work Objectives Model Description Cam Design
dat 2017 Dostupný z Licence Creative Commons Uveďte autora-zachovejte licenci 4.0 Mezinárodní
 Interní pravidla pro zacházení s osobními údaji při archivaci a sdílení výzkumných dat Koščík, Michal 2017 Dostupný z http://www.nusl.cz/ntk/nusl-367303 Dílo je chráněno podle autorského zákona č. 121/2000
Číslo projektu: CZ.1.07/1.5.00/34.0036 Název projektu: Inovace a individualizace výuky
 Číslo projektu: CZ.1.07/1.5.00/34.0036 Název projektu: Inovace a individualizace výuky Autor: Mgr. Libuše Matulová Název materiálu: Education Označení materiálu: VY_32_INOVACE_MAT27 Datum vytvoření: 10.10.2013
1 Regional Economics and Policy
 Regional Economics and Policy Jméno, příjmení, tituly:................................................................................. Datum:.................................................................................................................
Dendrogeomorphic research in Department of physical geography and geoecology, University of Ostrava Dendrogeomorfologický výzkum na KFGG PřF OU
 Dendrogeomorphic research in Department of physical geography and geoecology, University of Ostrava Dendrogeomorfologický výzkum na KFGG PřF OU Karel ŠILHÁN Ostravská univerzita, karel.silhan@osu.cz Abstract
Vliv metody vyšetřování tvaru brusného kotouče na výslednou přesnost obrobku
 Vliv metody vyšetřování tvaru brusného kotouče na výslednou přesnost obrobku Aneta Milsimerová Fakulta strojní, Západočeská univerzita Plzeň, 306 14 Plzeň. Česká republika. E-mail: anetam@kto.zcu.cz Hlavním
VYSOKÁ ŠKOLA HOTELOVÁ V PRAZE 8, SPOL. S R. O.
 VYSOKÁ ŠKOLA HOTELOVÁ V PRAZE 8, SPOL. S R. O. Návrh konceptu konkurenceschopného hotelu v době ekonomické krize Diplomová práce 2013 Návrh konceptu konkurenceschopného hotelu v době ekonomické krize Diplomová
Klepnutím lze upravit styl předlohy. nadpisů. nadpisů.
 1/ 13 Klepnutím lze upravit styl předlohy Klepnutím lze upravit styl předlohy www.splab.cz Soft biometric traits in de identification process Hair Jiri Prinosil Jiri Mekyska Zdenek Smekal 2/ 13 Klepnutím
Střední průmyslová škola strojnická Olomouc, tř.17. listopadu 49
 Střední průmyslová škola strojnická Olomouc, tř.17. listopadu 49 Výukový materiál zpracovaný v rámci projektu Výuka moderně Registrační číslo projektu: CZ.1.07/1.5.00/34.0205 Šablona: III/2 Anglický jazyk
A hundred times nothing killed the donkey. Stanislav Březina The authority of the Krkonoše Mts. National Park
 A hundred times nothing killed the donkey Stanislav Březina The authority of the Krkonoše Mts. National Park (sbrezina@krnap.cz) The Krkonoše Mts NP protects the highest mountains of the Czech Republic.
DATA SHEET. BC516 PNP Darlington transistor. technický list DISCRETE SEMICONDUCTORS Apr 23. Product specification Supersedes data of 1997 Apr 16
 zákaznická linka: 840 50 60 70 DISCRETE SEMICONDUCTORS DATA SHEET book, halfpage M3D186 Supersedes data of 1997 Apr 16 1999 Apr 23 str 1 Dodavatel: GM electronic, spol. s r.o., Křižíkova 77, 186 00 Praha
VYUŽITÍ MAPOVÉ TVORBY V METEOROLOGII A KLIMATOLOGII
 Kartografické listy, 2008, 16. Radim TOLASZ VYUŽITÍ MAPOVÉ TVORBY V METEOROLOGII A KLIMATOLOGII Tolasz, R.: Using of map products for meteorology and climatology. Kartografické listy 2008, 16, 16 figs.,
Informace o písemných přijímacích zkouškách. Doktorské studijní programy Matematika
 Informace o písemných přijímacích zkouškách (úplné zadání zkušebních otázek či příkladů, které jsou součástí přijímací zkoušky nebo její části, a u otázek s výběrem odpovědi správné řešení) Doktorské studijní
CZ.1.07/1.5.00/34.0527
 Projekt: Příjemce: Digitální učební materiály ve škole, registrační číslo projektu CZ.1.07/1.5.00/34.0527 Střední zdravotnická škola a Vyšší odborná škola zdravotnická, Husova 3, 371 60 České Budějovice
Bibliometric probes into the world of scientific publishing: Economics first
 Bibliometric probes into the world of scientific publishing: Economics first Daniel Münich VŠE, Nov 7, 2017 Publication space Field coverage of WoS Source: Henk F. Moed, Citation Analysis in Research Evaluation,
Table of contents. 5 Africa poverty reduction. Africa's growth. Africa - productivity. Africa - resources. Africa development
 Africa Table of contents 1 Africa's growth 2 Africa - productivity 3 Africa - resources 4 Africa development 5 Africa poverty reduction 6 Africa Trade opportunities Africa's growth Different approaches
Klepnutím lze upravit styl Click to edit Master title style předlohy nadpisů.
 nadpisu. Case Study Environmental Controlling level Control Fifth level Implementation Policy and goals Organisation Documentation Information Mass and energy balances Analysis Planning of measures 1 1
Návrh a implementace algoritmů pro adaptivní řízení průmyslových robotů
 Návrh a implementace algoritmů pro adaptivní řízení průmyslových robotů Design and implementation of algorithms for adaptive control of stationary robots Marcel Vytečka 1, Karel Zídek 2 Abstrakt Článek
SSOS_AJ_3.17 Czech education
 Číslo a název projektu Číslo a název šablony DUM číslo a název CZ.1.07/1.5.00/34.0378 Zefektivnění výuky prostřednictvím ICT technologií III/2 - Inovace a zkvalitnění výuky prostřednictvím ICT SSOS_AJ_3.17
Fytomineral. Inovace Innovations. Energy News 04/2008
 Energy News 4 Inovace Innovations 1 Fytomineral Tímto Vám sdělujeme, že již byly vybrány a objednány nové lahve a uzávěry na produkt Fytomineral, které by měly předejít únikům tekutiny při přepravě. První
Fourth School Year PISTON MACHINES AND PISTON COMPRESSORS
 Fourth School Year PISTON MACHINES AND PISTON COMPRESSORS 1. Piston machines Piston machines are classified as machines working with volume changes. It means that the working medium is closed by a in a
Research infrastructure in the rhythm of BLUES. More time and money for entrepreneurs
 Research infrastructure in the rhythm of BLUES More time and money for entrepreneurs 1 I. What is it? II. How does it work? III. References Where to find out more? IV. What is it good for? 2 I. What is
PROFESIONÁLNÍ EXPOZICE PRACOVNÍKÙ FAKTORÙM PRACOVNÍHO PROSTØEDÍ VE VZTAHU K HLÁENÝM NEMOCÍM Z POVOLÁNÍ V ROCE 2003
 ÈESKÉ PRACOVNÍ LÉKAØSTVÍ ÈÍSLO 2 2004 Pùvodní práce PROFESIONÁLNÍ EXPOZICE PRACOVNÍKÙ FAKTORÙM PRACOVNÍHO PROSTØEDÍ VE VZTAHU K HLÁENÝM NEMOCÍM Z POVOLÁNÍ V ROCE 2003 SOUHRN OCCUPATIONAL EXPOSURE OF WORKERS
STUDY EDITS MAIN ROADS IN ČESKÝ KRUMLOV
 Title of project STUDY EDITS MAIN ROADS IN ČESKÝ KRUMLOV Alexandra Holubová Faculty of transportation sciences Czech Technical University in Prague Czech Republic 2006 TRAFFIC IN REGION The town Český
Compression of a Dictionary
 Compression of a Dictionary Jan Lánský, Michal Žemlička zizelevak@matfyz.cz michal.zemlicka@mff.cuni.cz Dept. of Software Engineering Faculty of Mathematics and Physics Charles University Synopsis Introduction
STŘEDNÍ ODBORNÁ ŠKOLA a STŘEDNÍ ODBORNÉ UČILIŠTĚ, Česká Lípa, 28. října 2707, příspěvková organizace
 Název školy STŘEDNÍ ODBORNÁ ŠKOLA a STŘEDNÍ ODBORNÉ UČILIŠTĚ, Česká Lípa, 28. října 2707, příspěvková organizace Číslo a název projektu: CZ.1.07/1.5.00/34.0880 Digitální učební materiály www.skolalipa.cz
AIC ČESKÁ REPUBLIKA CZECH REPUBLIC
 ČESKÁ REPUBLIKA CZECH REPUBLIC ŘÍZENÍ LETOVÉHO PROVOZU ČR, s.p. Letecká informační služba AIR NAVIGATION SERVICES OF THE C.R. Aeronautical Information Service Navigační 787 252 61 Jeneč A 1/14 20 FEB +420
Theme 6. Money Grammar: word order; questions
 Theme 6 Money Grammar: word order; questions Čas potřebný k prostudování učiva lekce: 8 vyučujících hodin Čas potřebný k ověření učiva lekce: 45 minut KLÍNSKÝ P., MÜNCH O., CHROMÁ D., Ekonomika, EDUKO
Dynamic Development of Vocabulary Richness of Text. Miroslav Kubát & Radek Čech University of Ostrava Czech Republic
 Dynamic Development of Vocabulary Richness of Text Miroslav Kubát & Radek Čech University of Ostrava Czech Republic Aim To analyze a dynamic development of vocabulary richness from a methodological point
VŠEOBECNÁ TÉMATA PRO SOU Mgr. Dita Hejlová
 VŠEOBECNÁ TÉMATA PRO SOU Mgr. Dita Hejlová VZDĚLÁVÁNÍ V ČR VY_32_INOVACE_AH_3_03 OPVK 1.5 EU peníze středním školám CZ.1.07/1.500/34.0116 Modernizace výuky na učilišti Název školy Název šablony Předmět
Transactions of the VŠB Technical University of Ostrava, Mechanical Series. article No Vladislav KŘIVDA *
 Transactions of the VŠB Technical University of Ostrava, Mechanical Series No. 1, 2012, vol. LVIII article No. 1905 Vladislav KŘIVDA * PROBABILITY OF EMERGENCE OF CONFLICT SITUATION DURING PROBLEMATIC
Využití hybridní metody vícekriteriálního rozhodování za nejistoty. Michal Koláček, Markéta Matulová
 Využití hybridní metody vícekriteriálního rozhodování za nejistoty Michal Koláček, Markéta Matulová Outline Multiple criteria decision making Classification of MCDM methods TOPSIS method Fuzzy extension
CZ.1.07/1.5.00/
 Projekt: Příjemce: Digitální učební materiály ve škole, registrační číslo projektu CZ.1.07/1.5.00/34.0527 Střední zdravotnická škola a Vyšší odborná škola zdravotnická, Husova 3, 371 60 České Budějovice
Transportation Problem
 Transportation Problem ١ C H A P T E R 7 Transportation Problem The transportation problem seeks to minimize the total shipping costs of transporting goods from m origins (each with a supply s i ) to n
Stojan pro vrtačku plošných spojů
 Střední škola průmyslová a hotelová Uherské Hradiště Kollárova 617, Uherské Hradiště Stojan pro vrtačku plošných spojů Závěrečný projekt Autor práce: Koutný Radim Lukáš Martin Janoštík Václav Vedoucí projektu:
UPM3 Hybrid Návod na ovládání Čerpadlo UPM3 Hybrid 2-5 Instruction Manual UPM3 Hybrid Circulation Pump 6-9
 www.regulus.cz UPM3 Hybrid Návod na ovládání Čerpadlo UPM3 Hybrid 2-5 Instruction Manual UPM3 Hybrid Circulation Pump 6-9 CZ EN UPM3 Hybrid 1. Úvod V továrním nastavení čerpadla UPM3 Hybrid je profil PWM
WORKSHEET 1: LINEAR EQUATION 1
 WORKSHEET 1: LINEAR EQUATION 1 1. Write down the arithmetical problem according the dictation: 2. Translate the English words, you can use a dictionary: equations to solve solve inverse operation variable
SPECIFICATION FOR ALDER LED
 SPECIFICATION FOR ALDER LED MODEL:AS-D75xxyy-C2LZ-H1-E 1 / 13 Absolute Maximum Ratings (Ta = 25 C) Parameter Symbol Absolute maximum Rating Unit Peak Forward Current I FP 500 ma Forward Current(DC) IF
SUBSTRUCTURES underground structures
 SUBSTRUCTURES underground structures FUNCTION AND REQUIREMENTS Static function substructure transfers the load to the foundation soil: vertical loading from upper stucture horizontal reaction of upper
Risk management in the rhythm of BLUES. Více času a peněz pro podnikatele
 Risk management in the rhythm of BLUES Více času a peněz pro podnikatele 1 I. What is it? II. How does it work? III. How to find out more? IV. What is it good for? 2 I. What is it? BLUES Brain Logistics
RYBÁŘSKÉ ŘETĚZY FISHING CHAINS
 Řetězárna a.s Polská 48 790 81 Česká Ves Czech Republic + 420 584 488 111 + 420 584 428 194 export@retezarna.cz www.retezarna.cz RYBÁŘSKÉ ŘETĚZY FISHING CHAINS RYBÁŘSKÉ ŘEŤEZY Chains exported worldwide...
SGM. Smart Grid Management THE FUTURE FOR ENERGY-EFFICIENT SMART GRIDS
 WHO ARE WE? a company specializing in software applications for smart energy grids management and innovation a multidisciplinary team of experienced professionals from practice and from Czech technical
Contact person: Stanislav Bujnovský,
 Tender documentation link: https://nen.nipez.cz/seznamzadavacichpostupu/zakladniinformaceozadavacimpostupum- 674611632-20523816/ZakladniInformaceOZadavacimPostupu-674611632-20523816/ Contact person: Stanislav
SMES-EU D&H-5P Workshop 1. Prague November 2003 V Praze listopadu 2003
 SMES-EU D&H-5P Workshop 1 Prague November 2003 V Praze listopadu 2003 SMES-EU D&H-5P Workshop 1 The presentation includes comments and observations made during the Czech Republic Workshop of November 2003.
EXACT DS OFFICE. The best lens for office work
 EXACT DS The best lens for office work EXACT DS When Your Glasses Are Not Enough Lenses with only a reading area provide clear vision of objects located close up, while progressive lenses only provide
Tento materiál byl vytvořen v rámci projektu Operačního programu Vzdělávání pro konkurenceschopnost.
 Tento materiál byl vytvořen v rámci projektu Operačního programu Vzdělávání pro konkurenceschopnost. Projekt MŠMT ČR Číslo projektu Název projektu školy Klíčová aktivita III/2 EU PENÍZE ŠKOLÁM CZ.1.07/1.4.00/21.2146
The Upper Metuje River, Czech Republic
 The Upper Metuje River, Czech Republic Location The Upper Metuje catchment is located in the north east of the Czech Republic on the border with Poland. The Metuje River joins the Elbe River, which flows
CHAPTER 5 MODIFIED MINKOWSKI FRACTAL ANTENNA
 CHAPTER 5 MODIFIED MINKOWSKI FRACTAL ANTENNA &KDSWHUSUHVHQWVWKHGHVLJQDQGIDEULFDW LRQRIPRGLILHG0LQNRZVNLIUDFWDODQWHQQD IRUZLUHOHVVFRPPXQLFDWLRQ7KHVLPXODWHG DQGPHDVXUHGUHVXOWVRIWKLVDQWHQQDDUH DOVRSUHVHQWHG
Aplikace matematiky. Dana Lauerová A note to the theory of periodic solutions of a parabolic equation
 Aplikace matematiky Dana Lauerová A note to the theory of periodic solutions of a parabolic equation Aplikace matematiky, Vol. 25 (1980), No. 6, 457--460 Persistent URL: http://dml.cz/dmlcz/103885 Terms
Výukový materiál v rámci projektu OPVK 1.5 Peníze středním školám
 VY_22_INOVACE_AJOP40764ČER Výukový materiál v rámci projektu OPVK 1.5 Peníze středním školám Číslo projektu: Název projektu: Číslo šablony: CZ.1.07/1.5.00/34.0883 Rozvoj vzdělanosti II/2 Datum vytvoření:
Výuka odborného předmětu z elektrotechniky na SPŠ Strojní a Elektrotechnické
 Jihočeská univerzita v Českých Budějovicích Pedagogická fakulta Oddělení celoživotního vzdělávání Závěrečná práce Výuka odborného předmětu z elektrotechniky na SPŠ Strojní a Elektrotechnické Vypracoval:
B1 MORE THAN THE CITY
 B1 MORE THAN THE CITY INTRODUCTION ÚVOD B1 Budova B1 je součástí moderního kancelářského projektu CITY WEST a nově budované městské čtvrti Západní město, Praha 5 - Stodůlky. Tato lokalita kromě vynikající
CHAIN TRANSMISSIONS AND WHEELS
 Second School Year CHAIN TRANSMISSIONS AND WHEELS A. Chain transmissions We can use chain transmissions for the transfer and change of rotation motion and the torsional moment. They transfer forces from
MAGAZINE ABOUT WOMEN THE WAY THEY REALLY ARE
 MAGAZINE ABOUT WOMEN THE WAY THEY REALLY ARE ONA DNES FEMALE READERS MAGAZINE ONA DNES Ona DNES, themondaysupplementofthemf DNES daily, offersand intelligentand entertainingaccountofrelationships, theworldaroundus,
Travel information. 1. from Prague to Ostrava
 1. from Prague to Ostrava Travel information Ostrava, as a city with more than 330 thousands inhabitants, has a regular flight connection with Prague, usually arranged by the Czech Airlines, which is a
Příručka ke směrnici 89/106/EHS o stavebních výrobcích / Příloha III - Rozhodnutí Komise
 Příručka ke směrnici 89/106/EHS o stavebních výrobcích / Příloha III - Rozhodnutí Komise ROZHODNUTÍ KOMISE ze dne 27. června 1997 o postupu prokazování shody stavebních výrobků ve smyslu čl. 20 odst. 2
Svalová dystrofie. Prezentace technologických řešení registru Petr Brabec
 Svalová dystrofie Prezentace technologických řešení registru Petr Brabec ABOUT IBA MU About IBA Academic institute -> Established in 2001 -> 45 employees -> 65 scientific projects Structure -> Data analysis
Biosensors and Medical Devices Development at VSB Technical University of Ostrava
 VŠB TECHNICAL UNIVERSITY OF OSTRAVA FACULTY OF ELECTRICAL ENGINEERING AND COMPUTER SCIENCE Biosensors and Medical Devices Development at VSB Technical University of Ostrava Ing. Martin Černý Ph.D. and
Škola: Střední škola obchodní, České Budějovice, Husova 9. Inovace a zkvalitnění výuky prostřednictvím ICT
 Škola: Střední škola obchodní, České Budějovice, Husova 9 Projekt MŠMT ČR: EU PENÍZE ŠKOLÁM Číslo projektu: CZ.1.07/1.5.00/34.0536 Název projektu školy: Výuka s ICT na SŠ obchodní České Budějovice Šablona
T E S T R E P O R T No. 18/440/P124
 CENTRUM STAVEBNÍHO INŽENÝRSTVÍ a.s. Zkušebna fyzikálních vlastností materiálů, konstrukcí a budov - Praha Zkušební laboratoř č. 1007.4 akreditovaná ČIA dle ČSN EN ISO/IEC 17025 Pražská 16, 102 00 Praha
VY_32_INOVACE_06_Předpřítomný čas_03. Škola: Základní škola Slušovice, okres Zlín, příspěvková organizace
 VY_32_INOVACE_06_Předpřítomný čas_03 Autor: Růžena Krupičková Škola: Základní škola Slušovice, okres Zlín, příspěvková organizace Název projektu: Zkvalitnění ICT ve slušovské škole Číslo projektu: CZ.1.07/1.4.00/21.2400
VÝSLEDKY KLIMATICKÝCH MĚŘENÍ V severní časti MORAVSKÉHO KRASU V ROCE 2009
 SLOVENSKÝ KRAS ACTA CARSOLOGICA SLOVACA 48/1 47 57 LIPTOVSKÝ MIKULÁŠ 2010 VÝSLEDKY KLIMATICKÝCH MĚŘENÍ V severní časti MORAVSKÉHO KRASU V ROCE 2009 Hana Pokladníková 1 Tomáš Litschmann 2 Tomáš Středa 1
PITSTOP VY_22_INOVACE_26
 PITSTOP VY_22_INOVACE_26 Vzdělávací oblast: Jazyk a jazyková komunikace Vzdělávací obor: Anglický jazyk Ročník: 9. PITSTOP 1/ Try to complete the missing words. Then listen and check your ideas. Eight
Mechanika Teplice, výrobní družstvo, závod Děčín TACHOGRAFY. Číslo Servisní Informace Mechanika: 5-2013
 Mechanika Teplice, výrobní družstvo, závod Děčín TACHOGRAFY Servisní Informace Datum vydání: 20.2.2013 Určeno pro : AMS, registrované subj.pro montáž st.měř. Na základě SI VDO č./datum: Není Mechanika
Co vím o Ázerbájdžánu?
 Ministerstvo mládeže a sportu Ázerbájdžánské republiky Ministerstvo zahraničních věcí Ázerbájdžánské republiky Velvyslanectví Ázerbájdžánské republiky v Praze ve spolupráci s Centrem ázerbájdžánských a
Jak se pečuje o zemědělskou půdu v České republice? Bořivoj ŠARAPATKA Univerzita Palackého v Olomouci e-mail: borivoj.sarapatka@upol.
 Jak se pečuje o zemědělskou půdu v České republice? Bořivoj ŠARAPATKA Univerzita Palackého v Olomouci e-mail: borivoj.sarapatka@upol.cz 54 % of arable land - problems with water erosion velikost pozemků
Vánoční sety Christmas sets
 Energy news 7 Inovace Innovations 1 Vánoční sety Christmas sets Na jaře tohoto roku jste byli informováni o připravované akci pro předvánoční období sety Pentagramu koncentrátů a Pentagramu krémů ve speciálních
DOPLNĚK K FACEBOOK RETRO EDICI STRÁNEK MAVO JAZYKOVÉ ŠKOLY MONCHHICHI
 MONCHHICHI The Monchhichi franchise is Japanese and held by the Sekiguchi Corporation, a famous doll company, located in Tokyo, Japan. Monchhichi was created by Koichi Sekiguchi on January 25, 1974. Sekiguchi
CZ.1.07/1.5.00/34.0527
 Projekt: Příjemce: Digitální učební materiály ve škole, registrační číslo projektu CZ.1.07/1.5.00/34.0527 Střední zdravotnická škola a Vyšší odborná škola zdravotnická, Husova 3, 371 60 České Budějovice
Effect of ph on the denitrifying enzyme activity in pasture soils in relation to the intrinsic differences in denitrifier communities
 University of South Bohemia in České Budějovice Faculty of Science Effect of ph on the denitrifying enzyme activity in pasture soils in relation to the intrinsic differences in denitrifier communities
Čtvrtý Pentagram The fourth Pentagram
 Energy News 4 1 Čtvrtý Pentagram The fourth Pentagram Na jaře příštího roku nabídneme našim zákazníkům již čtvrtý Pentagram a to Pentagram šamponů. K zavedení tohoto Pentagramu jsme se rozhodli na základě
Právní formy podnikání v ČR
 Bankovní institut vysoká škola Praha Právní formy podnikání v ČR Bakalářská práce Prokeš Václav Leden, 2009 Bankovní institut vysoká škola Praha Katedra Bankovnictví Právní formy podnikání v ČR Bakalářská
Zubní pasty v pozměněném složení a novém designu
 Energy news4 Energy News 04/2010 Inovace 1 Zubní pasty v pozměněném složení a novém designu Od října tohoto roku se začnete setkávat s našimi zubními pastami v pozměněném složení a ve zcela novém designu.