Quantification in descriptive and experimental study of functional morphology of vascular wall
|
|
|
- Otto Hruda
- před 5 lety
- Počet zobrazení:
Transkript

1 Univerzita Karlova v Praze Lékařská fakulta v Plzni Ústav histologie a embryologie Kvantifikace v deskriptivním a experimentálním studiu funkční morfologie cévní stěny Quantification in descriptive and experimental study of functional morphology of vascular wall Dizertační práce MUDr. Mgr. Zbyněk Tonar Plzeň 2007
2
3 Bibliografické informace Autor: Zbyněk Tonar Název práce: Kvantifikace v deskriptivním a experimentálním studiu funkční morfologie cévní stěny Jazyk práce: český, anglický Typ práce: Dizertační práce k získání akademického titulu Ph.D. Univerzita: Univerzita Karlova v Praze Fakulta: Lékařská fakulta v Plzni Ústav: Ústav histologie a embryologie Obor postgraduálního studia: Všeobecné lékařství Specializace: Anatomie, histologie a embryologie Forma studia: prezenční Školitel: Doc. MUDr. Jitka Kočová, CSc. Školitel specialista: Prof. Ing. Rudolf Poledne, CSc. Datum odevzdání: Klíčová slova: Mikroskopie; morfometrie; cévní stěna; analýza obrazu; stereologie; ateroskleróza Název práce v angličtině: Quantification in descriptive and experimental study of functional morphology of vascular wall Klíčová slova v angličtině: Microscopy; morphometry; vascular wall; image processing; stereology; atherosclerosis Citování práce: Tonar Z. (2007): Kvantifikace v deskriptivním a experimentálním studiu funkční morfologie cévní stěny. Dizertační práce. Lékařská fakulta Univerzity Karlovy v Plzni, 156 pp. 1
4 Errata Strana Řádek Chybně Správně 2
5 Poděkování Na tomto místě bych rád poděkoval těm, kteří mi radou, podporou či součinností během mého studia pomáhali. Děkuji svým školitelům, paní doc. MUDr. Jitce Kočové, CSc., a panu prof. Ing. Rudolfovi Poledne, CSc., za odbornou, kolegiální i materiální podporu při vypracovávání předkládaných výsledků. Děkuji paní doc. MVDr. Dr.med.vet. Kirsti Witter, CSc., za diskuze týkající se stereologie a za možnost stáže na Veterinärmedizinische Universität Wien. Doc. Witter a též panu prof. MVDr. Ivanu Míškovi, CSc., děkuji za ochotu a pomoc při získávání zkušeností s 3-D rekonstrukcemi založenými na sériových histologických řezech a za udílení praktických rad. Paní RNDr. Lucii Kubínové, CSc., panu RNDr. Dr. Jiřímu Janáčkovi a panu doc. Ing. Zoltánu Tomori, CSc., jsem zavázán za četné a velmi užitečné konzultace při výběru a aplikaci stereologických metod na biologické vzorky a za programátorskou podporu. Prof. Terry Mayhew a Dr. John Lucocq mi svou trpělivostí pomohli k chápání některých postupů v kvantitativní mikroskopii. Děkuji panu prof. Ing. Josefu Rosenbergovi, DrSc., a panu doc. Dr. RNDr. Miroslavu Holečkovi za poskytnutí zázemí při rozvoji kvantifikačních metod. Děkuji kolegyni Ing. Petře Kochové za spolupráci při zpracování některých morfometrických dat. Práci paní laborantky Jaroslavy Beránkové vděčím za vysokou kvalitu histologických preparátů, kolegovi Lukášovi Nedorostovi za diskuze technického rázu a kolegovi Vítu M. Matějkovi za segmentaci obrazu u ukázky 3-D rekonstrukce. S jazykovou korekturou některých publikací v angličtině mi pomáhal pan Wesley Kobylak a pan Ian Levely. Děkuji své manželce Mgr. Martině Tonarové za všestrannou pomoc, za společné diskuze a za jazykovou kontrolu rukopisu i většiny publikací. Svým dětem a rodičům děkuji za dlouhodobou podporu a toleranci mé práce. Děkuji svým studentům za spolupráci, četné dotazy a motivující rozhovory, zejména pak kolegyni Karle Maštálkové. Svému učiteli panu prof. MUDr. RNDr. Jaroslavu Slípkovi, DrSc., děkuji za to, že mne svým celoživotním příkladem ke studiu morfologie inspiroval. 3
6 Prohlášení o autorském podílu na předkládané práci Jsem prvním [29, 33, 36, 37, 38, 39, 44] nebo korespondujícím [35] autorem u osmi ze 17 předkládaných prací. U další týmové publikace jsem se od počátku účastnil návrhu experimentů [34] s ohledem na jejich morfologické hodnocení a toto hodnocení prováděl včetně kvantifikačních metod. U prací mezioborového charakteru [40, 41, 42, 43, 45] jsem zodpovědný za celou anatomicko-histologickou část problematiky. U zbylých prací [30, 31, 32] jsem se podílel na histologickém vyšetřování materiálu, fotodokumentaci a kvantifikaci složení cévní stěny. Při sepisování uvedených publikací jsem postupoval podle etických zásad vědecké činnosti. Projekty a granty, jimiž bylo řešení jednotlivých prací podporováno, jsou v publikacích řádně citovány. Půjčování práce S dizertační prací je možné se seznámit na Oddělení pro vědu a vzdělání děkanátu Lékařské fakulty Univerzity Karlovy v Plzni nebo ve Středisku vědeckých informací téže fakulty. Souhlasím se zapůjčováním práce. V Plzni dne Zbyněk Tonar
7 Abstrakt Předkládaná práce je kompilací publikací zaměřených na kvantitativní hodnocení vzorků cévní stěny a na využití získaných dat pro základní výzkum aterosklerózy i aplikace v biomechanickém modelování elastických arterií. Úvod podává přehled o historickém vývoji kvantifikačních metod v mikroskopii, a to s důrazem na stereologii. Metodická část popisuje vybrané nejčastější postupy matematické morfologie a stereologie se způsoby výpočtu odhadu objemu, povrchu, plochy, délky a numerické hustoty objektů v tkáňových bločcích. Pozornost je věnována i problematice vzorkování histologických sérií, zdrojům variability a designu stereologické studie s ohledem na základní předpoklady současné morfometrie. Popsán je postup trojrozměrných rekonstrukcí vycházející ze skenování histologických sérií. Prokázali jsme význačnou roli zánětlivého procesu u pacientů s rupturou aneuryzmatu abdominální aorty (AAA), a to na úrovni zánětlivých ložisek infiltrujících neovaskularizované oblasti stěny ruptur AAA ve srovnání s asymptomatickými AAA. Histologický obraz zánětu odpovídal vyšším hladinám IL-6, IL-8 a TNF-α a zvýšení metabolizmu kolagenu typu III s převahou jeho degradace u ruptur AAA. U AAA dochází k význačnému poklesu objemové frakce kontraktilního fenotypu hladkých svalových buněk v tunica media, objemová frakce kolagenu je oproti normální aortě zvýšená a objemová frakce elastinu se pohybuje v rozpětí od nuly až k normálním hodnotám. Dlouhodobé podávání cholesterolem obohacené diety je u apolipoprotein E-deficientní (apoe-ko) myši spojeno s masivnějším rozvojem aterosklerotických změn hrudní aorty v důsledku akcelerovaného ukládání cholesterolu do cévní stěny. Studiem aterosklerotických lézí aortálního sinu jsme zjistili, že heterotopická transplantace srdce u apoe-ko myši není vhodným experimentálním modelem pro studium regrese aterosklerózy. Při dalším pokusu navodit regresi aterosklerotických lézí heterotopickou transplantací aorty u juvenilní apoe- KO myši došlo k transplantační arteritidě s tvorbou neointimy, elastinolýzou a infiltrací arteriální stěny T- a B-lymfocyty, makrofágy a neutrofily a proto tento model nepovažujeme za vhodný. Střední vzdálenost sousedních elastinových lamel na transverzálním řezu aortou prasete je větší u břišních nežli u hrudních segmentů týchž aort. Počítačová simulace s kompozitním modelem stěny aorty založená na histologické analýze ukázala, že význam reziduálního napětí mezibuněčné hmoty (elastinu) převažuje ve stěně arterie elastického typu nad tonusem hladkých svalových buněk. Model s reálnou geometrií lumen a stěny AAA založenou na CT-angiografii a s respektováním anatomických okrajových podmínek ukazuje vliv lokálních nepravidelností výdutě, vliv trombu, větvení a síly aortální stěny na distribuci napětí ve stěně AAA a na rychlostní profily proudící kapaliny během systolicko-diastolického cyklu. Za hlavní přínos kvantitativních metod v předkládané práci považujeme hodnocení morfologických vlastností tkáňových vzorků pomocí spojitých kvantitativních proměnných, což v kombinaci se systematickým a nestranným výběrem vzorků umožňuje aplikovat na porovnávané skupiny standardní statistické postupy a testy. K dalším problémům, které navrhujeme pomocí stereologické analýzy řešit, patří přestavba aortální stěny u modelu chronického renálního selhání potkana, hodnocení vlivu aplikace tkáňového lepidla v modelu disekce aorty a angioarchitektonika mikrocév v normálních a nádorově transformovaných lymfatických uzlinách. 5
8
9 Dissertation abstract The dissertation thesis consists of seventeen papers dealing with quantitative histological assessment of vascular wall and with application of morphometry in atherosclerosis research as well as in biomechanics of elastic arteries. History of microscopic morphometry with an emphasis on stereology is reviewed in the Introduction. The principles of mathematical morphology and of stereological estimation of volume, surface area, length, and numerical density of objects in tissue blocks are explained in the Methods. The key rules of unbiased sampling of histological series and designing morphometric studies are summarized. The distribution of the overall observed variance in biological experiments, its sources and management are discussed. Procedures necessary for three-dimensional reconstructions based on scanned histological series are described. We proved that inflammatory process was significant in patients with ruptured aneurysm of abdominal aorta (AAA). There were more pronounced inflammatory infiltrates in areas of neovascularization in ruptured AAA than in asymptomatic AAA patients. Histological findings were in agreement with higher cytosol cytokine levels (IL-6, IL-8, TNF-α), enhanced collagen III metabolism and degradation in ruptured AAA. We found lower volume fraction of the contractile phenotype of smooth muscle cells, higher volume fraction of collagen, and minimal to normal elastin volume fraction within the tunica media of AAA than in normal aorta. Apolipoprotein E-deficient (apoe-ko) mice fed with a cholesterol-rich diet for five months developed accelerated atherosclerosis of thoracic aorta with atherosclerotic lesions of higher volume than the group fed for two months only. In another study, heterotopic heart transplantation in apoe-ko mice didn t prove itself to be a reliable experimental model for study of atherosclerosis regression, although the lesions found in aortic sinus were more stable in some of the transplanted than in non-transplanted animals. In another study, no regression of initial atherosclerotic lesion was achieved by syngeneic heterotopic transplantation of thoracic aorta segments of 12-week-old apoe-ko mice to wild-type recipients of the same age. On the contrary, neointima formation, arteriosclerosis and degradation of elastin prevailed in all transplanted specimens, even in control groups. It was suggested that the minute and sensitive wall of juvenile aorta suffered from severe disturbance of vasa and nervi vasorum caused by the invasive intervention in the transplanted animals, so that it became vulnerable to inflammation and transplant arteriopathy. The reproducibility of the promising regression model in 12-week-old mice was derogated by the striking dependence of the results upon the operation technique. Thoracic to abdominal aorta transplantation did not offer a method which would enable us to study atherosclerosis regression in 12- week-old apoe-ko mice. The mean distance between adjacent elastic lamellae was higher in paired transversal sections through abdominal than thoracic segments of porcine aortae. Volume fraction of elastin within tunica media did not differ between paired samples of thoracic and abdominal porcine aorta. We assessed volume fractions of collagen and smooth muscle, as well as elastin length density in porcine aorta. Computer simulation performed with a composite model of aortic wall and based on histomorphometry suggested that in the aorta the residual strain in the extracellular matrix (mainly in elastin fibres) was much more important for the proper function of the arterial wall than the tone of smooth muscle cells. In another paper, morphometric analysis succeeded mechanical uniaxial traction tests in order to supply a two-layer composite mathematical model of the aorta with sufficient data. 7
10 A three-dimensional geometry model of canine heart ventricles considering anisotropy of the cardiac muscle was presented. Simulation of excitation of the cardiac conducting system and myocytes was done with cellular automata and coupled with a finite element model of heart mechanics. We developed a computer model of the blood flow and vascular wall mechanics in AAA. Morphology of the model including its boundary conditions was based on real patientspecific geometry data obtained with computer tomography. Dependence of wall stress contours and velocity profiles upon the realistic geometry of vessel lumen, thickness of arterial wall and intramural thrombus, and branching was simulated during the cardiac cycle. This approach was suggested to be suitable for follow-up study of patients with high surgical risk but smaller aneurysms observed for the aneurysm growth, where simulations could be correlated with surgeon s clinical experience. Stereological quantification of microscopic structure of blood vessels was found reliable, and reproducible. Most of the stereological methods used nowadays had been designed as unbiased, and assumption-free. Description of morphological properties of tissue specimen with use of continuous variables and systematic unbiased sampling permitted us to apply standard statistical procedures and tests to morphometric data. Due to our experience, stereological quantification might be useful for other topics of vascular research, e.g. for describing histology of hypertensive aorta remodelling in a model of chronic renal failure in rats, for assessment of alteration of aortic wall caused by application of biological glues into a model of aortic dissection, or for description of angioarchitectonics of microvessels in normal and tumourous lymph nodes. 8
11 Obsah 1 Seznam zkratek a symbolů 10 2 Přehled problematiky a cíle práce Historie kvantifikace v mikroskopii a přehled literatury Základní východiska stereologie Unbiased stereology Variabilita výsledků a optimalizace biologických studií Přehled otázek a hypotéz dizertační práce Metody kvantitativního popisu cévní stěny Studium aterogeneze a jejích komplikací Morfometrie a 3-D rekonstrukce v biomechanice cévní stěny Metody Analýza obrazu Matematická morfologie Stereologie Odhady ploch a objemů bodovými testovacími mřížkami Odhad délek pomocí rovin ve 3-D a lineárními sondami ve 2-D Odhady povrchu a povrchové hustoty Mikrovazální hustota Odhady numerické hustoty částic disektorem Přímý odhad počtu objektů pomocí optického frakcionátoru Vzorkování Hodnocení koeficientu chyby Trojrozměrné rekonstrukce Rekonstrukce ze série histologických řezů Literatura pro úvodní a metodickou část 27 5 Publikované výsledky Soupis publikovaných prací Závěr Hlavní výsledky a nálezy Metody kvantitativního popisu cévní stěny Studium aterogeneze a jejích komplikací Morfometrie a 3-D rekonstrukce v biomechanice cévní stěny Možné pokračování výzkumu
12 1 Seznam zkratek a symbolů Není-li kodifikován závazný a jednoznačný český překlad původně cizojazyčného termínu, resp. je-li to vhodné pro pochopení symbolu či zkratky, uvádíme ve vybraných případech i původní anglickou terminologii tak, jak se obvykle vyskytuje v publikacích. 0-D bodový, bezrozměrný 1-D jednorozměrný 2-D dvojrozměrný 3-D trojrozměrný a konstanta bodové testovací sítě, plocha příslušející statisticky jednomu bodu sítě; u disektoru odpovídá ploše hodnotícího rámečku (m 2 ) A plocha (area, surface area) (m 2 ) A A plošná frakce hodnocené složky v referenční ploše vzorku (area per area, area fraction) AAA aneuryzma abdominální aorty apoe-ko apolipoprotein E-deficience (knock out) asf podíl plochy hodnotících rámečků vůči celé ploše řezů v druhém stupni vzorkování optického frakcionátoru (area sampling fraction) CE koeficient chyby (coefficient of error), poměr druhé odmocniny z rozptylu a aritmetického průměru výběru CE n (GJ) koeficient chyby (CE) podle Gundersena a Jensenové CT výpočetní tomografie (computer tomography) CV variační koeficient (coefficient of variation), poměr směrodatné odchylky populace k populačnímu průměru d, d síla histologického řezu (m) D rozměr (dimension) est odhad kvantitativního parametru (estimate, estimation) f obecné označení pro podíl (frakci) konečného výběru hodnoceného objemu v celkovém objemu vzorku φ úhel rotace bločku kolem vertikální osy u VUR řezů ( ) FFT rychlá Fourierova transformace (fast Fourier transform) h celková výška disektoru (m) H 0 nulová hypotéza hsf podíl výšek optických disektorů vůči celé výšce řezů ve třetím stupni vzorkování optického frakcionátoru (height sampling fraction) I i I L počet průsečíků povrchu s lineární sondou pro obrázek s indexem i počet průsečíků povrchu s lineární testovací sondou IL-6, IL-8 interleukin 6 a 8 ISS International Society for Stereology 10
13 IUR izotropní uniformní náhodné řezy (isotropic uniform random) l délka profilu trhliny v řezu (m) L celková délka (m) L A délková hustota profilů objektů v řezu (intensity of planar fibre process) (m 1 ) L L délkový podíl (length per length) l/p délka testovací linie připadající na bod mřížky (length per point) (m) L V délková hustota (length density) (m 2 ) m počet řezů vybraných z histologické série k hodnocení Cavalieriho metodou MRI magnetická rezonance (magnetic resonance imaging) MVD mikrovazální hustota (microvessel density) (m 2 ) ˆN celkový počet hodnocených objektů ve vzorku N V numerická hustota (numerical density) (m 3 ) p počet bodů pomocné mřížky v disektoru P počet průsečíků testovací sítě s hodnoceným objektem P i P L P L počet bodů pomocné bodové mřížky zasahujících referenční prostor obrázku s indexem i teoreticky vypočtený počet průsečíků profilu trhliny na řezu s profily hodnocené složky cévní stěny skutečně pozorovaný počet průsečíků profilu trhliny na řezu s profily hodnocené složky cévní stěny Q počet objektů Q počet částic započítaných v disektoru Q A počet profilů objektů v řezu o ploše A (m 2 ) RAAA ruptura aneuryzmatu abdominální aorty ROI oblast zájmu, např. definovaná uživatelem v obraze nebo v sérii obrazů (region of interest) suma S povrch (topologický útvar), jehož kvantitu lze vyjádřit plochou povrchu (viz plocha, surface area, m 2 ) SD směrodatná odchylka výběru (standard deviation) ssf podíl řezů z celého vzorku v prvním stupni vzorkování optického frakcionátoru (section sampling fraction) SURS systematický uniformní náhodný výběr (systematic uniform random sampling) S V povrchová hustota (surface density) (m 1 ) T vzdálenost mezi dvěma sousedními hodnocenými řezy [m] θ odklon od vertikální osy u techniky VUR řezů ( ) TNF-α tumor necrosis factor-α V objem (volume) (m 3 ) 11
14 VEGF A-20 vascular endothelial growth factor A-20 V (ref) referenční objem (m 3 ) V V objemová frakce hodnocené složky v referenčním objemu vzorku (volume per volume, volume fraction) VUR vertikální uniformní náhodné řezy (vertical uniform random) WT zvířata bez cílené mutace s genotypem a fenotypem běžným pro daný druh, resp. bez známé mutace, která by měla vztah ke studovanému problému (wild type) x aritmetický průměr výběru XY horizontální osy posuvu stolku mikroskopu Z vertikální osa posuvu stolku mikroskopu 12
15 2 Přehled problematiky a cíle práce 2.1 Historie kvantifikace v mikroskopii a přehled literatury Základní východiska stereologie Historický vývoj kvantitativních metod v mikroskopických oborech se z velké části kryje s vývojem stereologie [1, 17]. Tento termín vychází z řeckého stere c, což lze přeložit jako tuhý, pevný, prostorový. Přestože jako obor se v mezinárodní komunitě biologů, geologů a pracovníků v analýze materiálů etabluje od počátku 60. let 20. století, její kořeny sahají hlouběji. Stereologie vychází z geometrie, jejíž poznatky aplikuje na analýzu vzorků rozmanitého původu, velikosti a vnitřní struktury. Zabývá se statistickým odvozováním geometrických vlastností hodnocených struktur a objektů z aplikace testovacích sond na orientované řezy vzorkem. Jedním ze základních problémů, které motivovaly rozvoj stereologie, byly diskuze nad možnostmi kvantitativního hodnocení trojrozměrných (3-D) objektů na základě studia jejich dvojrozměrných (2-D) řezů či výbrusů. Přestože záběr moderní stereologie je v současnosti širší a pochopení jejího teoretického zázemí vyžaduje vhled do některých oblastí matematiky, zůstává jedním z nezbytných nástrojů v interpretaci informací obsažených v sériích fyzických či optických řezů pořízených různými mikroskopickými technikami. Šedesátá léta 20. století jsou považována za první dekádu moderní historie stereologie. Při lepší dostupnosti kvalitní a korigované optiky, s rozvojem imunocytochemie a elektronové mikroskopie rostl význam kvantitativního hodnocení popisovaných mikrostruktur. V roce 1961 byla založena International Society for Stereology (ISS). Své aplikace si rychle nacházely již v minulosti popsané postupy: Bonaventura Cavalieri, student Galilea Galileiho, formuloval r postup umožňující dostatečně přesný odhad středního objemu těles pomocí součtu ploch, která tělesa zaujímají na sérii ekvidistantních řezů. Cavalieriho princip říká, že mají-li dvě tělesa stejnou základnu a stejný profil na řezech paralelních se základnami v téže výšce u obou těles, pak je objem těchto těles totožný (dále viz oddíl 3.2.1, str. 19). Hrabě George-Louis Leclerc Buffon popsal r tzv. problém Buffonovy jehly, v němž popisoval vztah mezi pravděpodobností vzniku průsečíku náhodně hozené jehly (hůlky) se systémem paralelních ekvidistantních spár v podlaze, na niž jehly dopadly, délkou jehel (hůlek) a rozestupem spár. V modifikované podobě [25] je princip užíván k odhadu plochy a délky objektů (dále viz oddíl 3.2.2, str. 19). Geolog Achille Delesse v r popsal empirickou techniku pro odhad objemových frakcí minerálů v hornině na základě plošných podílů těchto minerálů na výbrusu horninou (dále viz oddíl 3.2.1, str. 19). V r byl Delesseho přístup doplněn rovněž empirickým Rosiwalovým pravidlem usnadňujícím odhad plošných podílů pomocí praktičtějších podílů délkových Unbiased stereology V 70. letech 20. století přibývá stereologických prací v Journal of Microscopy a Acta Stereologica (nyní Image Analysis & Stereology). S přispěním matematiků se ukazuje, že řada kvantitativních studií v biologii obsahuje nepodložené a obtížně ověřitelné předpoklady o tvarech hodnocených objektů, resp. že se tyto předpoklady často neshodují se 13
16 skutečností. Strategie oprav těchto předpokladů různými korekčními faktory je postupně opouštěna a nahrazována teoreticky podloženější stochastickou geometrií a implementací teorie pravděpodobnosti do popisu biologických objektů. Stereologické postupy postavené na tomto novém základě a využívající nevychýlené vzorkování (unbiased sampling) dávají vznik škálově univerzálnějším kvantifikačním technikám nezatíženým a priori předpoklady o povaze studovaného materiálu (assumption-free, model-free unbiased methods). Tento přístup je souborně v literatuře označován jako unbiased stereology. Termínem stereologický bias je označována odchylka výsledků od skutečné hodnoty vzniklá vlivem systematické chyby. Metody unbiased stereology se vyznačují tím, že nárůstem počtu hodnocených vzorků ve studii klesá rozptyl výsledků kolem centrální tendence, která není od skutečné, pravdivé hodnoty na rozdíl od unbiased metod vychýlena (toto tvrzení se vztahuje jen na bias stereologický, nikoliv např. na chybnou volbu metody a zpracování vzorků, vliv artefaktů apod.). V 80. letech 20. století je řešena jedna ze základních otázek stereologie problém spolehlivého a univerzálního počítání trojrozměrných objektů z dvojrozměrných řezů. Jak formuloval S. D. Wicksell v r [26], počet profilů v jednotce plochy histologického řezu neodpovídá počtu reálných trojrozměrných objektů v objemu tkáně. Tato teze je známa pod pojmem the corpuscle problem. Podstatou problému je skutečnost, že různé objekty mají v závislosti na svém tvaru, velikosti a orientaci odlišnou pravděpodobnost výskytu v rovině řezu konkrétně velké objekty komplexního tvaru a s dlouhou osou směřující kolmo na rovinu řezu mají vyšší pravděpodobnost, že budou ve 2-D hodnocení zachyceny a započítány, nežli odpovídá jejich skutečnému podílu na celkovém počtu objektů v 3-D vzorku. Snahy řešit tento rozpor matematickými faktory korigujícími heterogenitu rozměrů, orientace a asféricitu objektů však opět vnášely do metodiky obtížně ověřitelné modelové předpoklady a byly tak potenciálně zdrojem systematické chyby [16]. Kritický rozbor hojně používané Abercrombieho metody a dalších empirických postupů přináší [9]. Za situace, kdy síla histologických řezů není vzhledem k rozměrům hodnocených částic zcela zanedbatelná, se navíc uplatňuje projekce hlubších částí netransparentních měřených objektů do pozorované roviny a nadhodnocení maximálních rozměrů profilů částic (tj. síla řezu ovlivňuje pozorované rozměry objektů, tzv. Holmesův efekt). Nejen z těchto důvodů je ve stereologii zvykem terminologicky rozlišovat částečně transparentní a trojrozměrný histologický řez určité síly (slab, slice) a idealizovanou dvojrozměrnou projekci struktur do roviny řezu (section). Řešení problému, které je anglicky publikováno v r jako princip disektoru [23], je první robustní, modelovými předpoklady a korekčními faktory nezatíženou metodou pro odhad počtu objektů v objemové jednotce tkáně. Princip je i s potřebným aparátem popsán v oddílu (str. 21). V roce 1985 je publikována technika jiné stereologické objemové sondy, tzv. unbiased brick [11], která slouží ke stejnému účelu jako disektor, ovšem postupuje podle odlišných pravidel, která jsou 3-D rozšířením 2-D nevychýleného hodnotícího rámečku (unbiased counting frame) (3.2.4, str. 21) publikovaného již dříve [3]. Kombinace disektoru se systematickým vzorkováním přinesla techniku frakcionátoru (fractionator) [4] k odhadu celkového počtu mikroskopických objektů v makroanatomických vzorcích nezávisle na objemových změnách způsobených fixací a zaléváním do médií pro krájení. K dalším technikám zavedeným v tomto období patří odhad velikosti částic aplikací sondy zvané nukleátor (nucleator) na izotropní či vertikální uniformní řezy a odhad objemově váženého středního objemu objektů [6]. Zkušenost ukázala, že je zapotřebí respektovat minimální součet dimenzí (D) testovaných objektů (bodů, linií, ploch, těles) a použitých stereologických sond tak, aby byl větší nebo roven třem: ke kvantifikaci objemů 14
17 (3-D) se tak používá bodová testovací síť (0-D), ke kvantifikaci povrchů (2-D) lineární testovací systém (1-D), odhad délek (1-D) se provádí pomocí systému rovin (2-D) a odhad počtu objektů (0-D) s využitím objemových testovacích systémů (3-D) Variabilita výsledků a optimalizace biologických studií U novějších stereologických metod se již nevyskytovala ta část variability výsledků, která by byla způsobená různou mírou plnění modelových předpokladů o povaze analyzovaných tkání, protože výše prezentované metody tyto předpoklady již neobsahovaly. Tím se otevřela cesta k podrobnějšímu studiu variability dat [5, 8] a ukázalo se, že variabilitu dat (posuzovanou např. pomocí variačního koeficientu, CV) lze rozdělit na složky rozdílného původu: Biologická variabilita zahrnuje rozdíly interindividuální (mezi zkoumanými jedinci), jež mohou být způsobeny kombinací evolučních faktorů, genotypu, vlivu prostředí apod., a obvykle představuje hlavní zdroj variability dat v biologických studiích. S rostoucím počtem jedinců zkoumaných v dané populaci její vliv klesá. Variabilita způsobená výběrem vzorků pocházejících z téhož individua (intraindividuální, sampling error) se vyjadřuje pomocí koeficientu chyby výběru (CE). Lze ji redukovat navýšením počtu tkáňových bločků či řezů vybraných k analýze, což je zpravidla ekonomičtější nežli navyšovat počet jedinců ve studii a snižovat tak variabilitu biologickou. Samostatné posouzení těchto dvou složek umožňuje optimalizovat design studie a zvyšovat její efektivitu. Na otázku jaký je optimální počet zkoumaných jedinců a histologických řezů potřebný pro spolehlivou stereologickou kvantifikaci daného parametru? lze pak odpovědět: takový, jehož způsob výběru (jedinců, řezů) nejefektivněji snižuje celkovou variabilitu výsledných dat vztaženou na čas a náklady spotřebované na analýzu. V praxi se osvědčuje např. tento postup: objem vzorku obsahující kvantifikované objekty je zpracován do cca 10 systematických náhodných řezů, je provedena kvantifikace a tento proces se zopakuje na 2 3 jedincích pro každou z porovnávaných skupin. Pilotní výsledky umožňují odhadnout příspěvek biologické variability a variability způsobené vzorkováním. Po nalezení takové hodnoty CE, kdy další zpřesňování výběru již nevede k významnému poklesu variability, je vhodné navýšit počet hodnocených jedinců ve studii (obvykle 5 až 10 v každé skupině) a hledat odpověď např. na otázku, zda mezi porovnávanými skupinami je kvantitativní rozdíl v daném mikroskopickém parametru (např. počet buněk v orgánu etc). Popsaný přístup bývá označován též jako Do more, less well [7]. Od devadesátých let do současnosti popularita stereologie i počet jejích aplikací v biologickém výzkumu stoupá a s ní i dostupnost kurzů pořádaných např. Society For Neurosciences, International Brain Research Organization, International Society for Stereology, European Molecular Biology Organization aj. Nárůst stereologických publikací v recenzovaných časopisech od 60. let do konce 20. století je přibližně exponenciální. Zvyšuje se dostupnost software i hardware pro stereologii (motorizovaný XY- i Z-posuv, digitální snímání obrazu, konfokální mikroskopie). Další literární zdroje jsou pak citovány u konkrétních sdělení předkládaných v této dizertační práci [29] [45]. 15
18 2.2 Přehled otázek a hypotéz dizertační práce Cílem publikací obsažených v předkládané dizertační práci bylo odpovědět na následující otázky a testovat dále uvedené hypotézy Metody kvantitativního popisu cévní stěny 1. Jak závisí aplikovatelnost, reprodukovatelnost, variabilita výsledků a možná míra automatizace metod obrazové analýzy a stereologie na strategii a technice histologického zpracování tkáňových bločků [29]? Studium aterogeneze a jejích komplikací 2. Které z morfometrických postupů jsou aplikovatelné jako zpřesnění histopatologické klasifikace aterosklerózy podle Stary a American Heart Association [20, 21, 22] se zaměřením na posouzení vulnerability aterosklerotických lézí [29]? 3. Existují rozdíly v histologickém nálezu u vzorků cévní stěny symptomatického nebo rostoucího, resp. praskajícího aterosklerotického aneuryzmatu abdominální aorty (AAA) člověka [30, 31, 32]? Souvisí histologický nález s cytoplazmatickými hodnotami zánětlivých cytokinů a metabolizmem kolagenu typu III? 4. Jak se liší objemová frakce hladkých svalových buněk, elastinu a kolagenu v tunica media normální subrenální aorty a aneuryzmatu břišní aorty člověka? Je Fourierova transformace (FFT) mikrofotografií pořízených při standardizovaném zvětšení nástrojem umožňujícím odlišení morfologie elastinu ve stěně aorty normální, postižené aterosklerotickými lézemi a postižené rozvojem aneuryzmatu [33]? 5. Je heterotopická transplantace srdce u apolipoprotein E-deficientní (apoe-ko) myši vhodným modelem pro studium regrese aterosklerózy aortálního sinu a koronárních arterií [34]? 6. Jaká je závislost rozsahu aterosklerotického poškození hrudní descendentní aorty apoe-ko myší na délce podávání cholesterolem obohacené diety [35]? 7. Je syngenní heterotopická transplantace aorty u juvenilní apolipoprotein E-deficientní myši vhodným modelem pro studium regrese aterosklerotických lézí [36, 37]? Morfometrie a 3-D rekonstrukce v biomechanice cévní stěny 8. Je FFT vhodnou metodou k popisu rozdílu morfologie elastinové sítě v hrudních a břišních segmentech téže aorty u prasete? Existují rozdíly mezi morfologií elastinu ventrální a dorzální stěny aorty prasete, které lze detekovat pomocí FFT? Je síla lamelární jednotky tvořené sendvičovitě uspořádanými komplexy elastin-kolagenmyocyt-elastin stejná v hrudní a břišní aortě týchž jedinců [38, 39]? 9. Jaká je objemová frakce hladkých svalových buněk, elastinu a kolagenu, jaká je síla stěny a úhel rozevření vlivem předpětí ve stěně hrudní a břišní aorty prasete a jak lze uplatnit tato data v modelování stěny elastických arterií [40, 41, 42]? 16
19 10. Jaký je vhodný přístup pro vazbu mezi modelem šíření vzruchové aktivity myokardem a konečněprvkovým modelem svaloviny srdečních komor s respektováním anizotropního uspořádání vrstev kardiomyocytů [43]? 11. Jak vhodným způsobem modelovat distribuci napětí cévní stěny a rychlostních profilů proudící kapaliny v závislosti na reálné geometrii modelu vakovitého aneuryzmatu břišní aorty s implementací interakce mezi stěnou a kapalinou? Je možné odhadnout vliv asymetrického intramurálního trombu na další vývoj aneuryzmatu [44, 45]? 17
20 3 Metody 3.1 Analýza obrazu Pro přehled uvádíme vybrané nejčastější postupy spadající pod skupinu operací prováděných nad obrazem (image processing), kdy vstupem jsou vlastní obrazová data a výstupem je modifikovaný obraz nebo popis vlastností vstupního obrazu. Většina metod přistupuje k obrazu jako ke dvojrozměrným datům, a to standardizovanými postupy analýzy digitálního signálu. Problémů, jimiž se analýza obrazu zabývá, je veliké množství, ať už se jedná o rozlišení, dynamický rozsah, šířku pásma a bitovou hloubku, filtrace, Fourierovu transformaci, aplikaci operátorů diferenciálního počtu, detekci hran, redukci šumu, konektivitu, geometrické transformace, úpravy barev a konverze mezi barevnými prostory, vzájemnou registraci (sesazování) více obrázků, logické operace mezi obrázky, segmentaci, retuš apod. Kromě statických 2-D obrázků lze ke zpracování obrazu řadit i jejich série pořízené v čase (např. time-lapse techniky) či v různých místech zkoumaného objektu (např. tomografie). Přehled i detailní informace o metodách lze čerpat např. z monografií [15, 18, 28] Matematická morfologie Při zpracování obrazu je častým úkolem segmentace, tj. odlišení oblastí či objektů našeho zájmu od námi definovaného pozadí. Takto segmentovaný či naprahovaný obraz je možné např. pomocí masek binarizovat a dále zpracovávat jako obraz binární (tj. takový digitální obraz, jehož každý pixel má právě dvě možné hodnoty) pomocí metod matematické morfologie. Základní pojmy matematické morfologie jsou: eroze ubrání šířky objektu, dilatace přidání slupky objektu, otevření eroze následovaná dilatací, maže malé objekty a rozpojuje částice spojené tenkou šíjí, zavření dilatace následovaná erozí, vyhladí obrysy, zaplní malé trhliny, spojí blízké objekty, homotropické transformace na rozdíl od předchozích čtyř operací nemění spojitost objektů a děr; typickými příklady jsou operace skeletonizace, homotypické značkování a zesílení. Eroze, dilatace, otevření a zavření jsou definovány typem matice (kernel, tj. strukturní element v bitmapě, s nímž operaci provádíme) a počtem iterací (tj. údajem, kolikrát za sebou bude operace provedena). Aplikování transformací matematické morfologie v analýze počítačových obrazů je omezeno diskrétním vzorkováním spojitého analogového signálu, k němuž dochází při snímání digitálního obrazu, a z toho vyplývajících vlastností obrazu jako je např. typ mřížky a konektivita pixelů, blíže viz [28]. 3.2 Stereologie Protože aplikace stereologických metod v cévní biologii jsou rozebrány i s příklady v přehledném článku [29], na tomto místě uvádíme pouze způsoby výpočtu jednotlivých kvantitativních parametrů. Ke studiu odvození některých vztahů a širších souvislostí lze doporučit monografie [10, 17, 19]. 18
21 3.2.1 Odhady ploch a objemů bodovými testovacími mřížkami Odhad plochy v rovině řezu pomocí bodové testovací sondy (mřížky), rovnice 1: est A = a P, (1) kde est A je odhad plochy měřeného objektu, a je parametr použité testovací sítě (plocha příslušející jednomu testovacímu bodu) a P je počet průsečíků sítě s hodnoceným objektem. Delesseho princip plošný podíl A A dává odhad objemového podílu V V téže složky, rovnice 2: est A A = est V V. (2) Rosiwalovo pravidlo plošný podíl A A je roven délkovému podílu L L, rovnice 3: est A A = est L L. (3) Výpočet odhadu objemu podle Cavalieriho principu, rovnice 4: est V = T (A 1 + A A m ), (4) kde est V je odhadnutý objem, T je vzdálenost mezi dvěma sousedními hodnocenými řezy, A i je plocha odhadnutá u i-tého řezu při počtu m hodnocených řezů Odhad délek pomocí rovin ve 3-D a lineárními sondami ve 2-D Délková hustota je vhodným vyjádřením délek biologických struktur ve známém objemu tkáně a a lze ji vyjádřit jako L V (Y, ref) dle rovnice 5: L V (Y, ref) = L(Y ) V (ref), (5) kde L(Y ) je délka objektů Y v referenčním prostoru o objemu V (ref). Dvojrozměrným testovacím systémem použitelným k tomuto odhadu je množina izotropních systematických náhodných rovin (IUR, isotropic uniform random sections), které zachytí hodnocený objekt s pravděpodobností přímo úměrnou jeho délce. V systému těchto řezů odhadujeme délkovou hustotu dle rovnice 6: est L V = 2 S V Q A, (6) kde Q A je počet profilů zachycených systémem rovin v objemu vymezeném těmito rovinami a S V je plošná hustota testovacích rovin. Odhad délek lineárních struktur ve 2-D lze s výhodou provést pomocí modifikované Buffonovy metody, při níž je délka objektů odhadována z počtu průsečíků testovacího systému (linie či křivky) s hodnocenými vláknitými objekty. V rámci řezů pak lze vyjadřovat i délkovou hustotu hodnocených profilů v řezu (intensity of planar fibre process) L A dle rovnice 7: L A = L A, (7) kde L je odhad délky a A je referenční plocha řezu, v níž se dané lineární struktury vlákna vyskytují a v níž odhad provádíme. 19
22 3.2.3 Odhady povrchu a povrchové hustoty Povrchová hustota je často užívaným kvantitativním parametrem ploch v objemovém elementu vzorku a je definována podle rovnice 8: S V (Y, ref) = S(Y ) V (ref), (8) kde S V (Y, ref) je povrchová hustota plochy povrchu S(Y ) v referenčním objemu V (ref). Odhad povrchové hustoty vyžaduje aplikaci lineárních sond na izotropní uniformní náhodně orientované (IUR) nebo vertikální uniformní (VUR) řezy, kdy výsledek získáme dle rovnice 9: est S V = 2I L, (9) kde I L je počet průsečíků povrchu s lineární testovací sondou. Při použití většího počtu obrázků k odhadu povrchové hustoty počítáme tento parametr dle rovnice 10: est S V (Y, ref) = 2 n i=1 I i l/p n i=1 P, (10) i kde S V (Y, ref) je povrchová hustota povrchu S(Y ) v referenčním objemu V (ref), I i je počet průsečíků povrchu se sondou pro obrázek s indexem i, P i je počet bodů pomocné bodové mřížky zasahujících referenční prostor obrázku s indexem i a l/p je délka l testovací linie připadající na bod p pomocné mřížky. Předpokladem pro tento odhad povrchu je náhodnost orientace řezů, tj. testovací linie prokládané vzorkem musí být izotropní IUR či VUR řezy. Z praktických důvodů je často vhodnější namísto zcela izotropních řezů připravovat VUR řezy, které však již nejsou izotropní ve 3-D, ale jen v horizontální rovině. Izotropii zajistíme v arbitrárně zvolené horizontální rovině rotací kolem zvolené vertikální osy o náhodný úhel φ (Obr. 1). Horizontální rovinu si u dané série vzorků sami volíme a termíny horizontální a vertikální nemají žádný vztah k anatomickým rovinám. Vzorek pak krájíme systematickými řezy kolmo na horizontální rovinu. Vertikální rovina, kterou jsme preparát prokrájeli, zasáhne s vyšší pravděpodobností horizontální plochy, nežli vertikálně orientované plochy. Abychom toto vychýlení vyrovnali, potřebujeme použít takové testovací linie, jejichž délková hustota je úměrná sinθ, kdy θ je odklon od vertikály a průběh těchto linií je spíše horizontální nežli vertikální. Takové vlastnosti splňují křivky zvané cykloidy (Obr. 2), jsou-li orientovány svou kratší osou paralelně se zmíněnou vertikální osou. Kombinace roviny generované VUR otočením o úhel φ a aplikací sítě cykloid odpovídá použití izotropního čárového testovacího systému. VUR řezy můžeme s výhodou použít současně s určováním plochy i k odhadu objemů Cavalieriho metodou, která nevyžaduje náhodnou orientaci řezů. 20

23 Obr. 1: Princip vertikálních náhodných řezů pro odhad povrchu a objemu (VUR). Při abitrárně zvolené horizontální rovině je provedena rotace bločku (cévy) o náhodný úhel φ kolem vertikální osy. Řezná rovina při histologickém zpracování je pak kolmá na rovinu horizontální. Obr. 2: Geometrické vlastnosti cykloidy Mikrovazální hustota Při kvantifikaci kapilár, pre- a postkapilár ve větších tkáňových bločcích je vhodné přes trojrozměrnou povahu cév použít dvojrozměrné kritérium míry jejich přítomnosti, tzv. mikrovazální hustotu (microvessel density), kterou lze stereologicky vyjádřit jako parametr Q A podle rovnice 11: Q A = Q A, (11) kde Q je počet profilů mikrocév zachycených na řezu o referenční ploše A. Pravidlo k započítání profilů objektů ve 2-D je znázorněno na Obr. 4. Plochu hodnotícího rámečku známe z kalibrace, event. ji můžeme při nepravidelnostech obrysů referenční plochy hodnotit bodovou testovací mřížkou Odhady numerické hustoty částic disektorem Disektor je stereologická objemová testovací sonda k počítání objektů v referenční objemové jednotce. Z počtu objektů a znalosti referenčního objemu můžeme odhadnout jejich numerickou hustotu. Dodržení pravidel disektoru zaručuje výsledek nevychýlený (unbiased) rozdíly ve velikosti a orientaci počítaných objektů (např. buněk). V závislosti na technice pořízení řezů rovinami tkáňového bločku lze použít disektor: fyzický založený na obrazech dvou či více fyzických řezů registrovaných v ose Z, optický postupným proostřováním preparátu procházíme jednotlivé roviny, v nichž počítáme jednotlivé objekty. Výpočet odhadu hustoty provádíme podle rovnice 12: est N v (par) = n i=1 Q i (par) n i=1 P i(ref) p a h, (12) kde est N v(par) je odhad (estimátor) počtu částic v objemové jednotce referenčního prostoru, Q (par) je počet částic započítaných v disektoru, P i (ref) je počet bodů 21

24 mřížky připadající na referenční prostor, p celkový počet bodů pomocné mřížky, a plocha hodnotícího rámečku a h je celková výška disektoru. Grafické znázornění bočního pohledu na 3-D sérii řezů disektoru podává Obr. 3. V rovině jednotlivých řezů se pak aplikuje počítací pravidlo shodné s 2-D hodnotícím rámečkem, jak je popsáno u Obr. 4. Obr. 3: Schéma disektoru pro hodnocení hustoty buněk v objemu tkáně zpracované do histologických řezů či s nasnímáním řezů optických. Boční pohled na 11 řezů (při zvolené výšce řezu d), resp. 21 řezů (při výšce d ). Spodní rovina je referenční, horní náhledová. Započítáváme jen ty částice, které neprotínají náhledovou rovinu a leží alespoň částečně uvnitř disektoru o výšce h (buňky A, B, D, E). Výšku řezu je nutno volit s ohledem na nejmenší rozměry hodnocených buněk. Při chybné volbě síly řezu d bychom objekt E nezaznamenali. Obr. 4: Schéma mikrofotografie s profily několika objektů (např. krevních cév) a s projekcí hodnotícího rámečku sestávajícího ze dvou povolených (zeleně) a dvou zakázaných (červeně) linií. Kolem rámečku je ještě bezpečnostní pásmo umožňující vyhodnotit event. kontakt profilů s prodloužením zakázaných linií směrem vzhůru i dolů do nekonečna. Započítány jsou profily vyznačené šedě, které plně spadají dovnitř rámečku nebo protínají povolené linie a současně neprotínají linie zakázané. 22

25 3.2.6 Přímý odhad počtu objektů pomocí optického frakcionátoru Technika disektoru umožňuje odhad počtu částic v referenčním prostoru přepočtem z jejich numerické hustoty. V případě, že jediným parametrem významným pro biologickou otázku je prostý počet mikroskopických objektů, je metodou volby optický frakcionátor jakožto kombinace optického disektoru (viz oddíl 3.2.5, str. 21) a jedno- či víceúrovňového vzorkování (oddíl 3.2.7, str. 23). Aplikace frakcionátoru je obvykle trojstupňová: 1. Celý vzorek je zalit do média umožňujícího jeho kompletní rozkrájení na řezy. Část řezů vybraných k dalšímu hodnocení tvoří známý podíl (frakci) označenou ssf (section sampling fraction) a hodnota tohoto podílu je známa. 2. V každém z vybraných řezů jsou pomocí optického disektoru spočítány hodnocené objekty. Podíl ploch 2-D hodnotících rámečků disektoru vůči ploše řezů je označen asf (area sampling fraction) a je znám. 3. Podíl výšky disektoru a síly řezu je označen hsf (height sampling fraction). Celkový počet hodnocených objektů ve vzorku ˆN pak odhadujeme podle rovnice 13: est ˆN = Q f = Q ssf asf hsf, (13) kde Q je celkový počet objektů započítaných v optických disektorech, f je obecné označení pro podíl konečného výběru hodnoceného objemu v celkovém objemu vzorku a hsf, asf a ssf jsou podíly rozepsané v jednotlivých stupních vzorkování Vzorkování Systematický uniformní náhodný výběr (SURS) je vhodné provádět na každé úrovni odběru, kdy dochází k redukci, resp. vzorkování odebrané tkáně z makroskopického orgánu, redukci počtu hodnocených histologických řezů, či výběru zorných polí pořizovaných silnějším objektivem v rámci jednoho histologického řezu. Obr. 5: Schéma příkladu systematického uniformního náhodného výběru. Pozice prvního vzorku v sérii je určena náhodným číslem. Pozice dalších vzorků jsou ekvidistantní vzhledem k prvnímu. Hustota výběru vzorků se řídí požadovaným koeficientem chyby (viz oddíl 3.2.8, str. 24). Rozptyl SURS je vždy minimálně stejný jako u prostého náhodného výběru, většinou je však význačně nižší. 23
26 3.2.8 Hodnocení koeficientu chyby Koeficient chyby (CE) je užitečnou mírou variability, která je pro základní soubor definována rovnicí 14: CE =. (14) SD x Posouzení variability Cavalieriho řezů prostorově korelovanými objekty je možné provést hodnocením variability způsobené výběrem (sampling error) odhadem CE (rovnice 15, 16) dle Gundersena a Jensenové [5]: est CE n (GJ) = 1 3a + c 4b, (15) ai 12 kde koeficienty a, b, c jsou definovány jako: a = n n 1 n 2 A i A i, b = A i A i+1, c = A i A i+2. (16) i=1 i=1 i=1 Využití délkové hustoty pro analýzu trhlin Při analýze průběhu ruptury či disekce cévní stěnou lze s výhodou použít znalosti délkové hustoty profilů jednotlivých složek cévní stěny na řezu L A k mikroskopickému posouzení toho, kterou ze složek se trhlina preferenčně šíří. Lze postupovat testováním nulové hypotézy H 0 : Ruptura či disekce probíhá cévní stěnou náhodným způsobem, tj. bez preferenčního průběhu napříč určitými strukturami (např. elastinovými vlákny). Z odhadu referenční hodnoty délkové hustoty profilů objektů v řezu lze podle rovnice 17 [24] vypočítat teoretický počet průsečíků trhliny s danou strukturou (např. s elastinovými vlákny) při platnosti nulové hypotézy H 0, která předpokládá náhodnou dráhu trhliny ve tkáni: est P L = l 2 π L A, (17) kde P L je vypočtený počet průsečíků profilu trhliny na řezu s hodnocenou složkou cévní stěny (např. s elastinovými vlákny) a l je délka profilu trhliny v řezu. Při signifikantním rozdílu teoretické hodnoty P L a hodnoty P L skutečně napočítané v histologických řezech lze zamítnout H 0. Při signifikantním výsledku párového porovnání P L < P L, resp. při P L > P L lze pak usoudit na skutečnost, zda ruptura protíná složku cévní stěny více, resp. méně, nežli by odpovídalo náhodě. 3.3 Trojrozměrné rekonstrukce Cévy, jejichž stěnu mikroskopicky analyzujeme, jsou většinou současně anatomickými objekty, jejichž makroskopické rozměry nelze vzhledem k síle histologických řezů a délce histologických řezů zanedbat. Potřebujeme-li ozřejmit prostorové vztahy jednotlivých součástí většího vzorku či naopak vizualizovat geometricky složitý průběh drobných cév (např. vasa varosum) se současným zachováním informace o histologické skladbě preparátu, můžeme využít potenciál počítačových trojrozměrných modelů založených na rekonstrukci optických či fyzických sériových řezů. Kromě vizualizačního efektu lze z rekonstruovaných objektů vytěžit i další kvantitativní trojrozměrná data jako např. velikost povrchu a objemu (u uzavřených objektů). 24
27 U mikroskopických rekonstrukcí založených na optických řezech dominuje v současné době jako zdroj obrazů konfokální mikroskopie, viz např. [12, 14]. Alternativou ke klasickým histologickým řezům mohou být i silnější řezy nedeparafinizované, v jejichž případě je restituce původních prostorových vztahů jednodušší a rychlejší nežli u klasických histologických řezů [13]. Volba vhodného zdroje obrazových dat je však vázána na rozměry rekonstruovaných struktur, přičemž pro některé objekty zůstává v histologii a zejména v embryologii rekonstrukce založená na fyzických sériových řezech doposud metodou volby, viz např. [27]. Velkou inspirací pro naši práci byla monografie [2], pojednávající podrobně jak o vhodné přípravě sériových řezů použitelných k rekonstrukcím, tak o restituci řezů. Přestože tato publikace patří ke klasickým pracím v oboru, většina zásad v ní popsaných má obecnou platnost a je využitelná i v době počítačových rekonstrukcí. Technika rekonstrukcí ze sériových řezů, jejíž variantu popisujeme v následujícím textu, je dosti pracná, má řadu úskalí (sesazování řezů v ose Z, odstranění vlivu artefaktů vzniklých krájením) a dosud skýtá prostor pro tvůrčí práci potřebnou k jejich překonávání Rekonstrukce ze série histologických řezů 1. Snímky objektů získáme klasickou mikrofotografickou cestou. Pokud objekty (např. větší cévy) svou velikostí přesahují možnosti mikrofotografie, mohou být proto naskenovány běžným stolním skenerem, kdy vhodným rozlišením může být např dpi. 2. Byly-li řezy skenovány, pro rychlou separaci jednotlivých řezů ze série sklíček můžeme s výhodou použít kombinaci posouvání výběru o konstantní velikosti a automatizovaného snímání obrazovky pomocí volně dostupných programů IrfanView (Irfan Skiljan) a WinGrab (Per Skjerpe, Stavanger, Norsko). Výsledkem je neregistrovaná série. 3. Hlavní přípravnou fází je registrace obrazů, tj. snaha o restituci řezů do stavu před rozkrájením. Při delších sériích se nevyhneme manuálním korekcím (translace, rotace), např. v programu ImagReg1 (Jiří Janáček, Fyziologický ústav AV ČR v Praze). Metody elastické registrace mohou vyrovnat deformace vzniklé krájením řezů, u dlouhých sérií však zpravidla nejsou použitelné. Optimální překryv mezi sousedními řezy dobře vynikne v negativu. 4. V registrovaných obrazech pak segmentujeme oblasti našeho zájmu (kontury význačných struktur), např. programem Ellipse3D (ViDiTo, Košice, Slovensko). Volíme mezi poloautomatickými nástroji (princip prahování, watershed, LiveWire apod.) či manuálním obkreslováním grafickým tabletem. Řezy nepoužitelné pro rekonstrukci (roztržené, deformované, neúplné) ponecháme v sérii a při segmentaci je přeskočíme a interpolujeme. Jednotlivé kontury patřící k téže struktuře sdružujeme jako objekty určité třídy. 5. Pro orientaci mezi objekty a hledání chyb můžeme před vlastní rekonstrukcí zviditelnit kontury ve 3-D (např. modulem Contours v programu Ellipse3D). 6. Rekonstrukci povrchu zobrazíme modulem Surface (Ellipse3D). V něm volíme pro každou třídu nastavení průhlednosti, stupně vyhlazení, barvu, intenzitní práh pro zobrazení, kvalitu (a tím i výpočetní náročnost) rekonstrukce (zvlášť pro XY a zvlášť 25

![6: Ukázka rekonstrukce medie (modře), arteriosklerotické léze (žlutě) a cévního lumen (červeně) u aorty apoe-ko myši [37]. Obr.](/docs-images/103/159708864/images/28-1.jpg "7: Totožný segment v jiném úhlu pohledu. Obr. 8: Totožný segment v jiném úhlu pohledu a s volbou průhlednosti vrstev. Obr. 9: Dtto.")
 tím, ze v sérii obrázků detekuje tzv.")
28 pro Z) apod. V globálním nastavení můžeme provést řez objektem pomocí masky. Pokud požadujeme rekonstrukci jen některých rovin, vrátíme se zpět na sérii zdrojových obrázků s konturami a Processing Crop vymezíme požadované axiální roviny. Obr. 6: Ukázka rekonstrukce medie (modře), arteriosklerotické léze (žlutě) a cévního lumen (červeně) u aorty apoe-ko myši [37]. Obr. 7: Totožný segment v jiném úhlu pohledu. Obr. 8: Totožný segment v jiném úhlu pohledu a s volbou průhlednosti vrstev. Obr. 9: Dtto. U obrázku 6 9 děkuji za technickou pomoc kolegovi Vítu M. Matějkovi. 7. Modul Surface nejprve vytvoří volumetrický model objektů ze série kontur dané třídy. Pak pro zobrazení vytváří model povrchu těchto objektů (Obr. 6 9) tím, ze v sérii obrázků detekuje tzv. isosurface, což je povrch vytvářený při renderingu spojením série 2-D kontur. Je možné nastavit citlivost propojení těchto kontur, což je užitečné např. pokud máme u různých orgánů různé odstupy mezi sousedními konturami (u orgánů s menší nepravidelností nebývá nutné segmentovat kontury v každé rovině). 26
29 4 Literatura pro úvodní a metodickou část [1] Bolender R.P. (1992): Biological stereology: history, present state, future directions. Microsc Res Tech. 21: [2] Gaunt P.N., Gaunt W.A. (1978): Three dimensional reconstruction in biology. 1 st edition. Pitman Medical Publishing Co., Tunbridge Wells, 174 pp. [3] Gundersen H.J.G. (1977): Notes on the estimation of the numerical density of arbitrary profiles: the edge effect. J. Microsc. 111: [4] Gundersen H.J. (1986): Stereology of arbitrary particles. A review of unbiased number and size estimators and the presentation of some new ones, in memory of William R. Thompson. J Microsc. 143:3 45. [5] Gundersen H.J.G., Jensen E.B. (1987): The efficiency of systematic sampling in stereology and its prediction. J Microsc. 147: [6] Gundersen H.J., Bagger P., Bendtsen T.F., Evans S.M., Korbo L., Marcussen N., Moller A., Nielsen K., Nyengaard J.R., Pakkenberg B., et al. (1988): The new stereological tools: disector, fractionator, nucleator and point sampled intercepts and their use in pathological research and diagnosis. APMIS. 96: [7] Gundersen H.J., Østerby R. (1981): Optimizing sampling efficiency of stereological studies in biology: or do more less well!. J Microsc. 121: [8] Gundersen H.J., Jensen E.B., Kieu K., Nielsen J. (1999): The efficiency of systematic sampling in stereology reconsidered. J Microsc. 193: [9] Hedreen J.C. (1998): What was wrong with the Abercrombie and empirical cell counting methods? A review. Anat Rec. 250: [10] Howard C.V., Reed M.G. (1998): Unbiased Stereology: Three Dimensional Measurement in Microscopy. 2 nd edition. Royal Microscopical Society, Microscopy Handbook Series No. 41. Springer-Verlag, New York, 246 pp. [11] Howard V., Reid S., Baddeley A., Boyde A. (1985): Unbiased estimation of particle density in the tandem scanning reflected light microscope. J Microsc. 138: [12] Jirkovská M., Kubinová L., Krekule I., Hach P. (1998): Spatial arrangement of fetal placental capillaries in terminal villi: a study using confocal microscopy. Anat Embryol (Berl). 197: [13] Jirkovská M., Naprstková I., Janáček J., Kučera T., Macášek J., Karen P., Kubínová L. (2005): Three-dimensional reconstructions from non-deparaffinized tissue sections. Anat Embryol (Berl). 210: [14] Karen P., Jirkovská M., Tomori Z., Demjenová E., Janáček J., Kubínová L. (2003): Three-dimensional computer reconstruction of large tissue volumes based on composing series of high-resolution confocal images by GlueMRC and LinkMRC software. Microsc Res Tech. 62: [15] Kurzydlowski K.J., Ralph B. (1995): The quantitative description of the microstructure of materials. CRC Press, Boston, 418 pp. [16] Mayhew T.M., Gundersen H.J. (1996): If you assume, you can make an ass out of u and me : a decade of the disector for stereological counting of particles in 3D space. J Anat. 188:
30 [17] Mouton P.R. (2002): Principles and Practices of Unbiased Stereology. An Introduction for Bioscientists. The Johns Hopkins University Press, Baltimore, 214 pp. [18] Russ, J.C. (2006): The Image Processing Handbook. 5 th edition. CRC, Boca Raton, 818 pp. [19] Russ J.C., Dehoff R.T. (2001): Practical Stereology. 2 nd edition. Plenum Press, New York, 307 pp. [20] Stary H.C., Chandler A.B., Glagov S., Guyton J.R., Insull W. Jr., Rosenfeld M.E., Schaffer S.A., Schwartz C.J., Wagner W.D., Wissler R.W. et al. (1994): A definition of initial, fatty streak, and intermediate lesions of atherosclerosis: A report from the committee on vascular lesions of the council on arteriosclerosis, American Heart Association. Circulation. 89: [21] Stary H.C., Chandler A.B., Dinsmore R.E., Fuster V., Glagov S., Insull W. Jr., Rosenfeld M.E., Schwartz C.J., Wagner W.D., Wissler RW. et al. (1995): A definition of advanced types of atherosclerotic lesions and a histological classification of atherosclerosis. A report from the committee on vascular lesions of the council on arteriosclerosis, American Heart Association. Arterioscler Thromb Vasc Biol. 15: [22] Stary H.C. (2000): Natural history and histological classification of atherosclerotic lesions. An update. Arterioscler Thromb Vasc Biol. 20: [23] Sterio D.C. (1984): The unbiased estimation of number and sizes of arbitrary particles using the disector. J Microsc. 134: [24] Stoyan D., Kendall W.S., Mecke J. (1995): Stochastic geometry and its applications. 2 nd ed. John Wiley & Sons, New York, 456 pp. [25] Weibel E.R. (1979): Stereological Methods. Vol.1: Practical Methods for Biological Morphometry. Academic Press, London, 415 pp. [26] Wicksell S.D. (1925): The Corpuscle Problem: A Mathematical Study of a Biometric Problem. Biometrika. 17: [27] Witter K., Pavliková H., Matulová P., Míšek I. (2005): Relationship between vestibular lamina, dental lamina, and the developing oral vestibule in the upper jaw of the field vole (Microtus agrestis, Rodentia). J Morphol. 265: [28] Wojnar L. (1999): Image analysis Applications in materials engineering. CRC Press, Boca Raton, 256 pp. 28
31 5 Publikované výsledky 5.1 Soupis publikovaných prací [29] Tonar Z., Janáček J., Poledne R. (2007): Stereologické metody kvantitativního popisu aterosklerotických lézí na úrovni optické mikroskopie. [Stereological methods for quantitative description of atherosclerotic lesions in optical microscopy]. Cor Vasa 49: [30] Třeška V., Topolčan O., Kočová J., Pecen L., Tonar Z. (1999): Prokolagen typu I a III u nemocných s aneuryzmaty břišní aorty [Procollagen Type I and III in Patients with an Aneurysm of the Abdominal Aorta.]. Cas Lek Cesk. 138: [31] Kočová J., Boudová L., Třeška V., Křížková V., Tonar Z., Moláček J. (2003): Cellular and extracellular elements in the aortic wall including aneurysm and rupture of abdominal aorta. Plzeň lék Sborn Supplementum. 78: [32] Treska V., Kocova J., Boudova L., Neprasova P., Topolcan O., Pecen L., Tonar Z. (2002): Inflammation in the wall of abdominal aortic aneurysm and its role in the symptomatology of aneurysm. Cytokines Cell Mol Ther. 7: [33] Tonar Z., Němeček S., Holota R., Kočová J., Třeška V., Moláček J., Kohoutek T., Hadravská Š. (2003): Microscopic image analysis of elastin network in samples of normal, atherosclerotic and aneurysmatic abdominal aorta and its biomechanical implications. J Appl Biomed. 1: [34] Bobková D., Kočová J., Tonar Z., Lácha J., Havlíčková J., Poledne R. (2004): Heart transplantation in apolipoprotein E-deficient mice as a model of atherosclerosis regression. Cor Vasa 42: [35] Bobková D., Tonar Z. (2005): Effects of Long-term Cholesterol Diet on Cholesterol Concentration and Development of Atherosclerosis in Homozygous Apolipoprotein E- deficient Mice. Acta vet Brno. 74: [36] Tonar Z., Bobkova D., Havlickova J., Poledne R. (2005): Vessel transplantation of apolipoprotein E-deficient mice as a model of atherosclerosis regression. Abstracts of the 75th Congress of the European Atherosclerosis Society. Atherosclerosis Supplements. 6:45. [37] Tonar Z., Bobková D., Witter K., Matejka V.M., Havlíčková J., Lánská V., Poledne R. (2007): Aorta transplantation in juvenile apolipoproteine-deficient mice: Possible model for studies on regression of atherosclerotic lesions? Submitted for publication in Veterinarni Medicina. [38] Tonar Z., Nemecek S., Muzik T. (2005): Morphology of elastin network in porcine aorta. In: Chraponski J., Cwajna J., Wojnar L. (wds): Proceedings of 9th European Congress on Stereology and Image Analysis and 7th STERMAT International Conference on Stereology and Image Analysis in Materials Science. Vol. II, pp [39] Tonar Z., Němeček S, Holota R (2005): Microscopic image analysis of elastin and morphometry of wall of thoracic and abdominal porcine aorta. IFMBE Proc. 11: [40] Rohan E., Cimrman R., Tonar Z. (2002): On modelling arteries using composite model of soft tissue. In: Jelen K., Kušová S., Chalupová M., Otáhal J. (eds): Proceedings of 29
32 international conference on biomechanics of man 2002, Czech Society of Biomechanics, 12th-15th November 2002, Čejkovice. Charles University in Prague, Faculty of Physical Education and Sport, pp [41] Demjančuková L., Rohan E., Boiron O., Tonar Z. (2005): Numerical and experimental aspects of arterial wall modelling. Computer Methods in Biomechanics and Biomedical Engineering. 3: [42] Demjančuková, L., Tonar, Z., Boiron, O., Polanský, J., Rohan, E., Cimrman, R. (2006): Composite model of healthy arterial wall: material identification based on uniaxial tensile tests and morphometric analysis. J Biomech. 39(Suppl. 1):S622. [43] Cimrman R., Kroc J., Rohan E., Rosenberg J., Tonar Z. (2003): On coupling cellular automata based activation and finite element muscle model applied to heart ventricle modelling. In: Arnež Z.M., Brebbia C.A., Solina F., Stankovski V. (eds): Simulations in Biomedicine V. WIT Press, Southampton, pp [44] Tonar Z., Jeník J., Třeška V., Novák M. (2005): Computer simulation of the flow in the abdominal aneurysmatic aorta. IFMBE Proc. 11: [45] Jeník J., Tonar Z., Třeška V., Novák M. (2006): Blood-Structure Interaction in Abdominal Aorta Aneurysms. Fluent News 15:S11 S12. 30
33 095az101 Tonar :22 Stránka 95 P EHLED REVIEW Kvantitativní popis aterosklerotických lézí na úrovni optické mikroskopie* Zbyněk Tonar*, **, Jiří Janáček***, Rudolf Poledne* *Laboratoř pro výzkum aterosklerózy, Institut klinické a experimentální medicíny, Praha, **Ústav histologie a embryologie, Lékařská fakulta Univerzity Karlovy v Plzni, Plzeň, ***Oddělení biomatematiky, Fyziologický ústav Akademie věd České republiky, Praha, Česká republika Tonar Z*, **, Janáček J***, Poledne R* (*Laboratoř pro výzkum aterosklerózy, Institut klinické a experimentální medicíny, Praha, **Ústav histologie a embryologie, Lékařská fakulta Univerzity Karlovy v Plzni, Plzeň, ***Oddělení biomatematiky, Fyziologický ústav Akademie věd České republiky, Praha, Česká republika). Kvantitativní popis aterosklerotických lézí na úrovni optické mikroskopie. Cor Vasa 2007;49(3): Cílem práce je shrnout dostupné metody morfometrie aterosklerotických lézí a pojednat o jejich praktické použitelnosti pro hodnocení vulnerability lézí. Vysvětlujeme princip stereologického odhadu délek, povrchů, objemů, buněčné hustoty, mikrovazální hustoty, shlukování buněk a jejich preferenční distribuce v různých kompartmentech vzorků. Pozornost je věnována i problematice vzorkování histologických sérií a uspořádání stereologické studie tak, aby splňovala základní předpoklady současné morfometrie. Diskutujeme o zdrojích variability v mikroskopii cév a srovnáváme některé metody analýzy obrazu a stereologie. Zmíněny jsou doporučené zásady pro odběr materiálu. Klíčová slova: Mikroskopie Stereologie Kvantifikace Krevní cévy Tonar Z*, **, Janáček J***, Poledne R* (*Atherosclerosis Research Laboratory, Institute for Clinical and Experimental Medicine, Prague, **Institute of Histology and Embryology, Charles University School of Medicine at Pilsen, Pilsen, ***Division of Biomathematics, Institute of Physiology, Academy of Sciences of the Czech Republic, Prague, Czech Republic). Quantitative description of atherosclerotic lesions in optical microscopy. Cor Vasa 2007;49(3): The aim of this paper is to review current methods available for quantitative morphometry of lesions in blood vessels as well as to discuss their applicability for assessing the vulnerability of vascular lesions. The principles of stereological estimation of the length, surface, volume, numerical density, cluster analysis, microvessel density, and relative labeling index are explained. The key rules of unbiased sampling in histology and designing a morphometric study are discussed. The distribution of the overall observed variance in a typical biological experiment is reviewed, and a comparison of some image processing vs. stereological methods is provided. We discuss several common pitfalls in quantification studies and provide practical recommendations to be followed when harvesting tissue samples for histological assessment. Key words: Microscopy Stereology Quantification Blood vessels Adresa: MUDr. Mgr. Zbyněk Tonar, Ústav histologie a embryologie, Lékařská fakulta UK v Plzni, Karlovarská 48, Plzeň, Česká republika; zbynek.tonar@lfp.cuni.cz HISTOPATOLOGICKÁ KLASIFIKACE ATEROSKLERÓZY V histopatologické klasifikaci aterosklerózy je dlouhodobě zaveden přehledný a výborně dokumentovaný systém podle Staryho, který se stal základem pro klasifikaci navrženou American Heart Association (AHA). (1 4) Iniciální léze typu I sestává ze zvětšeného množství lipidů obsahujících makrofágy (pěnové buňky), které jsou izolovaně rozptýleny v adaptivně zesílené intimě bohaté na proteoglykany. V lézi typu II jsou pěnové buňky akumulovány v souvislých vrstvách a kapénky lipidů se objevují i v některých hladkých svalových buňkách intimy. Intermediární léze typu III (preateromy) obsahují již extracelulární depozita lipidů, které se uvolnily rozpadem části populace pěnových buněk, a proto nalézáme v mezibuněčném prostoru na rozhraní intimy a medie zbytky rozpadlých buněk. Ve stadiu IV (aterom) pozorujeme masivní nárůst extracelulárních lipidů do podoby lipidového jádra krytého vrstvou pěnových buněk a intimou. Narůstá množství lipidů i v hladkých svalových buňkách, které se z původního tzv. kontraktilního fenotypu postupně mění na fenotyp syntetický, charakterizovaný vedle obsahu tukových kapének i zmnožením granulárního endoplazmatického retikula, dystrofickou kalcifikací některých organel a zesílením bazální laminy. Od stadia IV se léze může vyvíjet různým způsobem v závislosti na *Angiologická část práce byla podpořena projektem MŠMT ČR 1M , histologické metody výzkumným záměrem MŠMT ČR MSM a rozvoj stereologických technik granty AVCR A a AV0Z Cor Vasa 2007;49(3): Tonar Z a spol. Kvantitativní mikroskopický popis cév 95 31
, pod nímž vedle lipidového jádra nacházíme i vápenaté inkrustace.")
34 095az101 Tonar :22 Stránka 96 typu cévy, lokalizaci uvnitř cévy, lipidovém profilu, hypertenzi, reaktivitě cévní stěny a dalších faktorech. Pro stadium V je typické reparativní zmnožení fibromuskulárního krytu (čepičky), pod nímž vedle lipidového jádra nacházíme i vápenaté inkrustace. Dochází ke zvýšení rigidity cévní stěny a výraznějšímu uzávěru cévního lumen. Za stadium VI považujeme přítomnost eroze, hematomu či trombózy, nasedající na lézi typu IV či V a tyto komplikace mohou (zejména v případě opakování) vést k velmi rychlé okluzi cévy. Při výrazném rozvoji kalcifikace či dokonce při osteoidní metaplazii popisujeme lézi typu VII. U typu VIII převažuje reparativní fibroprodukce. Regrese či změna v lipidových depozitech v cévní stěně mohou vést k remodelaci lézí IV VI v typ VII VIII. Klasifikace ještě rozlišuje různá dílčí substadia. Pro zvýšení přehlednosti a zjednodušení byly navrženy i modifikace tohoto systému stadií, (5) ty jsou však podle klasifikace AHA konzistentní. KVANTIFIKACE PARAMETRÒ P I STUDIU VULNERABILITY ATEROSKLEROTICK CH LÉZÍ K popsanému gradingu aterosklerotických změn je často zapotřebí doplnit i kvantitativní hodnocení některých složek cévní stěny, zejména pak pro posouzení vulnerability lézí podle uznávaných kritérií, (6,7) (tabulka I). Kvantitativní posouzení cévního řečiště na mikroskopické úrovni poskytuje nepostradatelné výsledky zejména v experimentálním výzkumu aterosklerózy. Postupy používané v současnosti lze většinou zařadit buď mezi metody obrazové analýzy nebo stereologie. Zdaleka ne všechny současné publikace respektují či sdílejí společné metodické zásady kvantifikace, a proto jsou výsledky jednotlivých pracovišť jen obtížně porovnatelné. Cílem tohoto příspěvku je proto shrnout dostupné metody morfometrie cév a diskutovat o jejich praktické použitelnosti pro jednotlivé aplikace. Zvláštní pozornost bude dále věnována metodám spadajícím do stereologie, tj. postupům založeným na statistickém odvozování geometrických vlastností hodnocených struktur a objektů z aplikace bodových, lineárních, rovinných či objemových testovacích sond na orientované řezy vzorkem. (8,9) ROZSAH LÉZÍ A JEJICH KOMPONENT Plošné míry, tj. např. plochy profilů cév, lézí (10) (obrázek 1), hemoragií či relativní pozitivitu adhezních molekul (11) na řezu, lze odhadovat z počtu průsečíků hodnocené struktury s náhodnou sítí bodů superponovaných se snímkem. Využíváme skutečnosti, že pravděpodobnost zasažení hodnoceného objektu (plátu, kalcifikace, cévního lumen apod.) body testovací mřížky je přímo úměrná ploše této struktury vřezu. S využitím Cavalieriho principu (12) lze při znalosti síly řezů stanovit i objem celých lézí či jejich složek. Pokud jsou analyzované objekty v rámci série histologických řezů od sebe dostatečně vzdáleny a jejich prostorové korelace je možné zanedbat, považujeme je za nezávislé a variabilitu výsledků zpracováváme běžným způsobem. Pokud se můžeme domnívat, že sousední vzorky mohou být závislé, analyzujeme např. celou sérii řez po řezu a zjistíme závislost koeficientu chyby podle Gundersena a Jensenové. (13) HUSTOTA LEUKOCYTÒ V CÉVNÍ STùNù K hodnocení hustoty buněk, např. imunohistochemicky detekovaných leukocytů, v referenční objemové jednotce tkáně lze použít techniky optického nebo fyzického disektoru. (14) Disektor je stereologická objemová testovací sonda k počítání objektů v objemové Obr. 1 Projekce bodové testovací mřížky o parametru a při určování objemu aortální neointimy utransplantačního modelu regrese aterosklerózy u apoe-deficientní myši. Měřítko 170 µm, zelený trichrom a Verhoeffův hematoxylin. 96 Tonar Z a spol. Kvantitativní mikroskopický popis cév Cor Vasa 2007;49(3):
 v adventicii aorty apoe-deficientní myši po heterotopní transplantaci.")
 či náhledovou rovinu se nezapočítávají. V adventiciálním vazivu kolem cévního stehu byla hustota neutrofilů 101 000/mm 3.")
35 095az101 Tonar :22 Stránka 97 Obr. 2 Horní pohled na hodnotící rámeček fyzického disektoru zaměřeného na neutrofilní granulocyty (hnědě) v adventicii aorty apoe-deficientní myši po heterotopní transplantaci. Započítány jsou zeleně značené buňky, které jsou uvnitř disektoru či protínají jeho povolené boční hranice (zeleně). Buňky protínající zakázanou hranici (červeně) či náhledovou rovinu se nezapočítávají. V adventiciálním vazivu kolem cévního stehu byla hustota neutrofilů /mm 3. Měřítko 70 µm, imunohistochemie proti anti-mouse neutrophils s dobarvením Gillovým hematoxylinem. Obr. 3 Cirkulární oblouky při hodnocení délkové hustoty (0,083 µm -1 ) profilů elastinu v řezu tunica media aorty myši. Měřítko 60 µm, zelený trichrom a Verhoeffův hematoxylin. jednotce. Fyzický disektor využívá obrázků dvou či více fyzických řezů registrovaných (sesazených) v ose Z. Optický disektor využívá silných řezů, uvnitř kterých postupným zaostřováním procházíme jednotlivé optické intervaly. Z počtu objektů můžeme při kalibraci referenčního objemu cévní stěny odhadnout hustotu označených buněk. Dodržení pravidel disektoru zaručuje nevychýlený výsledek ( unbiased estimation ), v němž objekty různé velikosti i orientace mají stejnou pravděpodobnost, že budou do disektoru započítány (obrázek 2). Zároveň je vyloučeno opakované započítání týchž objektů zasahujících do více řezů. DÉLKA VLÁKEN MEZIBUNùâNÉ HMOTY A VASA VASORUM, MIKROVAZÁLNÍ HUSTOTA Uvažujeme-li délku vláken a lamel elastinové sítě nebo délku vasa vasorum ve 3D, lze definovat délko- Cor Vasa 2007;49(3): Tonar Z a spol. Kvantitativní mikroskopický popis cév 97 33
36 095az101 Tonar :22 Stránka 98 Tabulka I Mikroskopické markery vulnerability aterosklerotických lézí Kvantitativní parametr Jednotky Stenóza lumen Objem cévního lumina a cévní stěny (mm 3 ) Poměrné zúžení lumina tepny aterosklerotickou lézí (%) Velikost lipidového jádra Absolutní objem lipidových depozit (mm 3 ) Relativní podíl extracelulárních lipidů v celé lézi (%) Síla krytu lipidového jádra Tloušťka fibrózní čepičky léze (µm) Přítomnost abnormálních složek Relativní objemový podíl lipidů, kalcifikací, (%) v mezibuněčném prostoru hemoragií v lézi (%) a alterace mechanických vlastností cévní stěny Narušení základní stavby Střední interlamelární vzdálenost mezi (µm) tepenné stěny, zejména sousedními elastickými membránami u elastických tepen Tloušťka cévní stěny a jejích vrstev (µm) Fragmentace elastinu ve stěně Délková hustota elastinu (mm -1 ) velkých elastických tepen Rozvoj zánětlivé reakce Numerická hustota buněk infiltrujících (µm -3 ) referenční objem cévní stěny Rozměr buněčných shluků a kolokalizace (µm) jednotlivých typů leukocytů Plocha/objem pozitivity imunohistochemického (mm 2 ), průkazu adhezních molekul, metaloproteináz apod. resp. na řezu/sérii řezů (mm 3 ) Trofika cévní stěny a vliv Povrch cév včetně vasa vasorum (mm 2 ) neoangiogeneze Povrchová hustota cév v referenčním objemu (mm -1 ) cévní stěny vou hustotu jako poměr délky struktury v referenční ploše, resp. objemu. K tomuto odhadu lze použít trojrozměrný testovací systém, tj. množinu izotropních systematických náhodných rovin, které zachytí hodnocený objekt s pravděpodobností přímo úměrnou jeho délce. K odhadu délek lineárních struktur ve 2D (např. obvod profilu cévy na řezu, délka profilu vláken mezibuněčné hmoty apod.) lze s výhodou použít modifikované Buffonovy metody, (15) při níž je délka objektů odhadována z počtu průsečíků testovacího systému (linie či křivky) s hodnocenými vláknitými objekty (obrázek 3). V rámci řezů pak lze vyjadřovat i délkovou hustotu hodnocených profilů. (16) Pro nepřímou kvantifikaci velkého množství drobných vasa vasorum je zavedena metodika odhadu mikrovazální hustoty (microvessel density), jako poměr počtu profilů cév na jednotku plochy řezu. Kromě kvantifikace patologické angiogeneze v jednotlivých vrstvách cévní stěny je vhodnou aplikací i možné vysvětlení vlivu trofiky cévní stěny na predispozici některých částí cévního řečiště k ateroskleróze. (17) POVRCH CÉV A LÉZE Při odhadu velikosti vnitřního povrchu cév musíme zajistit, aby všechny stejně velké části plochy endotelu měly stejnou šanci být zasaženy lineární sondou. Tento předpoklad platí, použijeme-li izotropně orientovanou sondu nebo aplikujeme-li sondu na izotropní náhodně orientované řezy. Z praktických důvodů je často vhodnější namísto zcela izotropních řezů připravovat tzv. vertikální uniformní náhodné (VUR) řezy, které však již nejsou izotropní ve 3D, ale jen v horizontální rovině. Vzorek pak krájíme systematickými řezy kolmo na horizontální rovinu a povrch je dán množstvím průsečíků s křivkami zvanými cykloidy. Řezy VUR můžeme s výhodou použít současně s určováním plochy i k odhadu objemů Cavalieriho metodou, která nevyžaduje náhodnou orientaci řezů. SHLUKY A KOLOKALIZACE BUNùK V CÉVNÍ STùNù Pro hodnocení tvorby shluků buněk v preparátech (např. imunohistochemicky značených makrofágů v cévní stěně) je k dispozici testování ne/náhodnosti rozložení buněk v referenčním prostoru, jakožto analýza lokálních maxim a minim denzity objektů ve vymezené oblasti preparátu. Hodnotíme, (18) zda počet vzdáleností mezi sousedícími buňkami v určitém vzdálenostním intervalu je vyšší či nižší na dané hladině významnosti, než by odpovídalo mnohonásobné simulaci zcela náhodného rozložení buněk v analyzované oblasti. Obdobnou analýzou pro objekty více než jedné třídy lze hodnotit jejich kolokalizaci, například společný výskyt různých typů leukocytů infiltrujících cévní stěnu. Pro analýzu preferenčního osídlení některých částí léze, populací určitých buněk, se používá tzv. relative labelling index (RLI). (19) Lze tak odpovědět na otázku, zda je distribuce objektů (buněk) v různých kompartmentech (např. jednotlivých vrstvách cévní stěny či v aterosklerotické lézi a mimo ni) náhodná, a pokud není náhodná, který kompartment je daným typem buněk upřednostňován. STRATEGIE P ÍPRAVY VZORKÒ Vedle samotného hodnocení mikroskopických parametrů je u kvantitativní studie velice důležité 98 Tonar Z a spol. Kvantitativní mikroskopický popis cév Cor Vasa 2007;49(3):
37 095az101 Tonar :22 Stránka 99 vzorkování materiálu, jako významná součást jejího uspořádání. V publikacích někdy uváděný výběr reprezentativních vzorků je nejednoznačný, zpravidla nereprodukovatelný a může podle preferencí autora znamenat např. tu část materiálu, která se mu jeví jako vhodná pro publikační výstup, která koresponduje s referenční literaturou na dané téma, jejíž laboratorní zpracování je zdařilé, či která se z nějakého jiného subjektivního důvodu jeví jako vhodná pro analýzu. Uvedené a jim podobné metody výběru reprezentativních vzorků jsou tzv. vychýlené ( biased ), protože bývají vybrány na základě a priori známé informace či předpokladů. Takový výběr může být zdrojem systematické chyby a nedává všem částem zkoumaného orgánu či histologického bločku stejnou pravděpodobnost, že se stane součástí výběru. Princip spravedlivého výběru je přitom základem správného vzorkování a žádná část vzorku, který chceme zkoumat, by neměla být upřednostňována. Jen tak lze zajistit, aby se struktury staly součástí výběru s pravděpodobností přímo závislou na frekvenci jejich výskytu ve vzorku (právě tato jejich četnost je zpravidla tím, co stanovujeme). Častým úkolem histologického pracoviště je výběr tkáňového bločku z makroskopického vzorku analyzovaného orgánu, výběr konkrétních řezů hodnocených v rámci bločku či výběr obrazových polí v rámci daného řezu. Na každé úrovni odběru či redukce materiálu by měl proběhnout systematický nestranný náhodný výběr, kdy celek rozdělíme na podjednotky (řezy), pozice prvního vzorku v sérii je určena náhodným číslem a pozice dalších vzorků (řezů) jsou vždy ve stejné vzdálenosti od nejbližšího předchozího vzoru (řezu). Rozptyl tohoto výběru je vždy minimálně stejný jako u prostého náhodného výběru, většinou je však význačně nižší. ZDROJE VARIABILITY V MIKROSKOPII CÉV Analýza variability kvantitativních parametrů (tabulka I) na jednotlivých stupních vzorkování vyžaduje zpravidla pilotní studii. Při plánování experimentů však můžeme využít studií zabývajících se variabilitou. Ukazuje se, že u typického biologického experimentu při kvantifikaci morfologických struktur připadá zhruba 70 % (20) z celkové variability údajů na interindividuálni (biologickou) variabilitu, dále asi 20 % na variabilitu mezi tkáňovými bločky odebranými z daného jedince, kolem 5 % na variabilitu mezi řezy vybranými z daného bločku, 3 % na variabilitu mezi zornými poli hodnocenými v rámci téhož řezu a přibližně 2 % na variabilitu při opakovaných měřeních. Citovaná rozsáhlá studie nás přesvědčuje, že soustředíme-li se na provedení velmi přesného a opakovatelného měření na úrovni mikrofotografií (například obrazovým analyzátorem), může být naším výsledkem v nejlepším případě zpřesnění ve výsledcích celého experimentu asi o 2 %. Chceme-li tedy zvýšit kvalitu kvantitativní studie, je zapotřebí investovat větší úsilí do analýzy většího počtu zvířat a z nich odebíraných vzorků, resp. nakrájených histologických řezů, na což je vhodné myslet při přípravě experimentů se zvířaty. Při této filozofii mohou být kvantitativní studie dosti účinné, zvláště uvážíme-li, že k dostatečně přesným výsledkům lze u většiny z postupů uvedených v přehledu výše dospět při započítání asi 200 průsečíků na sérii řezů či dokonce na jeden vzorek. (21,22) Při analýze cév větších savců či vzorků krevního řečiště člověka může být vhodné analyzovat raději více sérií, zvláště když máme důvod se domnívat, že náchylnost ke vzniku lézí se v různých úsecích téže cévy liší například vlivem větvení, lokálního zakřivení apod. SROVNÁNÍ STEREOLOGICK CH METOD A OBRAZOVÉ ANAL ZY Metody obrazové analýzy jsou ve srovnání se stereologií relativně populární a prakticky každé současné mikroskopické pracoviště alespoň některými z nich disponuje. K jejich výhodám při kvantifikaci patří možnost automatizace prostřednictvím skriptování. Tuto skutečnost oceníme zejména v případě zpracovávání velkého počtu histologických vzorků uniformního vzhledu. Při rozličné kvalitě vzorků v daném experimentu se však setkáváme s tím, že reprodukovatelnost obrazové analýzy barevně odlišitelných fází silně závisí na kvalitě preparátů; tím pádem je omezená například u patologických vzorků či tam, kde i při nejlepší snaze nelze vyloučit přítomnost artefaktů v preparátech (prach, precipitované barvivo, nespecifická reakce u metod afinitní histochemie). U stereologických metod bývá možnost automatizace omezena obvykle např. na prahování a většina metod vyžaduje významnou interaktivní spoluúčast kvalifikovaného hodnotitele. Reprodukovatelnost je však v tomto případě vysoká, neboť podkladem stereologických metod je obvykle počítání událostí (nikoliv měření geometrických parametrů), kdy o každé události (průsečík testovací linie s objektem) lze zcela jednoznačně rozhodnout v rámci binární logiky započítat nebo nezapočítat. Přestože může být podíl interaktivní práce uživatele se software pro stereologickou analýzu v některých případech významnější, než například u rutinně zavedených metod automatizované obrazové analýzy, prostor pro subjektivní chybu je minimalizován jednoznačností rozhodovacích pravidel. Hodnocení uživatelem umožňuje zahrnout do studie ipreparáty s odchylkami v histologickém barvení či s nepodstatnými artefakty. Toto hospodárnější využití materiálu patří k nejsilnějším stránkám stereologie v mikroskopii, protože preparátů s odchylkami od ideálu je v rutinním provozu mnoho. Lepší využití řezů rozšiřuje hodnocenou část makroskopických orgánů, což nám umožňuje účinně snižovat variabilitu v experimentu (viz výše). Jednoznačnost pravidel vede u stereologie samozřejmě i k nízké variabilitě výsledků při opakovaných měřeních či mezi různými pozorovateli. Poslední dva typy variability hodnotíme například pomocí intraclass correlation coefficient. (23) Obecnou vlastností stereologických metod je skutečnost, že při jejich návrhu a testování byla věnována velká pozornost tomu, aby tyto metody poskytovaly údaje nevychýlené různými vlastnostmi vzorků unbiased methods, a aby v sobě zahrnovaly minimum či žádné předpoklady těchto vlastností (velikost, tvar, orientace, distribuce hodnocených objektů, tzv. assumption-free methods ). Pokud metoda přesto nějaké předpoklady má, jsou dobře dokumentované. Cor Vasa 2007;49(3): Tonar Z a spol. Kvantitativní mikroskopický popis cév 99 35
38 095az101 Tonar :22 Stránka 100 PRAKTICKÉ POSTUPY P I ODBùRU MATERIÁLU PRO HISTOLOGICKÉ VY ET ENÍ Přestože odběr vzorků pro mikroskopické hodnocení může probíhat např. v peroperační časové tísni, vyplatí se dodržovat před odesláním materiálu na histologické pracoviště některé zásady, zejména není-li histolog odběru osobně přítomen. 1. Je třeba dokumentovat místo odběru a orientaci vzorku při zalévání do bločku (je-li zaléván v místě odběru). Pokud se může vyskytnout nejednoznačnost v jeho orientaci, je možné důsledně označovat konvenční stranu preparátu černou či zelenou tuší (například k odlišení proximálního a distálního konce cévy, u velkých cév i ventrální a dorzální strany apod.) nebo stehem. V takovém případě se lze vyjádřit k otázce, zda jsou např. léze rozmístěny náhodně nebo preferenčně na ventrální, dorzální či laterální stěně cévního lumen, nebo jaká je distribuce lézí vzhledem k odstupujícím větvím hlavního cévního kmene. Tím se otevírá možnost diskutovat lokální hemodynamické vlivy na predilekční výskyt lézí. 2. Dokumentujeme, zda byla fixace provázena průplachem cévy fixačním roztokem nebo jen ponořením do fixativa. Znalost této okolnosti může usnadnit mikroskopické odlišení některých suspektních dosud neorganizovaných čerstvých mikrotrombů od postmortálně vzniklých koagul, zejména v malých cévách. Průplachem cévy fixačním roztokem také klesne počet buněk adherujících na endotel, se kterými se lze v cévách často setkat. 3. Používáme dostatečné množství fixativa optimální je asi 100násobek objemu tkáňového bločku, jehož rozměry by vzhledem k rychlosti penetrace formaldehydového roztoku neměly přesahovat cm u solidní tkáně. Pokud je vzorek větší, je třeba provést nástřik cév, resp. jiných dutin vzorku fixativem. 4. Omezujeme preparaci tkáňových bločků před jejich fixací, resp. zalitím do paraplastu na naprosté minimum. Je vhodné vyhnout se nadbytečné preparaci cév, při níž se často poškodí či odtrhne tunica adventitia a nelze se pak vyjádřit např. k její leukocytární infiltraci či ke stavu vasa vasorum. Ideální je ponechat cévu v okolní tkáni, kterou je zpravidla řídké kolagenní vazivo, a zalít ji en bloc. jako větší bloček. 5. Je-li to možné, vyhýbáme se deformaci hodnoceného úseku cév instrumentáriem. Po kompresi cévy pinzetou, cévními kleštěmi či svorkami, nelze již rekonstruovat prostorové vztahy v cévní stěně, poměr plát/volné lumen atd. Je-li nutné s cévou manipulovat, navrhujeme činit tak za konec, který bude nakonec před zalitím do bločku odstřižen. Respektováním uvedených zásad, které mohou být modifikovány podle zvyklostí a potřeb konkrétního hodnotícího pracoviště, předcházíme nejistotě v odečítání a komentáři některých preparátů a zpravidla je možno vytěžit z mikroskopického vyšetření více informací. I pak je ale nutné se smířit se skutečností, že kvantitativní údaje získané mikroskopickým hodnocením nelze u měkkých tkání považovat za absolutně správná čísla, ale spíše lze jimi poměřovat jednotlivé skupiny experimentu. Od odběru tkáně po vlastní mikroskopování prochází vzorek totiž řadou procedur, které mění zejména objemové poměry tkání: fixace po odběru, dehydratace, prosycování zalévacím médiem, zalévání vzorku do paraplastu zhruba při 56 C, chladnutí zalitého vzorku, krájení, rozpuštění paraplastu, hydratace vzorku, barvení, dehydratace vzorku a montování do trvalého preparátu. U většiny deformací, které během zpracování proběhnou, navíc nelze předpokládat izotropii, (24) zejména u kompozitních vzorků s převažující orientací buněk i mezibuněčné hmoty, jak je tomu například u cévní stěny. ZÁVùR Stereologické metody umožňují provádět kvantitativní odhady počtu objektů, délek, ploch a objemů. Společným principem je hodnocení interakce geometrických sond, jako jsou objemové elementy, roviny (řezy), linie a body, s hodnoceným vzorkem histologicky zpracovaných tkáňových bločků. Nedílnou součástí kvantitativního hodnocení je i hospodárný výběr částí makroskopických orgánů i nakrájených bločků k hodnocení. Při volbě správné strategie je tak v současnosti možné účinně kvantifikovat popis cév v normální cévní stěně i v experimentu. LITERATURA 1. Stary HC, Chandler AB, Glagov S, et al. A definition of initial, fatty streak, and intermediate lesions of atherosclerosis: A report from the committee on vascular lesions of the council on arteriosclerosis, American Heart Association. Circulation 1994;89: Stary HC, Chandler AB, Dinsmore RE, et al. A definition of advanced types of atherosclerotic lesions and a histological classification of atherosclerosis. A report from the committee on vascular lesions of the council on arteriosclerosis, American Heart Association. Arterioscler Thromb Vasc Biol 1995;15: Stary HC. Natural history and histological classification of atherosclerotic lesions. An update. Arterioscler Thromb Vasc Biol 2000;20: Stary HC. Slide atlas of atherosclerosis: Progression and regression. CD-ROM. New York: Parthenon Publishing, Virmani R, Kolodgie FD, Burke AP, Farb A, Schwartz SM. Lessons from sudden coronary death: a comprehensive morphological classification scheme for atherosclerotic lesions. Arterioscler Thromb Vasc Biol 2000; 20: Naghavi M, Libby P, Falk E, et al. From vulnerable plaque to vulnerable patient: a call for new definitions and risk assessment strategies. Part I. Circulation 2003; 108: Naghavi M, Libby P, Falk E, et al. From vulnerable plaque to vulnerable patient: a call for new definitions and risk assessment strategies. Part II. Circulation 2003; 108: Howard CV, Reed MG. Unbiased Stereology: Three dimensional measurement in microscopy. 1st ed. Royal Microscopical Society, Microscopy Handbook Series No. 41. New York: Springer-Verlag, 1998: Mouton PR. Principles and practices of unbiased stereology: An introduction to bioscientists. Baltimore: The Johns Hopkins University Press, 2002: Bobková D, Tonar Z. Effect of long-term cholesterol diet 100 Tonar Z a spol. Kvantitativní mikroskopický popis cév Cor Vasa 2007;49(3):

39 095az101 Tonar :22 Stránka 101 on cholesterol concentration and development of atherosclerosis in homozygous apolipoprotein e-deficient mice. Acta Vet Brno 2005;74: Nachtigal P, Semecky V, Kopecky M, et al. Application of stereological methods for the quantification of VCAM-1and ICAM-1 expression in early stages of rabbit atherosclerosis. Pathology Research and Practice 2004; 200: Russ JC, DeHoff RT. Practical Stereology. 2nd ed. New York: Plenum Press, 2001: Gundersen HJG, Jensen EB. The efficiency of systematic sampling in stereology and its prediction. J Microsc 1987;147: Tomori Z, Krekule I, Kubínová L. Disector program for unbiased estimation of particle number, numerical density and mean volume. Image Anal Stereol 2001;20: Weibel ER. Stereological Methods. Vol.1: Practical Methods for Biological Morphometry. London: Academic Press, 1979: Stoyan D, Kendall WS, Mecke J. Stochastic geometry and its applications. 2nd ed. New York: John Wiley & Sons, 1996: Galili O, Herrmann J, Woodrum J, Sattler KJ, Lerman LO, Lerman A. Adventitial vasa vasorum heterogeneity among different vascular beds. J Vasc Surg. 2004;40: Philimonenko AA, Janáček J, Hozák P. Statistical evaluation of colocalization patterns in immunogold labelling experiments. J Struct Biol 2000;132: Mayhew TM, Lucocq JM, Griffiths G. Relative labelling index: a novel stereological approach to test for non- -random immunogold labelling of organelles and membranes on transmission electron microscopy thin sections. J Microsc 2002;205: Gundersen HJG, Østerby R. Optimizing sampling efficiency of stereological studies in biology: or: Do more less well!. J Microsc 1987;121: Gundersen HJ, Bagger P, Bendtsen TF, et al. The new stereological tools: disector, fractionator, nucleator and point sampled intercepts and their use in pathological research and diagnosis. Acta Pathol Microbiol Imunol Scand 1988;96: Gundersen HJ, Bendtsen TF, Korbo L, et al. Some new, simple and efficient stereological methods and their use in pathological research and diagnosis. Acta Pathol Microbiol Imunol Scand 1988;96: Muller R, Buttner P. A critical discussion of intraclass correlation coefficients. Statistics in Medicine 1994;13: Dorph-Petersen KA, Nyengaard JR, Gundersen HJ. Tissue shrinkage and unbiased stereological estimation of particle number and size. J Microsc 2001;204: Došlo do redakce Přijato k otištění
40 38
41 39
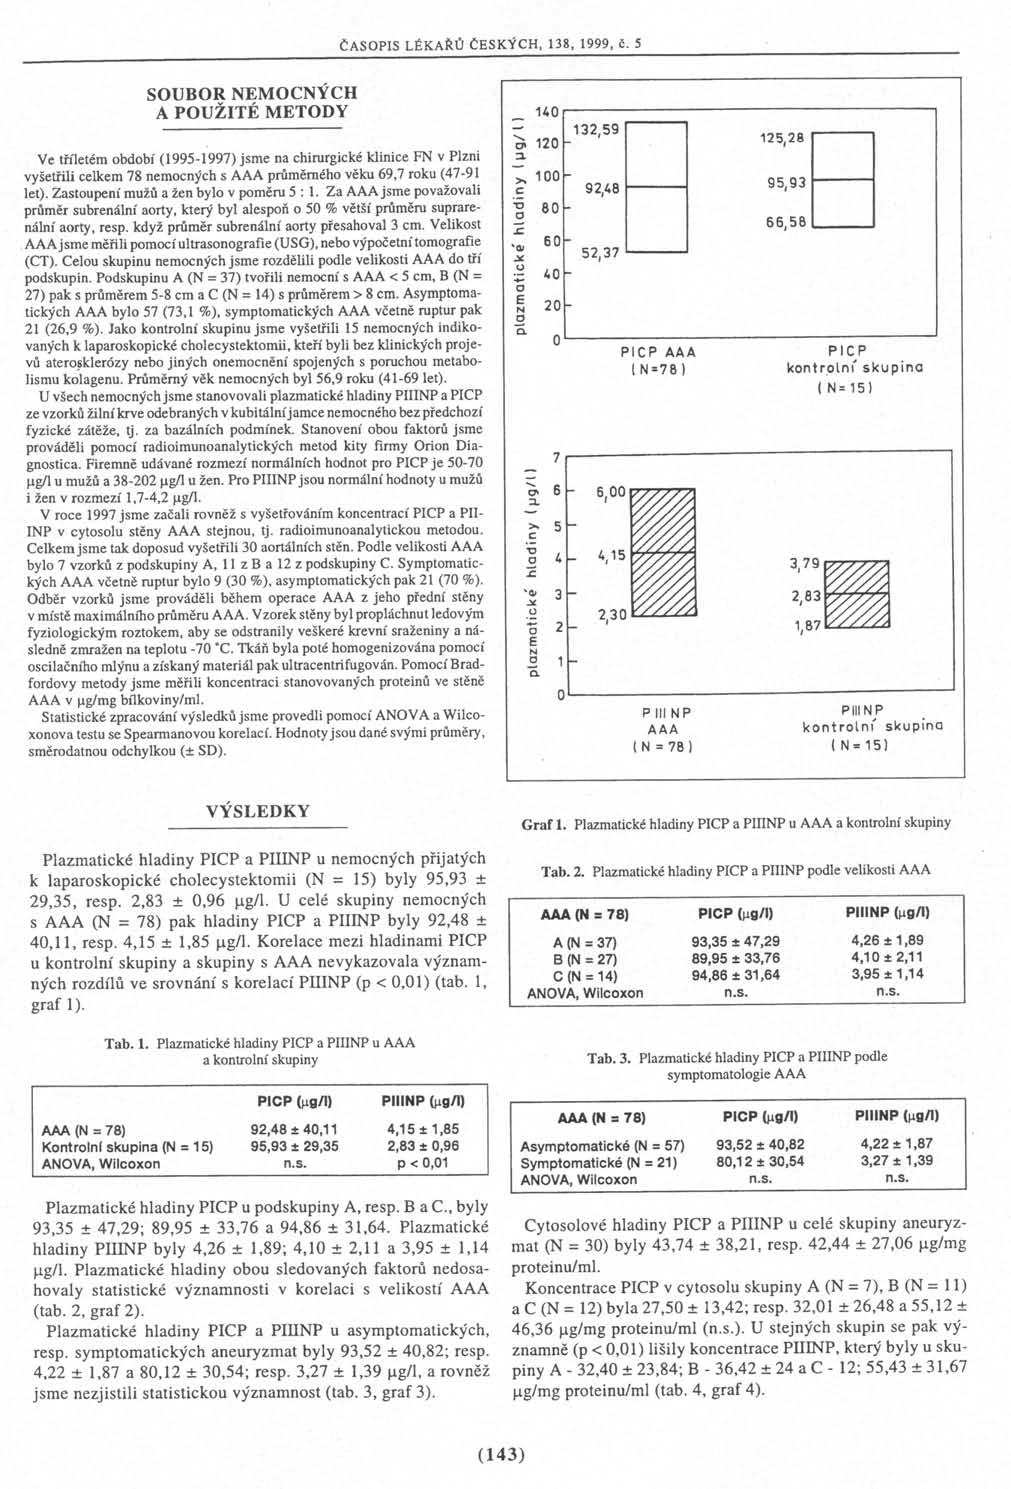
42 40
43 41
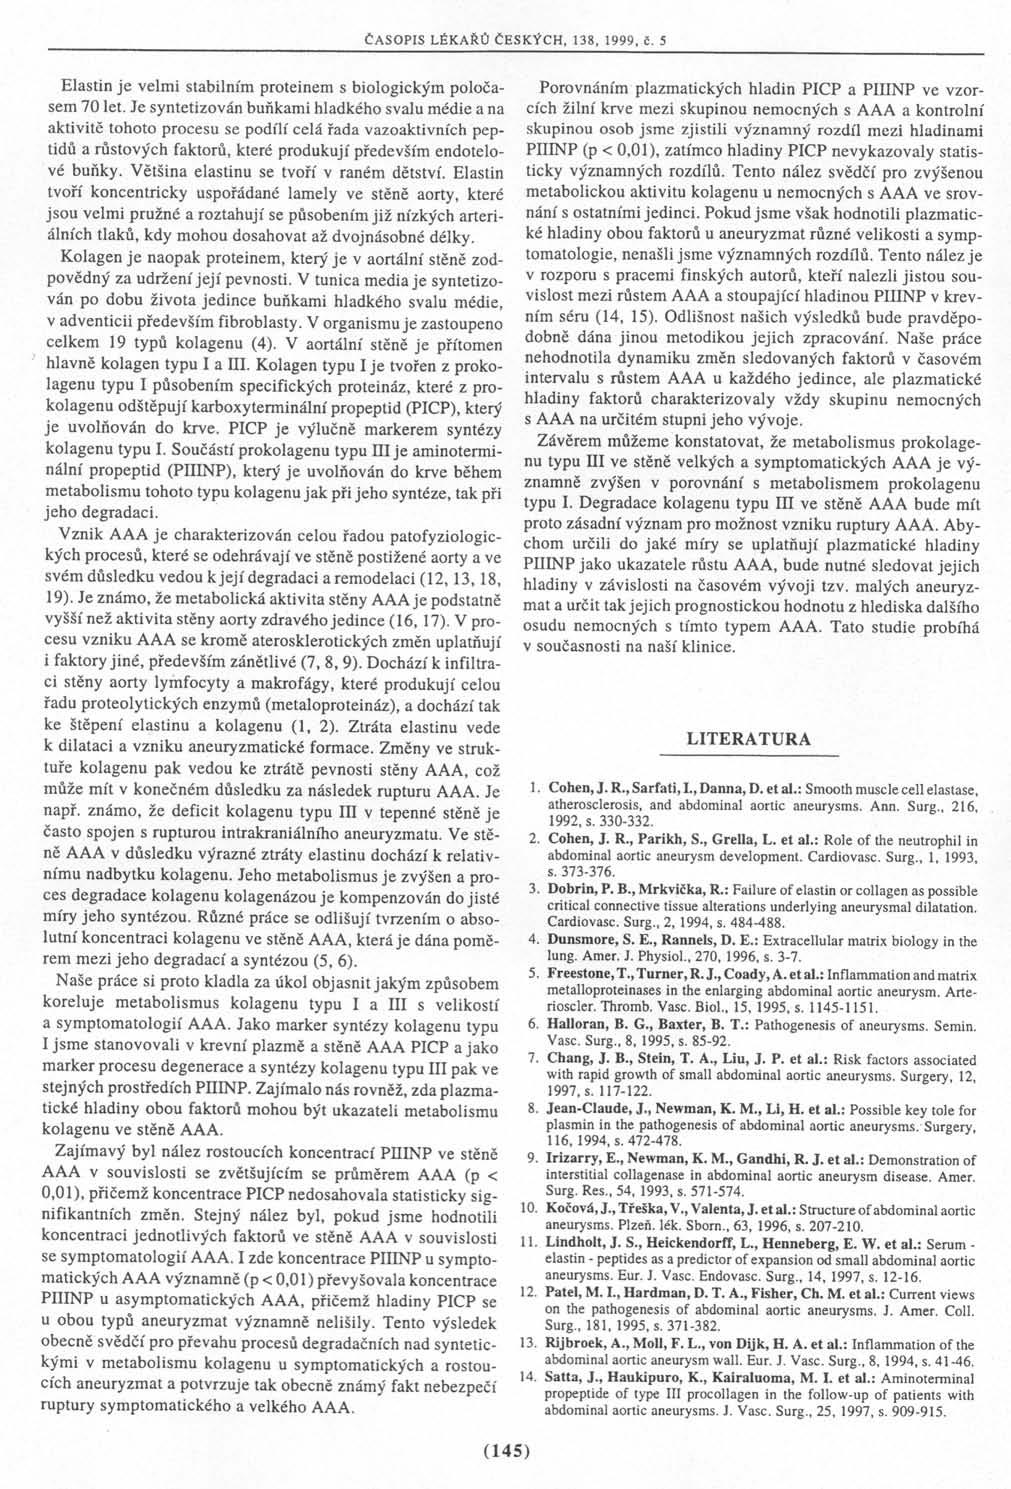
44 42
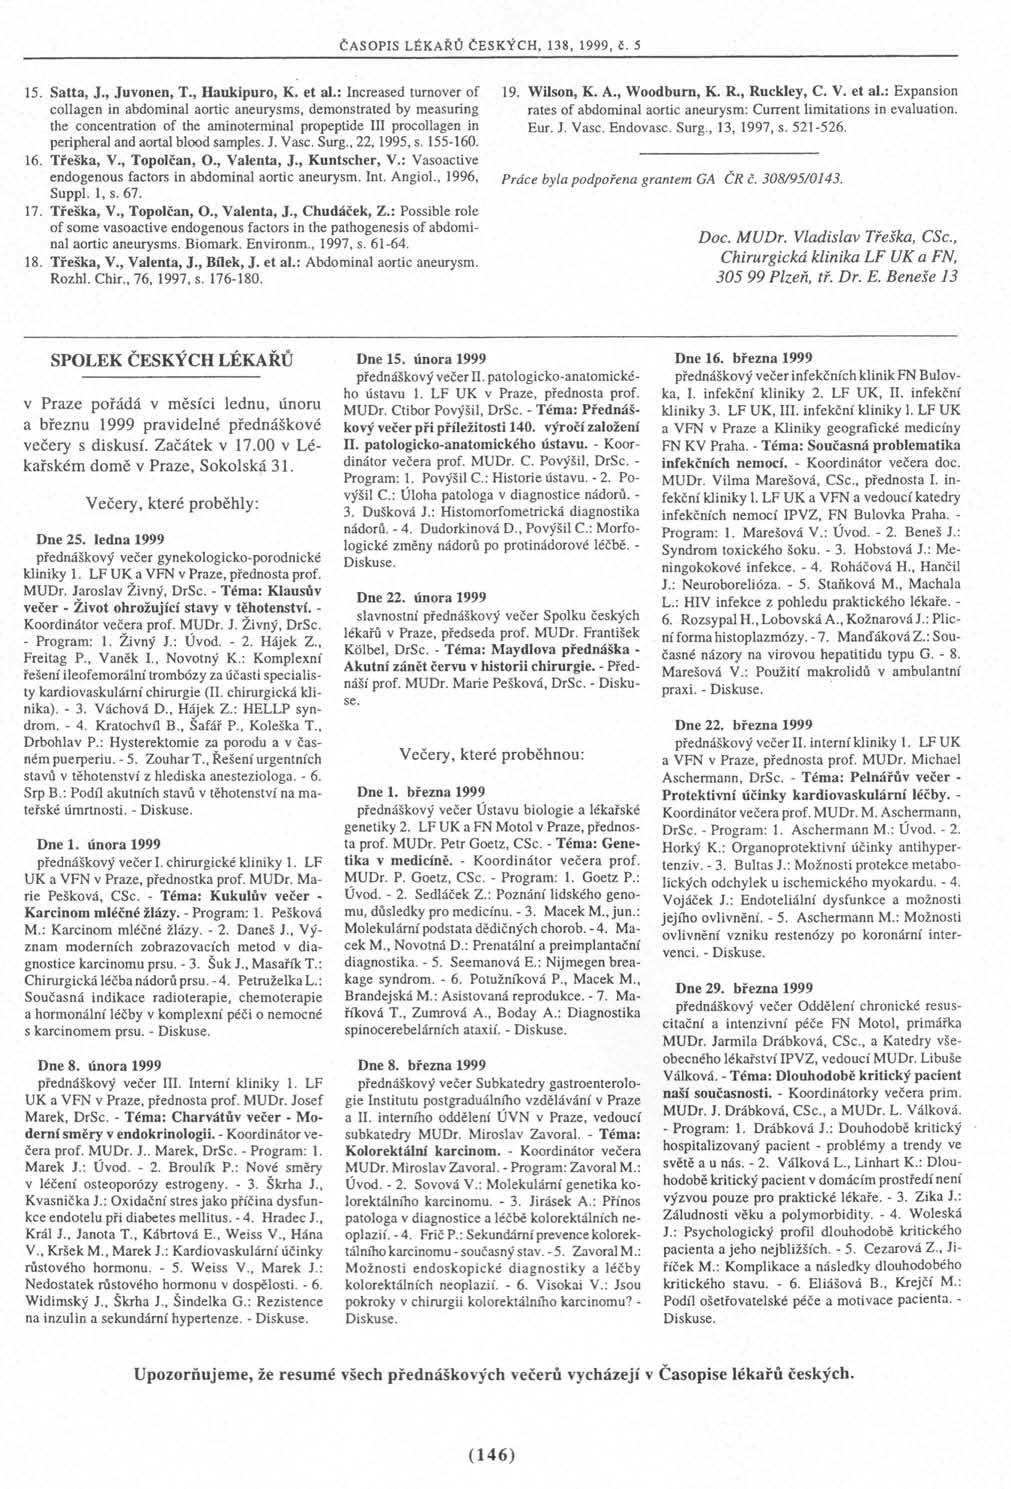
45 43
46 44
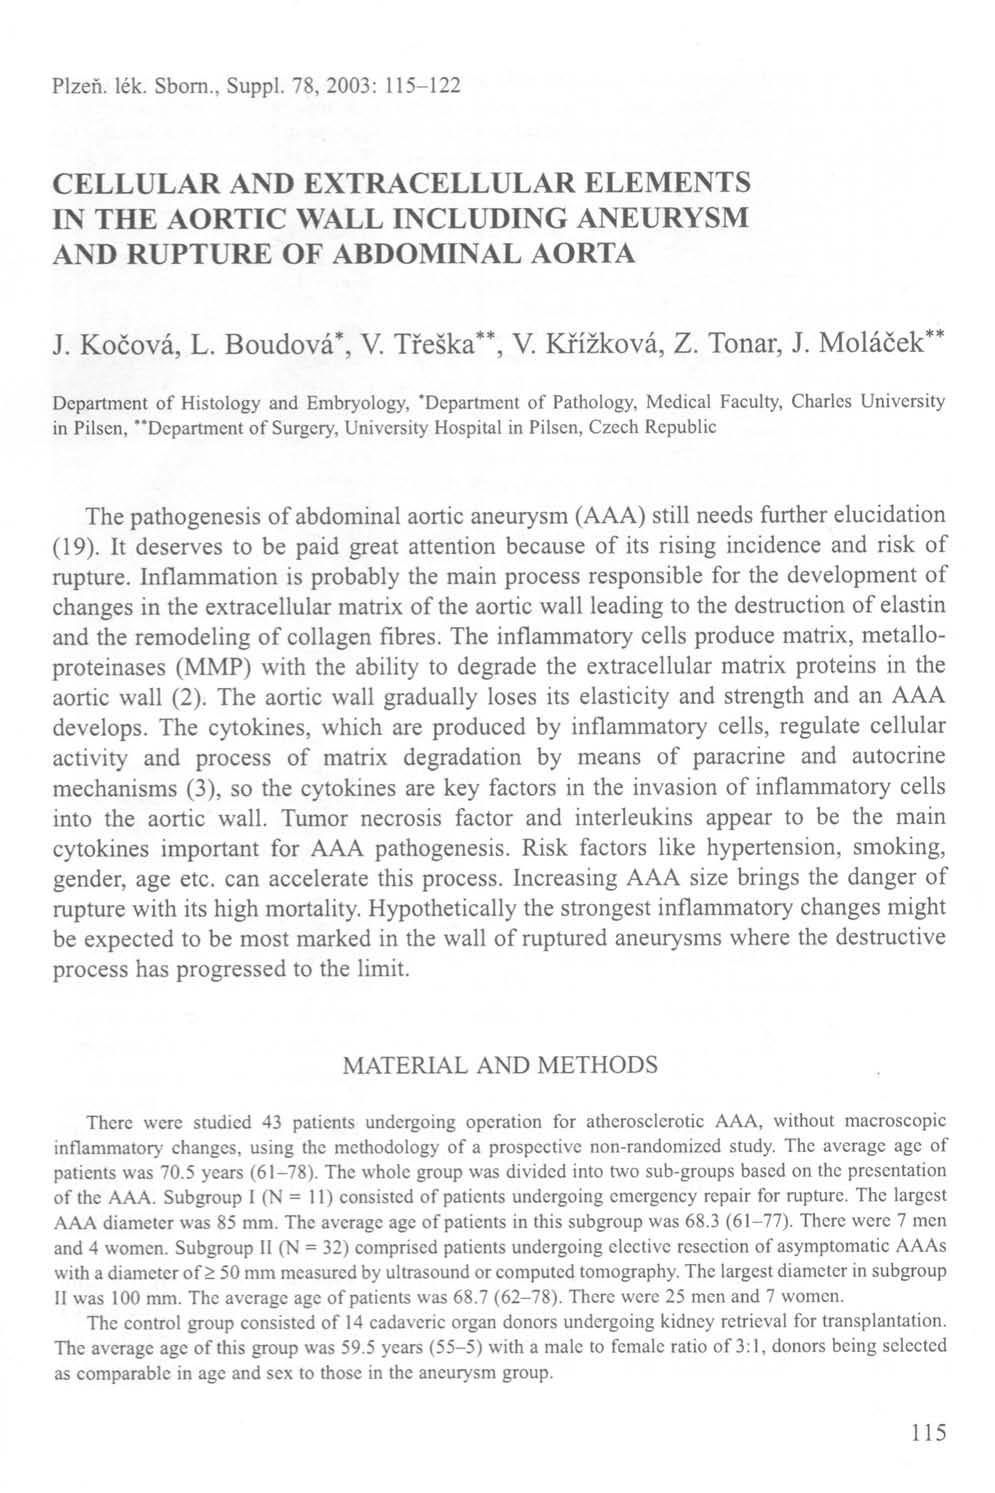
47 45
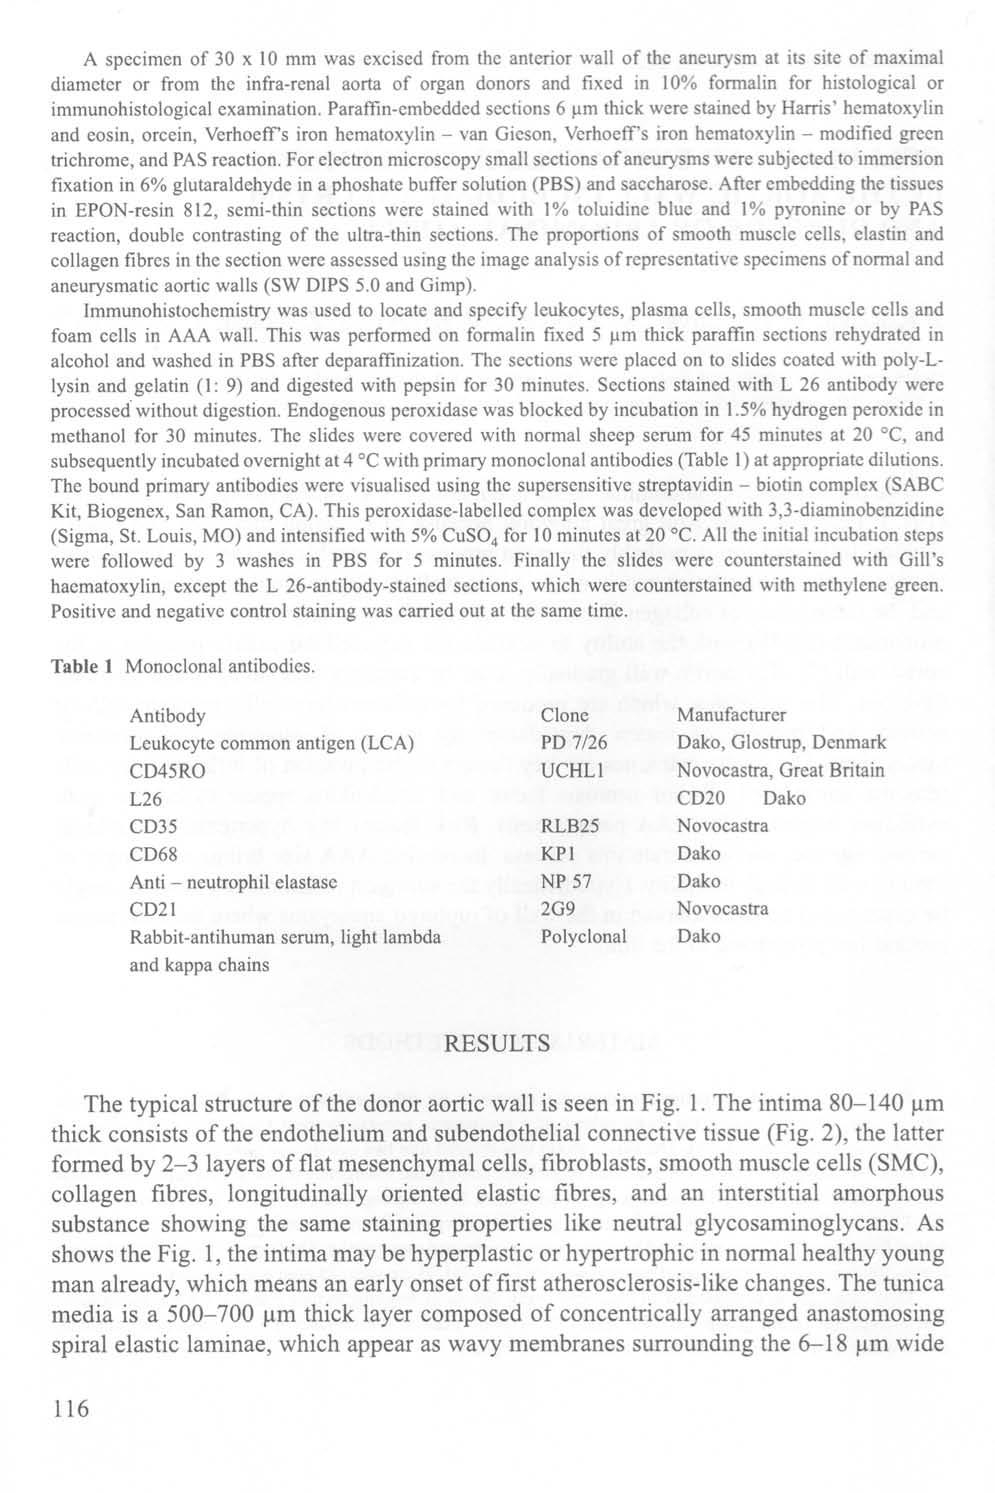
48 46
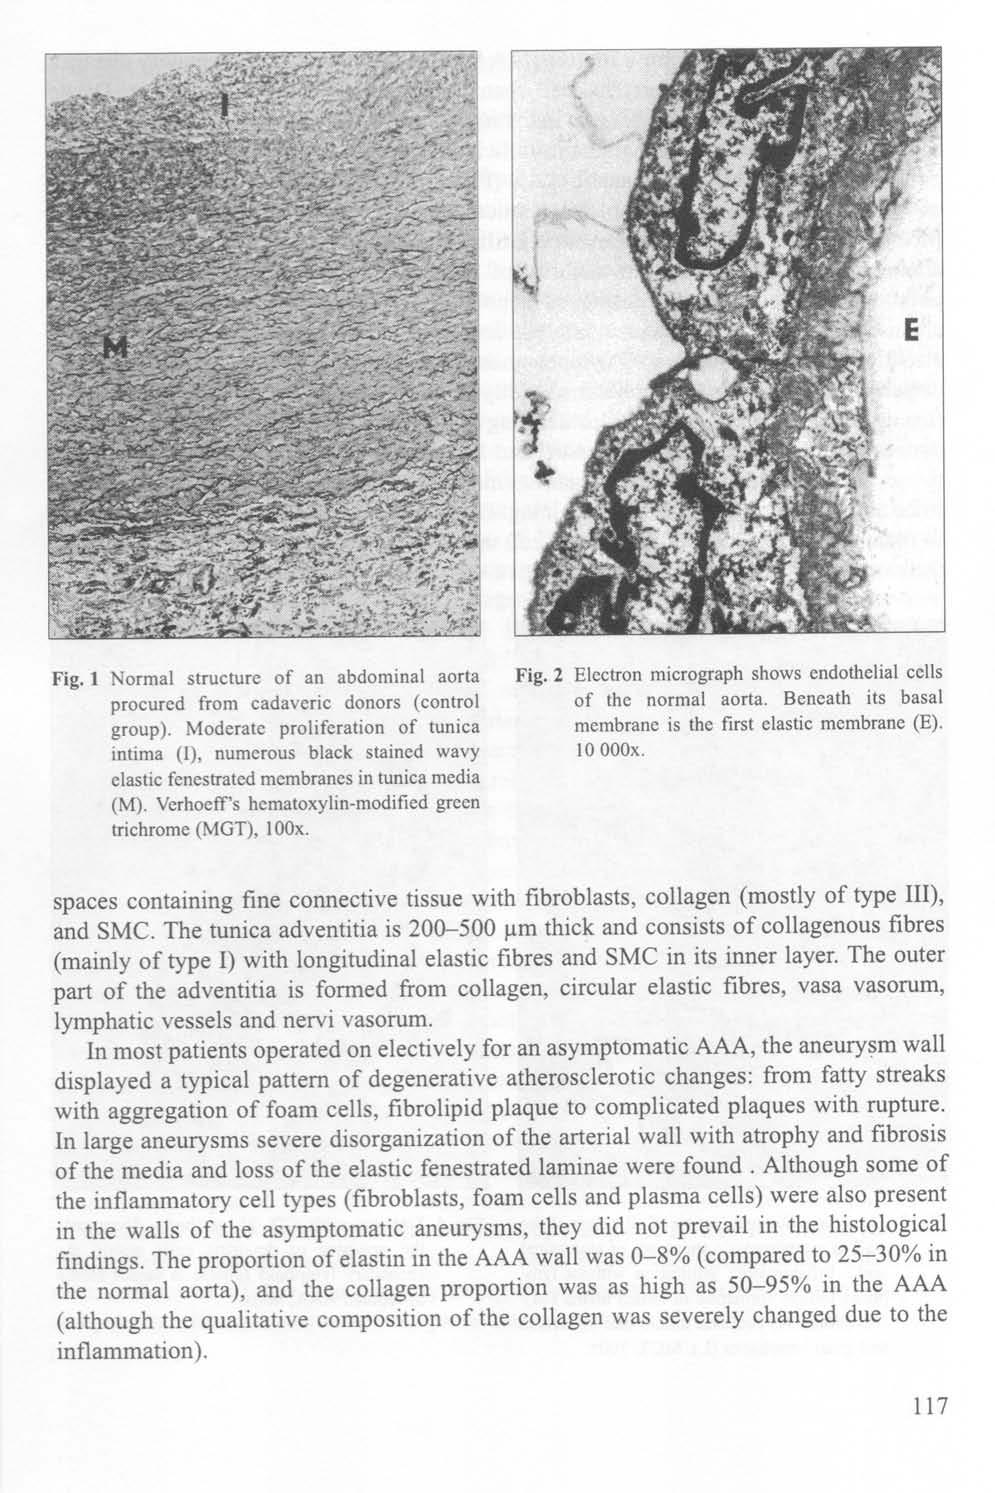
49 47
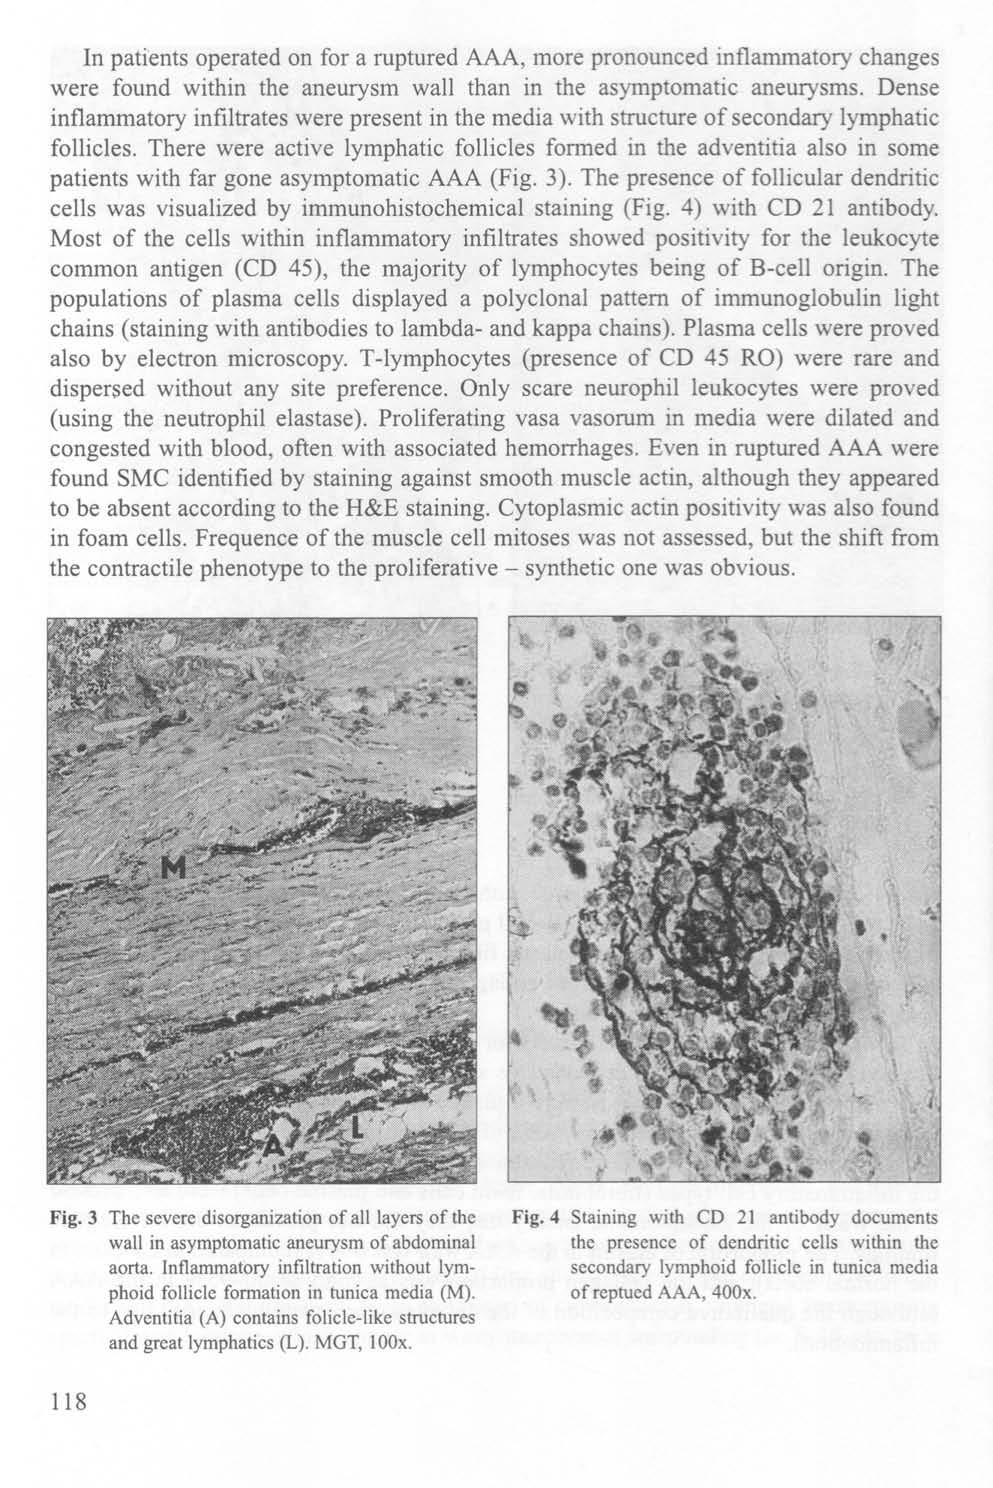
50 48
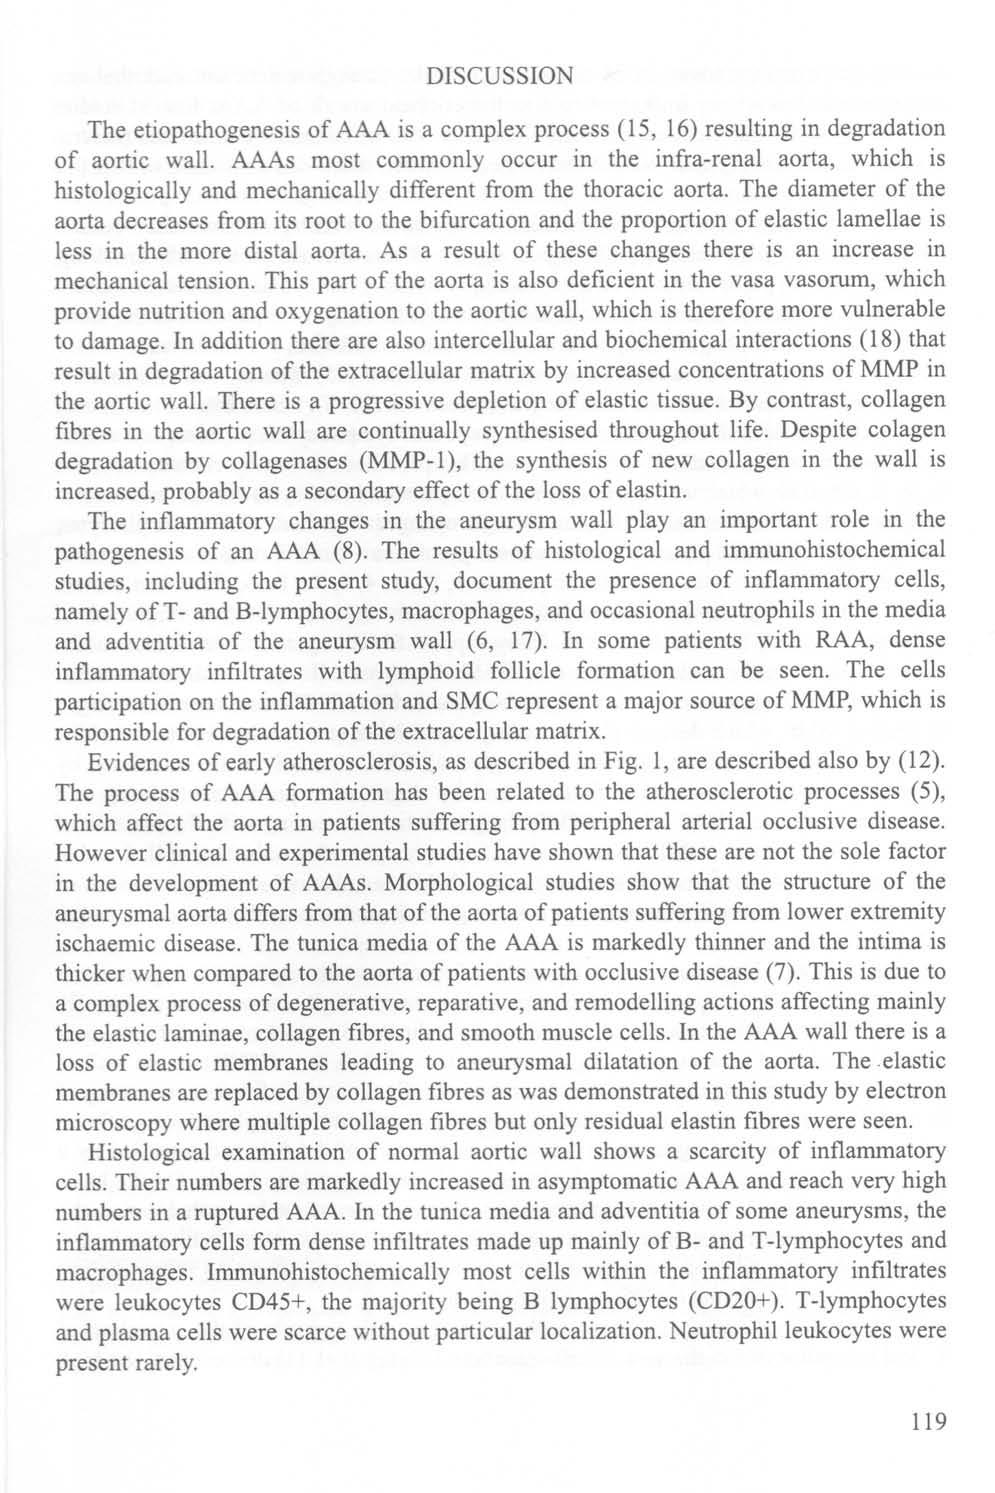
51 49
52 50
53 51
54 52
55 N Cytokines, Cellular & Molecular Therapy N 2002 N Volume 7 Pages 91/97 N 91 Inflammation in the wall of abdominal aortic aneurysm and its role in the symptomatology of aneurysm Vladislav Treska, 1 Jitka Kocova, 2 Ludmila Boudova, 3 Petra Neprasova, 1 Ondrej Topolcan, 4 Ladislav Pecen 5 and Zbynek Tonar 2 Departments of 1 Surgery, 2 Histology, and 3 Pathology, School of Medicine, Charles University, Plzen; 4 Second Internal Clinic, University Hospital, Plzen; 5 Academy of Science, Prague Received 24 July 2002; revised 4 December 2002; accepted 12 December 2002 Abstract Cytosol levels of cytokines [interleukins 1b, 6, 8 (IL-1b, 6, 8), tumor necrosis factor-a (TNF-a)] in aneurysm walls were evaluated in a prospective non-randomized study of 57 patients. The group was divided into two subgroups: Subgroup I (ruptured aneurysms, n/11) and Subgroup II (asymptomatic aneurysms, n/32). A control group consisted of 14 kidney donors. Aortic walls were examined by immunohistochemistry and microscopy to detect inflammatory cells. More pronounced inflammatory changes and higher cytosol cytokine levels [IL6 (pb/0.001), IL8 (pb/ ) and TNFa (pb/0.002)] were found in the walls of ruptured aneurysms than in the asymptomatic aneurysms. Immunohistochemically, most cells within the inflammatory infiltrates stained positively with the monoclonal antibody to the leucocyte common antigen (CD 45). The majority were of B-cell origin, which was demonstrated by positive staining with the monoclonal antibody L26 directed against the CD 20 antigen. These results show that an inflammatory process plays a significant role in patients with ruptured abdominal aortic aneurysms (AAA). A means of modifying the inflammatory process in the wall of AAAs might play an important role in preventing aneurysm rupture. Keywords: Abdominal aortic aneurysm; symptomatology; cytokines; inflammation Introduction Correspondence address: Vladislav Treska MD, PhD, Department of Surgery, Charles University Hospital, Alej svobody 80, Plzen, The Czech Republic (Tel/Fax / ; TRESKA@fnplzen.cz) Taylor & Francis DOI: / The pathogenesis of abdominal aortic aneurysm 1,2,3 (AAA) still needs elucidation. Inflammation is probably the main process responsible for the development of changes in the extracellular matrix of the aortic wall, which lead to the destruction of elastin and remodeling of collagen fibers. The inflammatory cells produce matrix metalloproteinases (MMP) with the ability to degrade the extracellular matrix proteins in the aortic wall. 4,5 The aortic wall gradually loses its elasticity and strength and an AAA develops. The process of matrix degradation is regulated by cytokines, which are produced by various cells and are mainly inflammatory. They regulate the cell s activity by both paracrine and autocrine mechanisms. 6,7 8 Cytokines are key factors in the invasion of inflammatory cells into the aortic wall. Tumor necrosis factor-a (TNF-a) and interleukins (IL) appear to be the main cytokines important for AAA pathogenesis. Risk factors, such as hypertension, smoking, gender and age and accelerate this process. An increase in AAA size brings an increased danger of rupture, with its high mortality. Hypothetically, the strongest inflammatory changes might be expected to be most marked in the walls of ruptured aneurysms, where the destructive process has progressed ultimately. The aim of this study was to identify the factors that play the leading role in the inflammatory process, define their localization in the AAA wall, and correlate them with the clinical presentation of the aneurysm. Materials and methods In a prospective non-randomized study, 43 patients undergoing operation for atherosclerotic AAA, without macroscopic inflammatory changes, were studied. The average age of the patients was 70.5 years (61/78). The group was divided into two sub-groups based on presentation of the AAA. Subgroup I (n/11) consisted of patients undergoing emergency repair for rupture. The largest AAA diameter was 85 mm. The average age of patients in this subgroup was 68.3 (61/77), and there were seven men and four women. Subgroup II (n/32) comprised patients undergoing elective resection of asymptomatic AAAs with a diameter of ]/50 mm, 53
56 92 N V Treska, J Kocova, L Boudova et al. Table 1 Sources of monoclonal antibodies Antibody Clone Manufacturer Leucocyte common antigen (LCA) PD 7/26 Dako, Glostrup, Denmark CD45RO UCHL1 Novocastra, UK L26 CD20 Dako CD35 RLB25 Novocastra CD68 KP1 Dako Anti-neutrophil elastase NP 57 Dako CD21 2G9 Novocastra Rabbit-antihuman serum light Polyclonal Dako lambda, light kappa chains measured by ultrasound or computed tomography. The largest diameter of AAA in Subgroup II was 100 mm. The average age of patients was 68.7 (62/78) years, and there were 25 men and seven women. The control group consisted of 14 cadaveric organ donors undergoing kidney retrieval for transplantation. The average age of this group was 59.5 years (55/65) with a male to female ratio of 3:1, donors were selected to be comparable in age and sex to those in the aneurysm group. A specimen, 30/10 mm, was excised from the anterior wall of the aneurysm at its site of maximal diameter, or from the infra-renal aorta of organ donors, and fixed in 10% formalin for histological or immunohistological examination, or snap frozen to /708C for cytosol evaluation. Paraffin-embedded sections 6 mm thick were stained by Harris s hematoxylin and eosin, orcein, Verhoeff?s iron hematoxylin / van Gieson, Verhoeff s iron hematoxylin / modified green trichrome, PAS (periodic acid-schiff) technique. Small sections of aneurysms were subjected to immersion fixation in 6% glutaraldehyde in a phosphate buffer solution (PBS) and saccharose and to post-fixation using 1% osmium tetroxide in PBS for electron microscopy. After embedding the tissues in EPON- resin 812, semi-thin sections were stained with 1% toluidine blue and 1% pyronine. Double-staining was performed by saturated uranyl acetate and Reynold s lead citrate. The proportions of smooth muscle cells, elastin and collagen fibers in the section were assessed by image analysis of representative specimens of normal and aneurysmal aortic walls (using the software DIPS 5.0 and Gimp). Immunohistochemistry was used to locate and specify leucocytes, plasma cells, smooth muscle cells and foam cells in AAA wall. This was performed on formalin-fixed 5 mm thick paraffin sections, rehydrated in alcohol and washed in PBS after deparaffinization. The sections were placed on slides coated with poly-l-lysin and gelatin (1:9) and digested with pepsin for 30 min. Sections stained with L 26 antibody were processed without digestion. Endogenous peroxidase was blocked by incubation in 1.5% hydrogen peroxide in methanol for 30 min. The slides were covered with normal sheep serum for 45 min at 208C, and subsequently incubated overnight at 48C with primary monoclonal antibodies (Table 1) at appropriate dilutions. The bound primary antibodies were visualized using the supersensitive streptavidin-biotin complex (SABC Kit, Biogenex, San Ramon, CA, USA). This peroxidaselabelled complex was developed with 3,3-diaminobenzidine (Sigma, St Louis, MO, USA) and intensified with 5% CuSO 4 for 10 min at 208C. All the initial incubation steps were followed by three washes in PBS for 5 min. Finally, the slides were counterstained with Gill s haematoxylin, apart from the L 26-antibody-stained sections, which were counterstained with methylene green. Positive and negative control staining was carried out at the same time. Cytosol levels of proinflammatory cytokines */ TNFa, IL1b, 6 and 8 */ were examined in the same patients. The wall samples were cleared of thrombus with iced saline and immediately frozen to /708C with liquid nitrogen. The samples were homogenized to particles B/0.001 mm by oscillatory mill permanent refrigeration with liquid nitrogen. The powder was ultracentrifugated ( g/l) at 2/48C in TRIS homogenized buffer (ph 7.4) containing 1 mm monothioglycerol. The protein concentration in the supernatant was examined using the Bradford method. Cytosolic cytokine concentrations were assayed using the enzymoimmunoanalytic technique (Imunotech, France). The intra-assay, or alternatively inter-assay coeficient of variation in the respective methods was 8%, and B/10%. The general principle of the enzymoimmunoanalytic method was a sandwich-type assay with two immunological steps. The first step led to the capture of cytokines by the monoclonal anti-cytokine-antibody bound to the walls of a microtitre plate. In the second step, a second monoclonal anti-cytokine-antibody linked to acetylcholinesterase was added. After incubation, the wells were emptied, washed and bound enzymatic activity was measured by adding a chromogenic substrate, the intensity of colour produced was proportional to the cytokine concentration in the sample or standard. Statistical analysis was done using SAS (Statistical Analyses Software), release 8.00, Carry, USA. Results were calculated with means9/sd, and the non-parametric Wilcoxon and Kruskal/Wallis tests were used for statistical analysis, with p B/0.05 considered significant. Results The typical structure of the donor aortic wall is shown in Figure 1. The intima, 80/140 mm thick, consists of endothelium and subendothelial connective tissue, the latter formed by 2/3 layers of flat mesenchymal cells, fibroblasts and Langerhans cells, smooth muscle cells (SMC), collagen fibers, longitudinally oriented elastic fibers, and an interstitial amorphous substance showing the same staining properties as glycosaminoglycanes. 54
, 100X.")

 with longitudinal elastic fibers and SMC in its inner layer.")
57 Inflammation in AAA and its role in the symptomatology of aneurysm N 93 Figure 1 Normal structure of an abdominal aorta from cadaveric donor (control group). Moderate proliferation of tunica intima, numerous black-stained wavy elastic fenestrated membranes in tunica media. Verhoeff?s hematoxylin / modified green trichrome (MGT), 100X. Figure 2 The severe disorganization of all layers of the wall in asymptomatic aneurysm of abdominal aorta. Inflammatory infiltration without lymphoid follicle formation. MGT, 100X. The tunica media is a 500/700 mm thick layer, composed of concentrically arranged anastomosed spiral elastic laminae, which appear as wavy membranes surrounding the 6/18 mm wide spaces containing fine connective tissue with fibroblasts, collagen (mostly Type III), and smooth muscle cells (SMC). The tunica adventitia is 200/500 mm thick and consists of collagenous fibres (mainly of Type I) with longitudinal elastic fibers and SMC in its inner layer. The outer part of the adventitia is formed from collagen, circular elastic fibres, vasa vasorum, lymphatic vessels and nervi vasorum. In most patients operated on electively for an asymptomatic AAA, the aneurysm wall displays a typical pattern of degenerative atherosclerotic changes: from fatty streaks with aggregation of foam cells, to fibrolipid plaques and then to complicated plaques with rupture. In large aneurysms, severe disorganization of the arterial wall, with atrophy and fibrosis of the media, and loss of the elastic fenestrated laminae were found. Although the inflammatory cells (fibroblasts, foam cells and plasma cells) were also present in the walls of the asymptomatic aneurysms, they did not dominate the histological picture (Figure 2). In patients operated on following a ruptured AAA, more pronounced inflammatory changes were found within the aneurysm wall than in the asymptomatic aneurysms. Dense inflammatory infiltrates were present in the media, with a structure of secondary lymphatic follicles (Figure 3). The presence of follicular dendritic cells was visualized by immunohistochemical staining (Figure 4) with CD 21 antibody. Most of the cells within the inflammatory infiltrates were positive for the leukocyte common antigen (CD 45), the majority of lymphocytes being of B-cell origin. The populations of plasma cells displayed a polyclonal pattern of immunoglobulin Figure 3 Further stage of inflammation represented by secondary lymphoid follicles in the tunica media of ruptured abdominal aneurysm. MGT, 250X. light chains (staining with antibodies to lambda- and kappa chains). Plasma cells were also shown by electron microscopy (Figure 5). T-lymphocytes (shown by the presence of CD 45 RO) were rare and dispersed, without any site of preference. Only scarce neutrophil leukocytes were proved (using the neutrophil elastase). Proliferating vasa vasorum in media were dilated and congested with blood, often with associated hemorrhages. Even in ruptured AAA SMC were identified by staining against smooth muscle actin, although they were not shown by H & E staining. Cytoplasmic actin positivity was also found in foam cells. The frequency of muscle cell mitoses was not assessed, but the shift from contractile phenotype to the proliferative-synthetic type was obvious. 55
, TNF-a (p B/0.004) compared with their concentrations in the walls of asymptomatic aneurysms (Table 2).")
, when compared with specimens from the walls of asymptomatic aneurysms (Table 3).")
58 94 N V Treska, J Kocova, L Boudova et al. The control group of abdominal aortas had significantly lower cytosol concentrations of IL-1b (p B/ ), IL-6 (p B/0.0001), IL-8 (p B/0.0001), TNF-a (p B/0.004) compared with their concentrations in the walls of asymptomatic aneurysms (Table 2). In patients with AAA rupture, the cytosolic concentrations of IL-6, IL-8 and TNF-a were significantly higher (p B/0.0001, p B/0.003 and p B/0.002 respectively), when compared with specimens from the walls of asymptomatic aneurysms (Table 3). We did not find any significant differences in the cytosolic cytokine levels between patients with intra- or retro-peritoneal rupture. Discussion Figure 4 Staining with CD 21 antibody shows the presence of dendritic cells within the secondary lymphoid follicle in tunica media of ruptured AAA, 400X. Figure 5 Electron micrograph shows the plasma cells with well-developed rough endoplamic reticulum producing antibodies. These cells were found in tunica media of ruptured AAA and are typical for chronic inflammatory conditions, X. The etiopathogenesis of AAA is a complex process, resulting in degradation of the aortic wall. AAAs most commonly occur in the infra-renal aorta, which is histologically and mechanically different from the thoracic aorta. The diameter of the aorta decreases from its root to the bifurcation, and the proportion of elastic lamellae is less in the more distal aorta. As a result of these changes there is an increase in mechanical tension. This part of the aorta is also deficient in vasa vasorum, which provide nutrition and oxygenation to the aortic wall, and is therefore more vulnerable to damage. In addition, there are also intercellular and biochemical interactions 9 that result in degradation of the extracellular matrix as a result of increased concentrations of MMP in the aortic wall. There is a progressive depletion of elastic tissue. By contrast, collagen fibers in the aortic wall are continually synthesized throughout life. Despite collagen degradation by collagenases (MMP-1), the synthesis of new collagen in the wall is increased, probably as a secondary effect of the loss of elastin. The net result of this process is that the ultimate elastin concentration in the AAA wall is only 5/8% (compared with 25/30% in the normal aorta), and the collagen concentration may be as high as 95%. The inflammatory changes in the aneurysm wall probably play an important role in the pathogenesis of an AAA. 10,11,12 The results of histological and immunohistochemical studies, including the present study, document the presence of inflammatory cells, namely T- and B-lymphocytes, macrophages and occasional neutrophils, in the media and adventitia of the aneurysm wall. 13,14,15,16 Dense inflammatory infiltrates with lymphoid follicle formation are seen in some patients. The inflammatory cells and SMC represent a major source of MMP, which is responsible for degradation of the extracellular matrix. The process of AAA formation has been related to the atherosclerotic processes, which affect the aorta in patients suffering from peripheral arterial occlusive disease. However, clinical and experimental studies have shown that these are not the sole factor in the development of AAAs. 17,18,19 Morphological studies show that the structure of the aneurysmal aorta differs from that of the aorta of patients suffering from lower Patients (n) IL-1b IL-6 IL-8 TNF-a AAA / / / /22.9 Controls / / / /9.2 Wilcoxon - pb/ pb/ pb/ pb/0.002 Kruskal-Wallis - pb/ pb/ pb/ pb/0.002 Table 2 Comparison of cytosolic cytokine concentrations of asymptomatic AAA with controls 56
59 Inflammation in AAA and its role in the symptomatology of aneurysm N 95 Patients (n) IL-1b IL-6 IL-8 TNF-a AAA / / / /22.9 RUP / / / /220.6 Wilcoxon - pb/0.54 pb/0.001 pb/ pb/0.002 Kruskal-Wallis - pb/0.53 pb/0.001 pb/ pb/0.002 Table 3 Correlation of cytosolic levels of cytokines in patients with ruptured (RUP) and asymptomatic AAA extremity ischemic disease. The tunica media of the AAA is markedly thinner, and the intima is thicker when compared with the aorta of patients with occlusive disease. 20,21,22 This results from a complex process of degenerative, reparative and remodelling actions, affecting mainly the elastic laminae, collagen fibers and SMCs. In the AAA wall there is a loss of elastic membranes leading to aneurysmal dilatation of the aorta. The elastic membranes are replaced by collagen fibers, as was demonstrated in this study by electron microscopy where multiple collagen fibers but only residual elastin fibers were seen. Our previous picture analysis study showed the dominance of collagen fibers, amounting to 83% of the wall mass in a cumulative histogram of an AAA. By contrast, the elastic membranes represented only 6.7% of the mass, compared with 29.6% in control aorta. Histological examination of normal aortic wall shows a scarcity of inflammatory cells. Their numbers are markedly increased in asymptomatic AAAs and reach very high numbers in ruptured AAAs. In the tunica media and adventitia of some aneurysms, the inflammatory cells form dense infiltrates made up mainly of B- and T-lymphocytes and macrophages. Immunohistochemically, most cells within the inflammatory infiltrates were leucocytes CD45, the majority being B lymphocytes (CD20). T lymphocytes and plasma cells were rare without particular localization. Neutrophil leukocytes were also rarely present. Distinct from the invasion of inflammatory cells through a deficient endothelium, angiogenesis has a very important role in the ethiopathogenesis of AAA. Recent studies 23,24,25,26 show that neovascularization coexists with inflammatory infiltrates (macrophages) in the aneurysmal wall. Marked neovascularization was also observed in this study. The initial step leading to invasion of the aortic wall by inflammatory cells is endothelial injury by various pathological agents. These include particularly smoking, hypertension, hyperlipidemia, viruses, oxidized lipids, and Chlamydiae, but there is also a direct effect from cytokines, which are released from monocytes or platelets in the blood 27 and from macrophages, lymphocytes, fibroblasts and SMC in the aortic wall. The role of cytokines is clear in aneurysmal dilatation. 28,29,30,31 The injured endothelium expresses on its surface adhesion molecules (selectins P, I, E), which belong to a family of cytokines. Selectins are important for migration of lymphocytes, platelets and monocytes into the tunica media of the AAA wall. This process is driven by chemoattractants (e.g. IL-6 and -8), which activate integrins via G protein. Monocytes change into macrophages after transendothelial migration. Macrophages, together with T lymphocytes, SMC, endothelium and platelets, secrete various cytokines, e.g. transforming growth factor-b, TNF-a, platelet-derived growth factor, monocytes chemotactic protein / 1, IL-1, -4, -6, -8, a basic fibroblast growth factor / which further impair the endothelial function and allow further migration of inflammatory cells into the AAA wall. They also support SMC migration from tunica media to the tunica intima of the aneurysm wall. SMC releases IL-6, in addition to other cytokines, which stimulate B and T lymphocytes. IL-1 and TNF-a activate macrophages to secrete MMP, which destroy elastin, collagen and other structural components of the aortic wall (laminin, fibronectin and proteoglycan). SMC are themselves stimulated by cytokines through the autocrine function, and by degradation products of elastin and collagen. 32,33,34,35 Stimulated SMC release MMP, the production increasing with the patients advancing age. MMP are secreted by T lymphocytes after activation of IL-1 and -6. Cytokines not only promote the secretion of MMP, but also reduce the production of tissue inhibitor of metalloproteinases, so promoting the degradation and remodelling of the AAA wall. 35 In this study, the level of cytokines was appreciably higher in patients with AAA compared to donor aortas. There were high concentrations of IL-1b, -6, -8 and TNF-a in patients with AAA, which may indicate an important role for cytokines in the formation of an aneurysm. High concentration of IL-6, -8 and TNF-a in the wall of ruptured aneurysms, together with the occurrence of inflammatory infiltrates consisting of B- and T-lymphocytes and macrophages, were evidence that inflammation played a significant role in the process leading to aneurysm rupture. Rupture of AAA is accompanied by a systemic inflammatory response, with elevation of plasma cytokine levels. However, on the basis of raised cytokine levels in asymptomatic aneurysms, it seems probable that the highest inflammatory response that is present in ruptured AAAs is the result of a long-standing, steadily progressive inflammatory process in the wall of AAAs, rather than acute elevation of plasma cytokines in response to rupture. IL-6 is released mainly from macrophages, and its role comprises activation of T- and B-lymphocytes in the area of inflammation. Brophy et al. 36 documented high concentrations of immunoglobulins in the AAA wall, which probably correlates directly with IL-6 concentration. It has been questioned whether IL-6 positively influences the autoimmune processes in the AAA wall
60 96 N V Treska, J Kocova, L Boudova et al. The main sources of IL-8 are monocytes, endothelium, T lymphocytes and fibroblasts. IL-8 is the important chemotactic factor for neutrophils: it inhibits their migration and so indirectly promotes their aggregation in the aneurysm wall. It has a direct effect on the production of MMP in macrophages and is an important factor in extracellular matrix degradation. TNF-a is released by activated lymphocytes, macrophages, granulocytes and fibroblasts. Apart from its proinflammatory effects, it has a significant role in angiogenesis, which plays a prominent role in the etiopathogenesis of AAA. Mignatti et al. demonstrated elevated production of MMP mainly in the areas of angiogenesis in the AAA wall. This study, in common with other authors, found significant elevation of TNF-a levels in the walls of asymptomatic aneurysms in comparison with donor aortas. The highest TNF-a concentrations, like the most pronounced inflammatory changes, were in the walls of ruptured aneurysms, demonstrating the significance of inflammation in AAA symptomology. Whether TNF-a is the cause or result of aneurysmal dilatation remains unresolved. 38,39,40 By combining our histological and immunohistochemical pictures of asymptomatic and ruptured aneurysms in this study it is evident that the foci of dense infiltrates of inflammatory cells are especially prominent in areas of neovascularization, and most pronounced in ruptured AAAs. This correlates well with high concentrations of IL-6, -8, and TNF-a in this type of AAA. Conclusion Ruptured aneurysms show the most severe inflammatory response. This response is responsible for the significant degradation of the extracellular matrix and the ultimate catastrophic event of aneurysm rupture. The results of this study concur with data from the literature, 41,42 and suggest that the reduction or blockade of the inflammatory process within the wall of the aorta by antiinflammatory agents might play an important role in preventing the growth and rupture of AAAs. References 1. Wilmink AB, Quick CR, Epidemiology and potential for prevention of abdominal aortic aneurysm. Br J Surg (1998) 85: 155/ Guirguis EM, Barber GG, The natural history of abdominal aortic aneurysms. Am J Surg (1991) 162: 481/3. 3. Collin J, Aortic aneurysms: aetiology and prevalence. In: Arterial aneurysms (ed M Horrocks). Butterworth-Heinemann Ltd, Oxford, 1995, 1/ Curci JA, Liao S, Huffman MD, Shapiro SD, Expression and localization of macrophage elastase (matrix metalloproteinase-12) in abdominal aortic aneurysms. J Clin Invest (1998) 102: 1900/ Mecham RP, Broekelmann TJ, Fliszar CJ, Shapiro SD, Elastin degradation by matrix metalloproteinases. Cleavage site specifity and mechanisms of elastolysis. J Biol Chem (1997) 272: 18071/6. 6. Froon AHM, Greve JWM, Vanderlinden CJ, Buurman WA, Increased concentrations of cytokines and adhesion molecules in patients after repair of abdominal aortic aneurysm. Eur J Surg (1996) 162: 287/ Patel MI, Hardman DTA, Fisher ChM, Appelberg M, Current views on the pathogenesis of abdominal aortic aneurysms. JAm Coll Surg (1995) 181: 371/ Halloran BG, Baxter BT, Pathogenesis of aneurysms. Sem Vasc Surg (1995) 8: 85/ Wills A, Thompson MM, Crowether M, Sayers RD, Pathogenesis of abdominal aortic aneurysms / cellular and biochemical mechanisms. Eur J Vasc Endovasc Surg (1996) 12: 391/ Rijbroek A, Moll FL, Dijk HA, Meijer R, Inflammation of the abdominal aortic aneurysm wall. Eur J Vasc Surg (1994) 8: 41/ Brophy CM, Reilly JM, Smith GJ, Tilson MD, The role of inflammation in nonspecific abdominal aortic aneurysm disease. Ann Vasc Surg (1991) 5: 229/ Rehm JP, Grange JJ, Baxter BT, The formation of aneurysm. Sem Vasc Surg (1998) 11: 193/ Juvonen J, Surcel HM, Satta J, Teppo AM, Elevated circulating levels of inflammatory cytokines in patients with abdominal aortic aneurysm. Arterioscler Thromb Vasc Biol (1997) 17: 2843/ Freestone T, Turner RJ, Coady A, Higman DJ, Inflammation and matrix metalloproteinases in the enlarging abdominal aortic aneurysm. Arterioscler Thromb Vasc Biol (1995) 15: 1145/ Watanabe T, Haraoka S, Shimokama T, Inflammatory and immunological nature of atherosclerosis. Int J Cardiol (1996) 54: S25/ Jones KG, Brull DJ, Brown LC, Sian M, Interleukin-6 (IL-6) and the prognosis of abdominal aortic aneurysms. Circulation (2001) 103: 2260/ Rowlands TE, Homer-Vanniasinkam S, Pro-and anti-inflammatory cytokine release in open versus endovascular repair of abdominal aortic aneurysm. Br J Surg (2001) 88: 1335/ Satta J, Soini Y, Pollanen R, Paakko P, Tenascin expression is associated with a chronic inflammatory process in abdominal aortic aneurysms. J Vasc Surg (1997) 26: 670/ Szekanecz Z, Shah MR, Pearce WH, Koch AE, Human atherosclerotic abdominal aortic aneurysms produce interleukin (IL)-6 and interferon gamma but not IL-2 and IL-4: the possible role for IL-6 and interferon-gamma in vascular inflammation. Agents Actions (1994) 42: 159/ Kocova J, Histopathology of abdominal aortic aneurysm. In: Abdominal Aortic Aneurysm (ed V Treska). Grada Publishing, Prague, 1999, 18/ Zarins Kch, Seymour G, Artery wall pathology in atherosclerosis. In: Vascular Surgery (ed RB Rutherford). WB Saunders, Philadelphia, 1995, 204/ Grange JJ, Davis V, Baxter BT, Pathogenesis of abdominal aortic aneurysm: an update and look toward the future. Cardiovasc Surg (1997) 5: 256/ Kocova J, Treska V, Valenta J, Reischig J, Microscopical structure of aortic aneurysms. Anatom Anz (1997) 179: S Thompson MM, Jones L, Nasim A, Sayers RD, Angiogenesis in abdominal aortic aneurysms. Eur J Vasc Endovasc Surg (1996) 11: 464/ Satta J, Soini Y, Mosorin M, Juvonen T, Angiogenesis is associated with mononuclear inflammatory cells in abdominal aortic aneurysms. Ann Chir Gynecol (1998) 87: 40/ Holmes DR, Liao S, Parks WC, Thompson RW, Medial neovascularisation in abdominal aortic aneurysms: a histopathologic marker of aneurysmal degeneration with pathophasiologic implications. J Vasc Surg (1995) 21: 761/ Ross R, The pathogenesis of atherosclerosis: a perspective for the 1990s. Nature (1993) 362: 801/ Hingorani A, Ascher E, Scheinman M, Yorkovich W, The effect of tumor necrosis factor binding protein and interleukin-1 receptor antagonist on the development of abdominal aortic aneurysms in a rat model. J Vasc Surg (1998) 28: 522/ Davis VA, Persidskaia RN, Baca-Regen LM, Fiotti N, Cytokine pattern in aneurysmal and occlusive disease of the aorta. J Surg Res (2001) 101: 152/6. 58
61 Inflammation in AAA and its role in the symptomatology of aneurysm N Lepidi S, Kenagy RD, Raines EW, Chiu ES, MMP9 production by human monocyte-derived macrophages is decreased on polymerized type I collagen. J Vasc Surg (2001) 34: 1111/ Treska V, Topolcan O, Wenham PW, Pecen L, Metabolism of cytokines in abdominal aortic aneurysms. Rozhl chir (1998) 77: 225/ Marian AJ, On genetics, inflammation, and abdominal aortic aneurysm: can single nucleotide polymorphisms predict the outcome? Circulation (2001) 103: 2222/ Henderson EL, Geng YJ, Sukhova GK, Whittemore AD, Death of smooth muscle cells and expression of mediators of apoptosis by T lymphocytes in human abdominal aortic aneurysms. Circulation (1999) 99: 96/ Lopez-Candales A, Holmes D, Liao S, Scott M, Decreased vascular smooth muscle cell density in medial degeneration of human abdominal aortic aneurysms. Am J Pathol (1997) 150: 993/ Allaire E, Forough R, Clowes M, Starcher B, Local over expression of TIMP-1 prevents aortic aneurysm degeneration and rupture in a rat model. Clin Invest (1998) 102: 1413/ Brophy CM, Tilson JE, Broserman IM, Tilson MD, Age of onset, pattern of distribution, and histology of aneurysm development in a genetically predisposed mouse model. J Vasc Surg (1988) 8: 45/ Swartbol P, Truedsson L, Norgren L, Adverse reactions during endovascular treatment of aortic aneurysms may be triggered by interleukin 6 release from the thrombotic content. J Vasc Surg (1998) 28: 664/ Parodi JC, Ferreira LM, Fornari MC, Berardi VE, Neutrophil respiratory burst activity and pro- and anti-inflammatory cytokines in AAA surgery: conventional versus endoluminal treatment. J Endovasc Ther (2001) 8: 114/ Svoboda P, Kantorova I, Ochmann J, Dynamics of interleukin 1, 2, and 6 and tumor necrosis factor alpha in multiple trauma patients. J Trauma (1996) 36: 336/ Pearce WH, Sweis I, Yao JST, Interleukin-1b and tumor necrosis factor-a release in normal and diseased human infrarenal aortas. J Vasc Surg (1992) 16: 784/ Franklin IJ, Walton LJ, Greenhalgh RM, Powell JT, The influence of indomethacin on the metabolism and cytokine secretion of human aneurysmal aorta. Eur J Vasc Endovasc Surg (1999) 18:35/ Franklin IJ, Harley SL, Greenhalgh RM, Powell JT, Uptake of tetracycline by aortic aneurysm wall and its effect on inflammation and proteolysis. Br J Surg (1999) 86: 771/5. 59
62 60
63 Journal of Applied Biomedicine 1: , 2003 ISSN Microscopic image analysis of elastin network in samples of normal, atherosclerotic and aneurysmatic abdominal aorta and its biomechanical implications Zbyněk Tonar 1,2, Stanislav Němeček 2, Radek Holota 2, Jitka Kočová 1, Vladislav Třeška 3, Jiří Moláček 3, Tomáš Kohoutek 1, Šárka Hadravská 4 1 Department of Histology and Embryology, Charles University in Prague, Faculty of Medicine in Pilsen, Czech Republic 2 New Technologies Research Centre in Westbohemian Region, University of West Bohemia, Pilsen, Czech Republic 3 Department of Surgery, University Hospital in Pilsen, Czech Republic 4 Department of Pathology, Charles University in Prague, Faculty of Medicine in Pilsen, Czech Republic Summary The aim of our work was to prepare part of the input data for a computational biomechanical model of both the active and passive elements of the tunica media of an aortic aneurysm. We analyzed tissue samples of the anterior wall of the normal, atherosclerotic and aneurysmatic subrenal abdominal aorta. We assessed the proportions of smooth muscle cells, elastin and collagen in histological sections of these samples and studied the morphological characteristics of the elastin network in the tunica media. Selected photomicrographs were studied, representing relatively well preserved areas without artifacts, ruptures, corrupted integrity of the tunica media or total elastinolysis. A new method was introduced for the assessment of structures formed by elastin membranes and fibres, using the fast Fourier transform (FFT) technique. The image was transformed into reciprocal (Fourier) space and the method made use of the fact that the FFT was very sensitive to the orientation distribution of thresholded elastin morphology. The results of this comparative study, obtained from selected samples from 24 patients, revealed that the percentage values of the constituents of the arterial wall can not distinguish between the preserved segments of normal, atherosclerotic or aneurysmatic aorta. The results of the Fourier analysis proved that the FFT provided an efficient method for evaluating cross sections of the elastin membranes and fibres, reflecting their anisotropy. The shape of the power spectrum of elastin was a simple pattern, whose description was quantified by the shape of its polar coordinates histogram. We discuss the methodological difficulties and biomechanical implications of our work as well compare it to other methods of elastin analysis. Keywords: abdominal aortic aneurysm elastin image processing biomechanics INTRODUCTION An aneurysm of the abdominal aorta (AAA) is a serious pathological condition, affecting most often, elderly men. It is defined by the diameter of the subrenal aorta exceeding the normal value by at least 1.5 in the antero-posterior or latero-lateral direction. The etiology of the most common types of abdominal aortic aneurysm has not been fully elucidated. The pathogenesis of the AAA involves many interconnected and complex processes such as for example, atherosclerosis, inflammation and immune reactions, causing remodelling and degradation of the vessel wall (Wills et al. 1996, Rehm et al. 1998). Prominent morphological features of this vascular disease include changes in 61
64 Tonar et al. the arrangement and the proportions of the aortic wall components, such as progressive destruction of the elastin network. The shift in the balance between degradation and resynthesis of the extracellular matrix (Curci et al. 1998) leads to a loss of elastin and to qualitative changes in the collagen fibres. This leads, with or without symptoms, to mechanical inferiority of the aneurysm, and such a weakening results in a further dilatation or even rupture of the aneurysm. Our aim was to prepare the input data for a computational biomechanical model of both the active and passive elements of the tunica media of the aortic aneurysm. These data were to be based on morphological analysis of the histological samples. This would enable us to carry out in future a numerical experiment modelling the response of the media to intravascular pressure with varying diameters and geometric types of aneurysm. Microscopical analysis of the aneurysm is not part of its routine clinical diagnostics; it is used rather for retrospective research and is lacking at present a widely accepted methodology. To meet our demand for quantitative data describing the wall of the AAA, we needed to assess the proportions of the smooth muscle cells, elastin and collagen fibres, in the histological sections. In our paper, we shall introduce a procedure for the evaluation of the micrographs of oriented structures by Fourier analysis (Bracewell 1965). We test whether the 2D Fourier transform could be a useful tool for the evaluation of degradation of the elastin network in selected images of the tunica media of the AAA, when compared to the samples of normal and atherosclerotic non-aneurysmatic abdominal aorta. Fourier analysis Conventional image processing techniques operate within real space (Russ 1990). We introduce another, mathematical space representing spatial frequencies of the periodic components of the patterns observed in the real structure. Spatial frequency means the number of intersections of the elastin network with an overlaid straight line per unit length. The spatial frequency dimension is (meter) -1, i.e. a reciprocal meter, and this is why the frequency domain is said to be reciprocal with respect to real space. The image, as observed in real space, is coded as grey level F(x,y) at pixel position (x,y). The function is expanded into its harmonical components by the Fourier transform. The image is first transformed from the spatial domain to the frequency domain (Fourier space) where a visual representation of the frequency content of the image can be examined. Therefore, the image data displayed in the frequency domain can reveal features not immediately apparent in the spatial domain, where our visual system is often distracted by bright objects and other strong features. MATERIAL AND METHODS The study population encompassed 24 patients. We analyzed tissue samples of the anterior wall of the normal (n=5), atherosclerotic (n=7) and aneurysmatic (n=12) subrenal abdominal aorta. We assessed the proportions of the smooth muscle cells (SMC), elastin and collagen fibres in the area of histological sections (5 7 µm) through the wall of the normal aorta and the AAA. We used hematoxylin and eosin; Verhoeff s hematoxylin with green trichrome (Kočová 1970), and aniline blue with Orange G staining. The colour photomicrographs ( pixels, 24bit colour depth) were analyzed via the image processing software IMAL developed by Weissar et al. (2001) at the University of West Bohemia in Pilsen, Czech Republic. We identified the components of the tunica media due to their relevance to intervals of RGB values or due to RGB gradient (with variable tolerance). The photomicrographs were selected in order to represent relatively well preserved areas without artifacts, ruptures and without corrupted integrity of the tunica media. We excluded segments of the AAA, where the elastin was totally destroyed. Constant magnification was chosen so that the photographed area could be large enough and free of artifacts in all the samples, and so that the image would not be inclined to reflect local tissue heterogenity. Selected micrographs of normal, atherosclerotic and aneurysmatic aorta were analyzed by means of 2D FFT (fast Fourier transform). Before the Fourier transform, we performed a thresholding of the elastin in the photomicrograph, using the SW Lucia 4.51 (Laboratory Imaging Ltd., Prague, Czech Republic). During this process, the use of a selection of narrow ranges of intensity values of the HSI colour model was found more suitable than operating with values of the RGB model. This selection, hopefully comprising the elastin quantitatively, was then segmented (extracted) in order to produce discrete objects. The results of this image segmentation were the monochrome micrographs of the elastin, i.e. encompassing the structure of interest to us. We developed two programs in the software system MATLAB (The MathWorks, Natrick MA, USA). The first one read an input image with a structure of material under inspection and performed a 2D Fourier Transform (Petrou and Bosdogianni 1999)

 from the center of the image.")
65 Microscopic image analysis of elastin network on this data. Then the FFT magnitude was calculated for each point of the image and thresholded into levels 0 or 1. Finally, a new image, composed from the thresholded FFT magnitudes, was saved on hard disk. The second program used the image of the Fourier spectra as an input image and applied the methods for recognition of the degree of elastinolysis. These methods used calculated histograms in polar coordinates, i.e. they summarized the number of white pixels in each direction (0 to 360 ) from the center of the image. Then an enclosed rectangle was constructed and the shape factor was calculated as a ratio of its sides (Holota and Němeček 2002). A minimum of the shape factor was 1, values near 1 meant small or no deformation. RESULTS In the normal aorta, the tunica media formed a µm thick layer composed of concentrically arranged anastomosing spiral elastic laminae, which appeared as branched wavy membranes surrounding the 6 18 µm wide spaces containing the fine connective tissue with fibroblasts, collagen (mostly of type III), and smooth muscle cells. The elastin system appeared as a network-like complex of bundles with many sections through the branched elastin bridges interconnecting the neighbouring elastic membranes (Fig. 1). The Fourier transform of these micrographs showed regularity and rotary symmetry (Fig. 2). The parallel system of intact elastin membranes with periodicity in the y axis contributed to the high frequencies. The average shape factor was 97. Fig. 1. Image of elastin obtained by thresholding and segmentation of the micrograph of normal aorta, tunica media, bar = 200 µm Fig. 2. Frequency spectrum of Fig


66 Tonar et al. The atherosclerotic abdominal aorta contained quite untouched segments comparable to the normal arterial wall, as well as severely altered parts with elastin loss, where the remainder of the media was repressed beneath the atherosclerotic plaque. In the atherosclerotic aortae, we observed a smoothing and straightening of the elastin membranes (Fig. 3). In the spectrum, it appeared as a persistence of the high frequencies in the y axis representing the periodicity of these mainly parallel structures. The frequencies in other directions were reduced (Fig. 4) and the average shape factor was 72. Fig. 3. Image of elastin obtained by thresholding and segmentation of the micrograph of atherosclerotic aorta, well preserved segment of tunica media, bar = 200 µm Fig. 4. Frequency spectrum of Fig

67 Capillary electrophoresis determination of huperzine A In the samples of AAA, there was very much in evidence the disintegration and chaotic rearrangement of the tissue and disappearance of the boundaries between the layers, migration of SMC and inflammatory cells and thickening of the intima by as much as 10 its normal thickness. The SMC density was decreased and the medial thickness was often reduced. In the tunica media damaged by inflammatory changes, the number of elastin boundaries intersecting the vertical (y) axis was much greater than the number of elastin boundaries intersecting the horizontal (x) axis (Fig. 5): the spatial frequencies in the vertical direction were greater than those in the horizontal direction. The corresponding spectrum was stretched in the vertical direction and squeezed in the horizontal direction (Fig. 6). The fragmentation and absolute diminution of the elastin network led to a fall in the high frequencies in the direction of the arterial circumference (y axis). The average shape factor was 85. The percentage terms of SMC, elastin and collagen are summarized in Table 1. We calculated the histograms in polar coordinates representing the normal, atherosclerotic and AAA samples (Fig. 7, 8 and 9). Fig. 5. Image of elastin obtained by thresholding and segmentation of the micrograph of AAA, well preserved segment of tunica media, bar = 200 µm Fig. 6. Frequency spectrum of Fig. 5 65
68 Tonar et al. Fig. 7. Histogram in polar coordinates describing the frequency spectrum of Fig. 2; shape factor = 0.97 Fig. 8. Histogram in polar coordinates describing the frequency spectrum of Fig. 4; shape factor =
69 Microscopic image analysis of elastin network Fig. 9. Histogram in polar coordinates describing the frequency spectrum of Fig. 6; shape factor = 0.81 Table 1. Percentage terms [%] in the section area through the tunica media normal aorta AAA range of values median range of values median smooth muscle cells Elastin collagen I and III DISCUSSION Methodical difficulties As it can be seen in the results, the percentage values of the constituents of the arterial wall can not distinguish between the normal, atherosclerotic or aneurysmatic samples of aorta. These data are not specific enough for the groups under study. Moreover, they can achieve considerably different values in the pathologic samples when analyzing
70 Tonar et al. several micrographs of the neighbouring segments of the same artery. We found these confusing results to be dependent neither on the varying dying properties of the tissue (compensated by the sensitivity and specificity of image segmentation), nor on the magnification used. Even the samples of ruptured AAA can contain some small-sized segments with a minimum of pathological alteration, so that the image processing results are extremely biased by the way in which the photomicrographs are selected. The proper morphological boundaries disappear in the AAA tissue. The loss of rotary symmetry of the wall leads to an extreme variability among the various photomicrographs of the neighbouring segments around the same aneurysm wall. At the same time, we are not able to evaluate these differences by means of statistical methods, because the selected micrographs do not cover the most extensive typical part of the AAA. On the contrary, they have to be rather selective, as explained above in Material and methods. We are aware of the fact that we evaluate some of the segments of the AAA which are not typical for this condition. We try to describe rather the very early changes of the elastin network in relatively well preserved parts of the AAA, while the history of the tissue samples is known to us by definition. A great number of the typical (considering the frequency) micrographs on the AAA are not suitable for image processing at all, because of the progressive damage or frequency of the microscopical artifacts. The Verhoeff s hematoxyline used for quantitative staining of the elastin, stained also the cell nuclei, giving the same colour from dark violet to black to both of these types of structures. The formal morphological description of the nuclei is often indistinguishable from that of the cross sections through the elastin fibres. As a result, the elastin thresholding process, although very sensitive, was not specific enough and encompassed also the cross sections through the cell nuclei (belonging mainly to the smooth muscle cells and fibroblasts). However, the samples under study were lacking any obvious discrepancy in nuclei size, number of nuclei per image, and/or nuclear arrangement, because they contained no inflammatory infiltration, signs of angiogenesis, or any deposits of the abnormal extracellular matrix or its proteolysis. This problem represents a possible bias source, but we are convinced it did not distort the results of the FFT. The problem of varying staining properties of the elastin required an adaptive thresholding, i.e. the modulation of the contrast mechanism defining the structure of interest to us. In order to comply with its function as a whole, the elastin network has to maintain its degree of cross linking, i.e. the quality and quantity of the interconnections among the neighbouring fenestrated membranes of the tunica media. The disappearance of the elastin observed with light microscopy belongs rather to the late signs of its advanced deterioration, when most of its function capabilities are already lost. Our technique sets out to evaluate the degree of fragmentation and straightening of the components of the elastin network, as visible on the 2D sections through the arterial wall, which should be a better correlate of the progression of aneurysmatic changes than the percentage of elastin in the arterial wall. Of course, it can be disputable as to what extent the evaluation of the individual 2D tissue slides can predicate the elastin network as a 3D structure. Furthermore, because of the scale factor, we always analyzed only a small part of the whole arterial circumference. Other methods of elastin analysis From a pathologist s point of view, there are several phenomena to be combined in order to evaluate the alteration of the AAA wall. These can be for example the type and morphometry of the atherosclerotic plaques (Zarins et al. 2001) and their calcification (Matsushita et al. 2000), erosion and ulceration, presence and size of mural thrombi (Patel et al. 1994, Hallingbye and Kane 2002), angiogenesis (Satta et al. 1998, Thompson et al. 1996, Holmes et al. 1995, Kobayashi et al. 2002), haemorrhages and dissection (Farber et al. 2002), inflammatory infiltrates (Jones et al. 2001, Bonamigo et al. 2002) and both local and plasma activity of the cytokines (Třeška et al. 1998, Rohde et al. 1999). The affection of the matrix turnover through the modulation of the matrix metalloproteinase expression is one of the cardinal factors in the evolution and progression of AAA (Davis et al. 2001), together with the failure of the antiproteolytic system (tissue inhibitor of matrix metalloproteinase), as demonstrated by Allaire et al. (2002), Silence et al. (2002) and Nollendorfs et al. (2001). The quantitative immunohistochemical assessment of macrophages and T lymphocytes infiltration is meaningful as well, because these cells produce cell death-promoting proteins (Henderson et al. 1999) contributing to the elimination of smooth muscle cells which are the source of elastin and collagen. With increasing age, the abundance of elastin associated microfibrils decreases, even in the normal aorta (Godfrey et al. 1993). However, we suppose the degradation rate of elastin to be the most suitable and meaningful of the potential objects of image processing, along with the analysis of immunohistochemically marked inflammatory cells. Where there are various microanalytical techniques available, it is often desirable to combine them in a complementary way to maximize the
71 Microscopic image analysis of elastin network information available from the specimen. Avolio et al. (1998) characterized the structure of elastin in terms of textural features, quantifying their alterations by fractal parameters and other stereological methods. The use of the confocal laser scanning microscopy represents another effective method for description of the three-dimensional arrangement of arterial elastin (Carvalho and Taboga 1996). Carmo et al. (2002) confirmed a decreased elastin content in the AAA and a concurrent increase of collagen (as proved by HPLC and amino acid analysis). The latter study proved the content of desmosines and isodesmosines to be a useful marker of elastin cross-links assessment. The role of elastin in AAA development We propose the following hypothesis of the mechanical pathogenesis of the AAA, consistent with our observation: The inflammatory changes damage inter alia the elastin in the thickest arterial layer, i.e. tunica media. The wall is no longer elastic enough to be able to accumulate the energy of the pressure amplitude during the systole and to return this energy back to the blood. At the same time, mechanical demands on the arterial wall do not reduce. On the contrary, the pressure load of the fibrillar extracellular matrix rises, together with the phenotypic conversion of the smooth muscle cells to their metabolic type with a reduced contractile capability. The decreased density of smooth muscle cells causes a weakening of the paracrine mechanisms protecting the artery wall homeostasis (Allaire et al. 2002). Due to the reduced compliance of the artery (together with the hypertension), the increased integrated continual pressure causes the long term remodellation of the wall, resulting in a further expansion of the aneurysm. The FFT analysis of the elastin benefits and prospects Mechanical deformation of the arterial wall, as well as biochemical processes, may result in disintegration of the fine interconnecting elastin fibres in one direction and in straightening of the persistent elastic membranes in the other direction. That is why the spatial frequencies diverge in different directions: they are lower in the direction in which the fibres have been relatively elongated and higher in the direction in which they have been compressed. As a consequence of this, the Fourier transform of the micrograph becomes anisotropic and elliptical. On the contrary, in the case of the equiaxial elastin network, the spatial frequencies are the same in all directions and the Fourier transform of the micrograph of such a structure is isotropic, i.e. circular. The anisotropy of the Fourier transform F(u,v) of the micrograph under analysis reflects the anisotropy of the structure as perceived directly on the micrograph of the structure f(x,y). But the Fourier spectrum F(u,v) (or the power spectrum F(u,v) 2 ) is much simpler than the image f(x,y), and therefore the evaluation of the Fourier transform of images is easier and gives more detailed and exact information on deformed structures than the evaluation of the image of the micrograph (Saleh and Teich 1991). In order to test the applicability and universality of the FFT for the description of elastin morphology in further studies, we suggest a comparison of the FFT findings in normal aorta of the adult and infantile patients, where the effect of different geometry and elastin content should be demonstrated. It could be also tested, whether the method presented in this study is able to describe the difference between the elastin in the thoracic and abdominal aorta. It is well known that in the thoracic part of the aorta, the percentage terms of elastin in the media and complexity of its network exceeds these parameters in the abdominal part. By comparing the longitudinal and transversal section through neighbouring segments of the same aorta, the FFT could also be able to describe the anisotropy of the elastin network in the third dimension. The method presented could also prove whether the thickness of the elastin lamellar units can differ in the inner and outer zones of the tunica media, building a morphologic gradient across the media. Concerning the AAA modelling, it would be useful to prove whether the dilatation of the aneurysm correlates with the length and pattern characteristic of the section through the elastin network and whether there are any dependencies between the length of the fibres and their shape. In our further work, the dependence of the result on the magnification used should be tested, as well as the variability of the results among different parts of the same tissue sample and of the same photomicrograph, the reproducibility and the intraand interobserver variation. Biomechanical implications The current methods of AAA detection and followup belong to medical imaging techniques. Factors determining whether surgery is necessary are the size and expansion rate of the AAA as well as the age and health of the patient. Therefore we can see the possible benefit of our method in the field of AAA modelling rather than in clinical practice, although we do not suppose the changes of mechanical properties of the AAA to be a simple function of the changing morphology of the elastin structure. The computational modelling of the AAA wall distensibility could be useful, because this
72 Tonar et al. parameter can provide (together with diastolic blood pressure and diameter) a quite successful assessment of the AAA rupture risk, as has been proved recently (Wilson et al. 2003). The consequences of our observation on the background of the biomechanical modelling of the aortic wall are as follows: It has to be considered that the metabolically altered fibres and cells are not mechanically analogous to their physiological equivalents. The soft tissue model should be based on the mixture theory approach and the microstructure of the tunica media should be characterized by volume fractions and preferential orientation of the basic components involved: the active fibres representing the bundles of muscle cells, two types of passive fibres corresponding to the collagen/elastin fibres, and the matrix. In the aneurysmatic and atherosclerotic wall the mechanical importance of smooth muscle cells is suppressed, as they are minor in comparison with other components (collagen, elastin) and mostly transformed to the metabolic phenotype, so that their activation can be regarded as constant. As can be seen, the model will be focused on the mechanics of the tunica media only. Because of insufficient data, there will not be implemented the biological phenomena such as innervation, endothelial dys/function, mediators, inflammatory remodelling, presence of thrombi and calcification in this mechanical model. We can conclude that a new technique was used to determine the degree of degradation of elastin by means of the 2D fast Fourier transform of its thresholded photomicrograph. This approach proved itself to be a useful tool when searching for a universal method of elastin network description, but its reliability has to be further tested. Because of the many possible methodical pitfalls and variability of the samples of AAA, we found this method to be unsuitable for routine automatized image processing. It requires a thoughtful selection of the input photomicrographs of the arterial wall and a careful reading of the output data. Under such conditions it promises to enable us to differentiate both the successive stages of progressive elastinolysis and deformation of the arterial wall very sensitively. ACKNOWLEDGEMENTS This paper is based upon work sponsored by the Ministry of Education of the Czech Republic under research and development project LN00B084. Partially supported by the project CEZ J13/98: Received 9 th April Published online 12 th June REFERENCES Allaire E., B. Muscatelli-Groux, C. Mandet, A.M. Guinault, P. Bruneval, P. Desgranges: Paracrine effect of vascular smooth muscle cells in the prevention of aortic aneurysm formation. J. Vasc. Surg. 36: , Avolio A., D. Jones, M. Tafazzoli-Shadpour: Quantification of alterations in structure and function of elastin in the arterial media. Hypertension 32: , Bonamigo T.P., C. Bianco, M. Becker, F. Puricelli: Inflammatory aneurysms of infra-renal abdominal aorta. A case-control study. Minerva Cardioangiol. 50: , Bracewell R.N.: The Fourier Transformation and its Applications, McGraw-Hill Book Company, New York 1965, pp Carmo M., L. Colombo, A. Bruno, F.R. Corsi, L. Roncoroni, M.S. Cuttin, F. Radice, E. Mussini, P.G. Settembrini: Alteration of elastin, collagen and their cross-links in abdominal aortic aneurysms. Eur. J. Vasc. Endovasc. Surg. 23: , Carvalho de H.F. and S.R. Taboga: Fluorescence and confocal laser scanning microscopy imaging of elastic fibers in hematoxylin-eosin stained sections. Histochem. Cell. Biol. 106: , Curci J.A., S. Liao, M.D. Huffman, S.D. Shapiro: Expression and localization of macrophage elastase (matrix metalloproteinase-12) in abdominal aortic aneurysms. J. Clin. Invest. 102: , Davis V.A., R.N. Persidskaia, L.M. Baca-Regen, N. Fiotti, B.G. Halloran, B.T. Baxter: Cytokine pattern in aneurysmal and occlusive disease of the aorta. J. Surg. Res. 101: , Farber A., W.H. Wagner, D.V. Cossman, J.L. Cohen, D.B. Walsh, M.F. Fillinger, J.L. Cronenwett, S.R. Lauterbach, P.M. Levin: Isolated dissection of the abdominal aorta: clinical presentation and therapeutic options. J. Vasc. Surg. 36: , Godfrey M., P.A. Nejezchleb, G.B. Schaefer, D.J. Minion, Y. Wang, B.T. Baxter: Elastin and fibrillin mrna and protein levels in the ontogeny of normal human aorta. Connect. Tissue Res. 29: 61 69, Hallingbye T.M. and J.J. Kane: Examining a CT scan of an abdominal aortic aneurysm. Part 1: Measuring the thrombus to aneurysm ratio using MatLab. Biomed. Sci. Instrum. 38: , Henderson E.L., Y.J. Geng, G.K. Sukhova, A.D. Whittemore, J. Knox, P. Libby: Death of smooth muscle cells and expression of
73 Microscopic image analysis of elastin network mediators of apoptosis by T lymphocytes in human abdominal aortic aneurysms. Circulation 99: , Holmes D.R., S. Liao, W.C. Parks, R.W. Thompson: Medial neovascularisation in abdominal aortic aneurysms: a histopathologic marker of aneurysmal degeneration with pathophasiologic implications. J. Vasc. Surg. 21: , Holota R. and S. Němeček: Recognition of oriented structures by 2D Fourier transform. In Pinker J. (ed.): Applied Electronics 2002, University of West Bohemia, Pilsen 2002, pp Jones K.G., D.J. Brull, L.C. Brown, M. Sian: Interleukin-6 (IL-6) and the prognosis of abdominal aortic aneurysms. Circulation 103: , Kobayashi M., J. Matsubara, M. Matsushita, N. Nishikimi, T. Sakurai, Y. Nimura: Expression of angiogenesis and angiogenic factors in human aortic vascular disease. J. Surg. Res. 106: , Kočová J.: Overall staining of connective tissue and the muscular layer vessels. Folia Morphol. 18: , Matsushita M., N. Nishikimi, T. Sakurai, Y. Nimura: Relationship between aortic calcification and atherosclerotic disease in patients with abdominal aortic aneurysm. Int. Angiol. 19: , Nollendorfs A., T.C. Greiner, H. Nagase, B.T. Baxter: The expression and localization of membrane type-1 matrix metalloproteinase in human abdominal aortic aneurysms. J. Vasc. Surg. 34: , Patel H., M. Krishnamoorthy, R.A. Dorazio, J. Abu Dalu, R. Humphrey, J. Tyrell: Thrombosis of abdominal aortic aneurysms. Am. Surg. 60: , Petrou M. and P. Bosdogianni: Image Processing: The Fundamentals. Willey, New York 1999, pp Rehm J.P., J.J. Grange, B.T. Baxter: The formation of aneurysm. Seminars in Vascular Surgery 11: , Rohde L.E., L.H. Arroyo, N. Rifai, M.A. Creager, P. Libby, P.M. Ridker, R.T. Lee: Plasma concentrations of interleukin-6 and abdominal aortic diameter among subjects without aortic dilatation. Arterioscler. Thromb. Vasc. Biol. 19: , Russ J.C.: Computer-assisted microscopy. Plenum Press, New York 1990, pp Saleh B.E.A. and M.C. Teich: Fundamentals of Photonics. Willey, New York 1991, pp Satta J., Y. Soini, M. Mosorin, T. Juvonen: Angiogenesis is associated with mononuclear inflammatory cells in abdominal aortic aneurysms. Annales Chirurgiae et Gynecologiae 87: 40 42, Silence J., D. Collen, H.R. Lijnen: Reduced atherosclerotic plaque but enhanced aneurysm formation in mice with inactivation of the tissue inhibitor of metalloproteinase-1 (TIMP- 1) gene. Circ. Res. 90: , Thompson M.M., L. Jones, A. Nasim, R.D. Sayers: Angiogenesis in abdominal aortic aneurysms. Eur. J. Vasc. Endovasc. Surg. 11: , Třeška V., O. Topolčan, P.W. Wenham, L. Pecen: Metabolism of cytokines in abdominal aortic aneurysms. Rozhl. chir. 77: , Weissar P., J. Fiřt, Z. Tonar: IMAL the software for image analysis of the histology of normal and aneurysmatic aorta. In Pinker J. (ed.): International Conference Applied Electronics 2001, University of West Bohemia, Pilsen 2001, pp Wills A., M.M. Thompson, M. Crowether, R.D. Sayers: Pathogenesis of abdominal aortic aneurysms cellular and biochemical mechanisms. Eur. J. Vasc. Endovasc. Surg. 12: , Wilson K.A., A.J. Lee., P.R. Hoskins, F.G. Fowkes, C.V. Ruckley, A.W. Bradbury: The relationship between aortic wall distensibility and rupture of infrarenal abdominal aortic aneurysm. J. Vasc. Surg. 37: , Zarins C.K., C. Xu, S. Glagov: Atherosclerotic enlargement of the human abdominal aorta. Atherosclerosis 155: , * Address: Zbyněk Tonar, Department of Histology and Embryology, Charles University in Prague, Faculty of Medicine in Pilsen, Karlovarská 48, Pilsen, Czech Republic; zbynek.tonar@lfp.cuni.cz
74 72
75 PŘEHLED REVIEW Heart transplantation in apolipoprotein E-deficient mice as a model of atherosclerosis regression* Dagmar Bobková, Jitka Kočová*, Zbyněk Tonar*, Jiří Lácha**, Jana Havlíčková***, Rudolf Poledne Laboratory for Atherosclerosis Research, Institute for Clinical and Experimental Medicine, Centre for Experimental Cardiovascular Research, Prague, *Department of Histology and Embryology, Charles University School of Medicine, Pilsen, **Department of Nephrology, Transplant Unit, ***Laboratory of Pathophysiology of Cardiovascular System, Institute for Clinical and Experimental Medicine, Centre for Experimental Cardiovascular Research, Prague, Czech Republic Bobková D, Kočová J*, Tonar Z*, Lácha J**, Havlíčková J***, Poledne R (Laboratory for Atherosclerosis Research, Institute for Clinical and Experimental Medicine, Centre for Experimental Cardiovascular Research, Prague, *Department of Histology and Embryology, Charles University School of Medicine, Pilsen, **Department of Nephrology, Transplant Unit, ***Laboratory of Pathophysiology of Cardiovascular System, Institute for Clinical and Experimental Medicine, Centre for Experimental Cardiovascular Research, Prague, Czech Republic). Heart transplantation in apolipoprotein E-deficient mice as a model of atherosclerosis regression. Cor Vasa 2004;46(2): Atherosclerosis is a long-term process of structural changes involving the vessel wall, which are characterized by potential regression. We tested the possibility of using a model of heart transplantation to study atherosclerosis regression in mice with spontaneous development of atherosclerosis, that is, in homozygous apolipoprotein E-deficient mice (apo E KO). Compared with wild-type mice on chow diet (2.3 ± 0.15 mmol/l), apo E KO mice show markedly higher cholesterol levels (10.3 ± 1.40 mmol/l) and the cholesterol/triglyceride ratio in VLDL fraction. After feeding a cholesterol-rich diet, cholesterolemia increased dramatically by a factor of 2.3 in these mice, with pronounced changes in the cholesterol/triglyceride ratio (with wild-type mice showing only a 1.3-fold increase). Before transplantation, the apo E KO mice were fed a cholesterol-rich diet for 4 months in order to develop atherosclerotic lesions. The hearts of apo E KO mice and wild-type mice were transplanted into wild-type mice and evaluated at one month post-transplant. Compared to normal hearts, the heart transplants were smaller and atrophied. In all animals under study, the aortic sinus contained atherosclerotic plaques. In the transplant apo E KO and wild-type mice, the plaques were mostly athrombogenic, containing collagen fibers and smooth muscle cells. Compared to transplant animals, the atherosclerotic plaques of apo E KO mice without transplantation were found to be more vulnerable. It was concluded heart transplantation in experimental model of mice is not a suitable model for studying atherosclerosis regression. Key words: Apolipoprotein E-deficient mice Atherosclerosis Heart transplantation Regression Bobková D, Kočová J*, Tonar Z*, Lácha J**, Havlíčková J***, Poledne R (Laboratoř pro výzkum aterosklerózy, Institut klinické a experimentální medicíny, Centrum experimentálního výzkumu chorob srdce a cév, Praha, *Oddělení histologie a embryologie, Lékařská fakulta Univerzity Karlovy, Plzeň, **Nefrologická klinika, Transplantační oddělení, ***Laboratoř patofyziologie kardiovaskulárních systému, Institut klinické a experimentální medicíny, Centrum experimentálního výzkumu chorob srdce a cév, Praha, Česká republika). Transplantace srdce u myší bez genu pro apolipoprotein E jako model regrese aterosklerózy. Cor Vasa 2004;46(2): Ateroskleróza je dlouhodobý proces strukturálních změn postihujících cévní stěnu, které jsou charakterizovány případnou regresí. Ověřovali jsme možnost použití modelu transplantace srdce s cílem studovat regresi aterosklerózy u myší se spontánním rozvojem aterosklerózy, tedy u homozygotních myší bez genu pro apolipoprotein E (apo E KO). Ve srovnání s myšmi divokého typu krmených normální stravou (2,3 ± 0,15 mmol/l), vykazovaly myši apo E KO výrazně vyšší koncentrace cholesterolu (10,3 ± 1,40 mmol/l) a poměr cholesterolu/triglyceridů ve frakci VLDL. Po krmení stravou s vysokým obsahem cholesterolu se u těchto myší cholesterolemie radikálně zvýšila (2,3násobně) s výraznými změnami poměru cholesterol/ /triglyceridy, přičemž zvýšení u myší divokého typu bylo pouze 1,3násobné. Před transplantací dostávaly myši apo E KO cholesterol v potravě po dobu 4 měsíců, aby se dosáhlo rozvoje aterosklerotických lézí. Srdce myší apo E KO a myší divokého typu byla transplantována myším divokého typu a vyšetřena měsíc po transplantaci. Ve srovnání s normálními srdci byla transplantovaná srdce menší a atrofická. U všech vyšetřovaných zvířat obsahoval aortální sinus aterosklerotické pláty. U transplantovaných myší apo E KO i myší divokého typu byly pláty většinou atrombogenní, obsahovaly kolagenová vlákna a buňky hladkého svalu. Při srovnání s transplantovanými zvířaty byly aterogenní pláty myší apo E KO, u nichž nebyla transplantace provedena, méně stabilní. Dospěli jsme tak k závěru, že transplantace srdce v myším experimentálním modelu nepředstavuje vhodný model pro studium regrese aterosklerózy. Klíčová slova: Myši bez genu pro apolipoprotein E Ateroskleróza Transplantace srdce Regrese Address: Dagmar Bobková, MA, Laboratory for Atherosclerosis Research, IKEM, Centre for Experimental Cardiovascular Research, Vídeňská 1958/9, Prague 4, Czech Republic, dabq@medicon.cz *This work was supported by grant LN-00A069 awarded by the Ministry of Education of the Czech Republic. 68 Bobková D et al. Atherosclerosis regression and apolipoprotein E-deficient mice Cor Vasa 2004;46(2):
76 INTRODUCTION Clinical manifestation of atherosclerosis belongs to the most frequent causes of death in industrialized populations. A variety of factors, with genetic factors playing an important role, are involved in the onset and development of the atherosclerotic process. Homozygous apolipoprotein E-deficient (apo E KO) mice represent a suitable model for the study of genetically induced atherosclerosis. Loss of the receptor ligand, apolipoprotein E, (1,2) in apo E KO homozygotes is associated with significantly increased basal cholesterolemia (3,4) characterized by IDL and LDL particle accumulation in the circulation and, as a result of the inability of macrophages to rid the subendothelial space of the accumulated cholesterol through apolipoprotein E production, (5,6) by the development of atherosclerosis. Most experimental studies exploring the relationship between apolipoprotein E and development of the atherosclerotic process have focused on preventing the development of atherosclerosis, with only one study (7) addressing the potential for atherosclerosis regression. The present study was designed to establish the possibility of using a model of heart transplantation to study atherosclerosis regression. The aim of our study was to determine whether transplantation of the heart of an apo E KO mouse damaged by atherosclerosis to an apo E-producing wildtype mouse would result in regression of the atherosclerosis-related injury to the coronary arteries of the heart transplant. METHODS Animals and diets Homozygous ( / ) apolipoprotein E-deficient mice (apo E KO mice) (C57Bl/6 strain) (48) and wild-type (+/+) mice (55) with the same genetic background (twomonth-old females and males) were used. For transplantation, only male mice weighing g were used. The animals were divided into two groups: (apo E KO transplant mice) 10 apo E KO mice used as donors for transplantation to wild-type mice, (wild-type transplant mice) and 6 wild-type mice used as donors for transplantation to wild-type mice. The wild-type mice (10) were used as recipients for transplants from apo E KO mice and 4 apo E KO mice were used as controls of atherosclerotic changes without transplantation. Before transplantation, wild-type mice were fed standard laboratory diet (chow diet) for 3 months. Apo E KO mice were fed a 1% cholesterol diet (chow diet containing 5% fat and 1% cholesterol) (cholesterol rich diet) for 4 months. After transplantation, all animals were fed chow diet. One month after transplantation, the animals were sacrificed, and their hearts were used for analysis of atherosclerotic changes as identified by heart morphology. Thirty-four apo E KO mice and 33 wild-type mice on diets without transplantation were used for serum lipoprotein analysis. Lipoprotein analysis Serum was harvested by whole blood centrifugation for 10 min at 12,000 rpm. Cholesterol and triglyceride levels were measured using colorimetric enzymatic assay kits (Boehringer Mannheim Biochemicals, Germany). Pooled serum was used for lipoprotein isolation. Lipoprotein fractions were isolated by sequential ultracentrifugation (VLDL [d = g/ml] for 18 h, IDL [d = g/ml] for 18 h, LDL [d = g/ml] for 18 h, HDL [d = g/ml] for 20 h) (50.3 rotor, Beckmann, USA) at 39,000 rpm at 8 o C. Heart transplantation In principle, heterotopic cardiac transplantation was performed as described by Corry, (8) with minor modifications. Donor and recipients were anesthetized by the administration of fentanyl, midazolam, and droperidole. Donor hearts were perfused with chilled heparinized saline via the inferior vena cava and were harvested after ligation of the vena cava and pulmonary veins. Harvested hearts were preserved in chilled saline ( 4 o C) while the recipient mice were being prepared. The aorta and pulmonary artery of each donor heart were anastomosed to the abdominal aorta and inferior vena cava of the recipient animal using a microsurgical technique: the aorta end to side to the abdominal aorta, and the pulmonary artery end to side to the vena cava inferior, continuous 10/0 suture. Total duration of heart ischemia was up to 55 minutes, handling time of heart transplantation was less than 35 minutes (median, 27 minutes). The recipients were not given any immunosuppressive agents before as well as after transplantation. Cardiac allograft survival was assessed by daily transabdominal palpation. Histological processing The hearts were removed from their recipients. Whole hearts were fixed in 7% formaldehyde solution, embedded in paraffin and cut transversally into 5µmthin cross sections, starting from the base of the heart. Serial sections were stained with hematoxylin and eosin, Miller s elastin stain, Mallory trichrome and green trichrome. (9) Statistical analysis Unpaired Student s t-test was used to test for differences among all groups. Results are expressed as means ± SD. Differences are considered statistically significant if p < RESULTS Lipoprotein concentrations The cholesterol levels on chow diet, i.e., basal cholesterolemia, of apo E KO mice were higher (p > 0.001) compared to wild-type mice (Table I). Sex differences were found in wild-type mice whereas these differences disappeared in apo E KO mice (Table I). Although the concentrations of VLDL, IDL and LDL fractions of apo E KO mice were increased compared with wildtype mice due to increased basal cholesterolemia, the HDL levels were lower (Table II). In apo E KO mice, cholesterol accumulation in lipoproteins resulted in an increased cholesterol/triglyceride ratio to 6.5 in VLDL fraction. In wild-type mice, the value of the ratio, 0.4, in VLDL was consistent with human data (Table II). Cor Vasa 2004;46(2):68 72 Bobková D et al. Atherosclerosis regression and apolipoprotein E-deficient mice 69 74
77 After cholesterol rich diet, cholesterolemia rose in both groups (Table I). The 2.3-fold increase in cholesterolemia in apo E KO mice on cholesterol rich diet led to increased lipoprotein levels. The more pronounced changes, by 180%, in VLDL fraction were associated with a rise in the cholesterol/triglyceride ratio (Table II). In wild-type mice, cholesterolemia rose 1.3 times with differences in cholesterol levels between males and females (Table I). Compared to apo E KO mice, only small changes in the cholesterol/ /triglyceride ratio in VLDL fraction of wild-type mice were seen (Table II). Transplantation Previous studies have demonstrated the presence of fatty streaks in the aortic tissue of apo E KO mice after 4 months on cholesterol diet. We expected similar changes to be demonstrated in the coronary arteries. Compared to aortic tissue, the coronary arteries of apo E KO mice without transplantation were not affected by any overt pathological condition. They were normal-sized, the lumen was free of atherosclerotic lesions, and all layers of the vessel wall were well differentiated and without any infiltration. Alteration of the aortic sinus wall was demonstrated by the presence of atherosclerotic plaques (Figure 1.1). These lesions contained erythrocytes adhering to the endothelium, accumulation of macrophages and lipids, acellular cholesterol clefts in their necrotic cores, and intense fibrous reaction (Figure 1.2). We observed atherosclerotic lesions formed by multilayered lipidfilled foam cells and macrophages in both the endocardium and myocardium (Figure 1.3). Fifty percent of transplant apo E KO mice and 66% of transplant wild-type mice died within the first three days of transplantation. All surviving recipients appeared healthy and normal. The animals were sacrificed one month after transplantation. Compared to normal healthy hearts from animals without transplantation, the transplanted hearts were smaller and atrophied. In the transplant apo E KO mice, the coronary arteries were affected by early graft vascular disease. This process manifested itself by intimal thickening, stenosing myointimal proliferation, and intraluminal thrombosis (Figure 1.4). The aortic sinus wall was covered by atherosclerotic plaques with local damage and loss of elastic membranes of the media (Figure 1.5). Elastinolysis was confirmed by Miller s elastic staining. Elastin degradation was focal rather than ubiquitous, and some segments of the tunica media showed well-preserved elastic membranes and smooth muscle cells (Figure 1.6). The myocardium was of normal structure and cellularity; we found only one fibrotic area with peripheral inflammatory infiltration. Epicardial veins and lymph vessels were dilated by hemo- and lymphostasis, respectively. In wild-type transplant mice, the large coronary arteries were normal-sized, free of atherosclerotic lesions, and all the layers of the vascular wall were well differentiated and without any infiltration. Atherosclerotic plaques were present on the intima of the aortic sinus and of the insertion aortic valve cusps. The lesions did not invade the vessel wall too deep, leaving most of the tunica media uninvolved (Figure 1.7). Severe inflammatory alteration was found in Table I Serum cholesterol levels in apo E KO ( / ) and wild-type mice (+/+) on different diets Chow diet Cholesterol-rich diet Sex n mmol/l ± SD n mmol/l ± SD / F ± *** ± M ± *** ± /+ F ± **,! ± 0.194!!! M ± *** ± F female, M male; results shown are means ± SD of serum levels, n number of animals, ***p < 0.001, ** p < 0.01 as significant differences between chow and cholesterol-rich diets using the t-test,!!!p < 0.001,!p < 0.05 as significant differences between females and males using the t-test Table II Lipoprotein levels in apo E KO ( / ) and wild-type (+/+) mice on diets Chow diet Cholesterol-rich diet TC TG TC/TG TC TG TC/TG F + M F + M mmol/l / VLDL (<1.006 g/cm 3 ) IDL ( g/cm 3 ) LDL ( g/cm 3 ) HDL ( g/cm 3 ) /+ VLDL (<1.006 g/cm 3 ) IDL ( g/cm 3 ) LDL ( g/cm 3 ) HDL ( g/cm 3 ) TC/TG the ratio of cholesterol/triglyceride concentrations, TC cholesterol, TG triglyceride, F + M pooled sera of females and males were used for lipoprotein isolation using ultracentrifugation 70 Bobková D et al. Atherosclerosis regression and apolipoprotein E-deficient mice Cor Vasa 2004;46(2):

 and lymphocytes (8), and staining with Miller s elastin reveals")
 and 50 micrometers (2,3,4,6). 3 7 4 8 the myocardium.")
.")


 When on cholesterol rich diet, cholesterolemia rose in either group, though lipoprotein composition changed significantly")
78 Figure 1 Mouse cardiac allografts of apo E KO and wild-type mice 1 month after transplantation. 1 3 represent apo E KO mice without transplantation, 4 6 represent transplant apo E KO mice, 7 8 represent transplant wild-type mice. Staining with hematoxylin-eosin (1,2) reveals atherosclerotic lesions in the aortic sinus, staining with modified trichrome reveals endoand myocardial infiltration of foam cells (3) and lymphocytes (8), and staining with Miller s elastin reveals thickening of the coronary artery intima (4) and atherosclerotic plaque in the aortic valve (5,6,7). Bar 250 micrometers (1,5,7,8) and 50 micrometers (2,3,4,6) the myocardium. We demonstrated diffuse interstitial lymphocyte infiltration, necrosis of cardiac myocytes, abundant and dilated blood vessels, granulation and fibrotic tissue, and hemorrhages together with intraluminal thrombosis of small blood vessels (Figure 1.8). DISCUSSION We have demonstrated that total cholesterolemia as well as VLDL, IDL and LDL fractions of apo E KO mice on chow diet was higher compared to the levels seen in wild-type mice. (10,11) Whilst the composition of VLDL of wild-type mice was similar to that seen in humans, and equivalent to the cholesterol/triglyceride ratio of 0.4, the cholesterol/triglyceride ratio of apo E KO mice was 6.5 as a result of cholesterol accumulation in VLDL particles. The HDL levels of apo E KO mice were lower compared to wildtype mice. It is therefore clear that loss of a functional allele of the apolipoprotein E gene in apo E KO mice leads to an inability to maintain lipoprotein levels at values consistent with those seen in wild-type mice. (12) When on cholesterol rich diet, cholesterolemia rose in either group, though lipoprotein composition changed significantly only in apo E KO mice. (11) The ensuing increase in VLDL levels in apo E KO mice on cholesterol diet was associated with increased VLDL conversion to IDL particles as precursors to LDL par- Cor Vasa 2004;46(2):68 72 Bobková D et al. Atherosclerosis regression and apolipoprotein E-deficient mice 71 76
79 ticles. Loss of apolipoprotein E synthesis in apo E KO mice led (due to slowed rates of clearance of IDL and LDL particles) to their increased levels in the circulation, and facilitated entry to the vessel wall. (3,11) The aortic sinus contained atherosclerotic plaques in all animals under study. In transplant apo E KO mice and transplant wild-type mice, the plaques were mostly athrombogenic, containing collagen fibers and smooth muscle cells while showing only scarce macrophage and lymphocyte infiltration. We found neither plaque ruptures, nor intraplaque hemorrhages. For this reason, we can evaluate these plaques as stable rather than vulnerable according to criteria as defined by Rekhter (13) for animal models of atherosclerosis. In addition to stable plaques, we noted vulnerable lesions in the aortic sinus of the apo E KO mice without transplantation. The localization of inflammatory cells in early-stage atherosclerotic lesions, as described in apo E KO mice without transplantation, supports the recent concept of atherosclerosis as an inflammatory disease. (14,15) This concept is attested to by the role of pro-inflammatory cytokines, since these accelerate the pathogenesis of atherosclerosis by acting as chemoattractants, inducers of adhesion molecule expression, potent stimulating factors, and proliferation promoters of many cell types, endothelial permeabilizers, triggers of extracellular matrix degradation and atherogenic lipoprotein retention, ligands of immune cells, factors involved in inflammatory and immune cascades, and so on. Inflammation plays a central role in all stages of atherosclerosis and links dyslipidemia to atheroma formation. (16) We believe this fact to be the main reason for the results of our experiment, because there was no anti-inflammatory drug intake or immunosuppressive therapy involved in our study. Without such treatment, and together with non-specific post-transplant vascular affections, there would be no regression of atherosclerotic changes once initiated. On the contrary, heart transplantation has been shown to be an indispensable cause of immune and inflammatory activation. CONCLUSIONS We can conclude that lipoprotein levels are higher in apo E KO mice compared with wild-type mice. After cholesterol rich diet, the lipoprotein spectrum in apo E KO mice changes significantly and the levels of atherogenic fractions IDL and LDL increase. Atherosclerotic plaques affected the aortic sinus of apo E KO mice without any relation of whether or not the hearts were transplanted to wild-type mice. Atherosclerotic plaques of apo E KO mice without transplantation were found to be more vulnerable. Early graft vascular disease and post-transplant involvement of the blood vessels and myocardium masked any potential regression of atherosclerosis in the heart transplants. REFERENCES 1. Reardon CA, Getz GS. Mouse models of atherosclerosis. Curr Opin Lipidol 2001;12: Beisiegel U, Weber W, Ihrke G, Herz J, Stanley KK. The LDL-receptor-related protein, LRP, is an apolipoprotein E-binding protein. Nature 1989; 341: Plump AS, Smith JD, Hayek T, et al. Severe hypercholesterolemia and atherosclerosis in apolipoprotein E- deficient mice created by homologous recombination in ES cells. Cell 1992;71: Breslow JL. Transgenic mouse model of lipoprotein metabolism and atherosclerosis. Proc Natl Acad Sci USA 1993;90: von Eckardstein A. Cholesterol efflux from macrophages and other cells. Curr Opin Lipidol 1996;7: Zhu Y, Bellosta S, Langer C, et al. Low-dose expression of a human apolipoprotein E transgene in macrophages restores cholesterol efflux capacity of apolipoprotein E-deficient mouse plasma. Proc Natl Acad Sci USA 1998;95: Reis ED, Li J, Fayad ZA, Rong JX, et al. Dramatic remodeling of advanced atherosclerotic plague of the apolipoprotein E-deficient mouse in a novel transplantation model. J Vas Surgery 2001;34: Corry RJ, Winn HJ, Russeell PS. Transplantation 1973; 16: Kočová J. Overall staining of connective tissue and the muscular layer vessels. Folia Morphol 1970;18: Breslow JL. Mouse models of atherosclerosis. Science 1996;272: Zhang SH, Reddick RL, Burkey B, Maeda N. Diet-induced atherosclerosis in mice heterozygous and homozygous for apolipoprotein E gene disruption. J Clin Invest 1994;19: van Dijk KW, Hofker MH, Havekes LM. Dissection of the complex role of apolipoprotein E in lipoprotein metabolism and atherosclerosis using mouse models. Curr Atherosclerosis Reports 1999;1: Rekhter MD. How to evaluate plaque vulnerability in animal models of atherosclerosis? Cardiovasc Res 2002; 54: Lusis AJ. Atherosclerosis. Nature 2000;407: Libby P. Vascular biology of atherosclerosis. Overview and state of the art. Am J Cardiol 2003;91 (Suppl): 3A 6A. 16. Libby P. Inflammation in atherosclerosis. Nature 2002; 420: Received 1 July 2003 Revision accepted 8 October Bobková D et al. Atherosclerosis regression and apolipoprotein E-deficient mice Cor Vasa 2004;46(2):
80 78
81 ACTA VET. BRNO 2005, 74: Effects of Long-term Cholesterol Diet on Cholesterol Concentration and Development of Atherosclerosis in Homozygous Apolipoprotein E-deficient Mice D. BOBKOVÁ 1, Z. TONAR 1,2 1 Laboratory for Atherosclerosis Research, Institute for Clinical and Experimental Medicine, Prague, Czech Republic 2 Department of Histology and Embryology, Faculty of Medicine in Pilsen, Charles University in Prague, Czech Republic Received May 6, 2005 Accepted November 10, 2005 Abstract Bobková D., Z. Tonar: Effects of Long-term Cholesterol Diet on Cholesterol Concentration and Development of Atherosclerosis in Homozygous Apolipoprotein E-deficient Mice. Acta Vet. Brno 2005, 74: Homozygous apolipoprotein E-deficient (apo E KO) mice represent a suitable model for the experimental study of atherosclerosis. The aim of our study was to evaluate the relationship between the duration of a cholesterol diet and the development of atherosclerosis. Apo E KO mice were divided into two groups. Group 1 (n = 8) received a cholesterol diet from the first day of life after birth (through the breast milk of the mothers on a cholesterol diet), Group 2 (n = 6) received a control diet (as well as their mothers) for the first 3 months, and a cholesterol diet from the third month of life. The animals were euthanased by decapitation at the age of five months. Blood was used for the measurement of cholesterol concentrations. From a series of 72 histological sections through the descendent thoracic aorta, 8 samples were selected in a uniform systematic random manner and used for a stereological quantification of atherosclerotic lesions. In comparison with the mice on a cholesterol diet for 2 months (Group 2), the total cholesterol concentration in the mice on a cholesterol diet for 5 months (Group 1) was lower (31.69 ± 4.10 mmol/l and ± 3.23 mmol/l, respectively, p< 0.05), and the volume of atherosclerotic lesions was higher (p < 0.04). Although atherosclerotic changes were found in both Groups 1 and 2, we found the atherosclerotic lesions to be significantly more developed in the experimental group fed a cholesterol diet for five months (Group 1) than in the group fed the same diet for two months only (Group 2). It can be concluded that the lower cholesterolemia found in apo E KO mice after five months of a cholesterol diet (Group 1) compared to the group fed the diet for two months only (Group 2), together with accelerated atherosclerosis is probably due to the combination of an increased excretion of cholesterol from the body via production of bile acids, and increased penetration of cholesterol to the vessel wall. Animal model, histology, cholesterol concentration, morphometric analysis, stereology Apolipoprotein E (apo E), the ligand of receptors, plays an important role in the lipoprotein metabolism (Reardon et al. 2001; Beisiegel et al. 1989). It has been found that the loss of synthesis of apolipoprotein E in homozygous apolipoprotein E-deficient (apo E KO) mice (Paigen et al. 1994; Smith 1998; van Dijk et al. 1999) is associated with inhibited utilization of residual particles, increased penetration of LDL particles into the vessel wall (Plump et al. 1992; Breslow 1993; Breslow 1996), and the development of atherosclerotic lesions due to the affected cholesterol reverse transport, in which apo E plays a pivotal role (von Eckardstein 1996). Basal cholesterolemia of apo E KO homozygotes is up to five times higher than that of animals of the same strain without the genetic defect, namely about 10 mmol/l. Apo E KO homozygotes are highly sensitive to dietary intervention due to the inability of apo E production. In these animals, administration of Address for correspondence: MUDr. Zbynûk Tonar Department of Histology and Embryology Faculty of Medicine in Pilsen, Charles University in Prague Karlovarská 48, Pilsen, Czech Republic Phone: Fax: zbynek.tonar@lfp.cuni.cz 79
82 502 a cholesterol-containing diet leads to an increase in cholesterolemia and the development of macroscopic atherosclerotic lesions (van Ree et al.1994). Stereology-based assessment of 2-D structures allows us to estimate several 3-D parameters, e.g. the volume of the object under study. Recently, the point-counting method proved suitable for histological quantification of atherosclerotic lesions (Nachtigal et al. 2002). This can be done on various microscopic scales in an effective and reproducible way, taking into account the precise calibration of photomicrographs. Practical methods for biological morphometry were reviewed e.g. by Howard and Reed (1998) and Gray (1996). Mouton (2002) gave a comprehensive description of both principles and practices of stereology in biomedical and material research. The aim of our work was to analyse changes in cholesterol concentrations and to quantify differences in the volume of atherosclerotic lesions in histological sections through the descendent thoracic aortas of apo E KO mice on a cholesterol diet for two and five months, respectively. Materials and Methods Animals and diets Homozygous (-/-) apolipoprotein E-deficient mice (apo E KO mice) (C57Bl/6 strain) (n=14) obtained from the Jackson Laboratory in Bar Harbor, Maine (USA) were used. During the experiment, the animals were fed standard laboratory chow (control diet) or a cholesterol diet (control diet containing 5% fat and 2% cholesterol). After birth, all animals were divided into two groups: Group 1 (n=8) received the cholesterol diet from the first day of life (through the breast milk of mothers on a cholesterol diet), Group 2 (n=6) received the control diet (as well as their mothers) for the first 3 months, and the cholesterol diet from the third month of life. At the age of five months, non-fasted animals were sacrificed by a cervical dislocation and their blood (with a small contamination of the lymph) was collected after euthanasia for the analysis of plasma cholesterol concentrations, and their descendent thoracic aortas were used for the analysis of vessel morphology. At the end of the experiment, mean weight of each group of animals was comparable (about 32 g). During the experiment, all animals were kept in cages placed at a conventional breeding place, under standard conditions (21 C, 45% air humidity, 12 hours daylight) with a water intake ad libitum. The study protocol was approved by the local research ethical committee. Lipoprotein analysis Plasma was collected by centrifugation of the whole blood (containing 5 µl of 10% EDTA per 1 ml of blood) for 10 min at rpm. Cholesterol concentrations were measured using colorimetric enzymatic assay kits (Boehringer Mannheim Biochemicals, Germany). Histology and quantitative analysis We analyzed samples of the descendent thoracic aorta. After a formalin fixation, segments of the aortas were processed by a common paraffin technique. Each sample was cut into 72 serial sections (thickness of 5 µm) with a transversally oriented cutting plane, and stained with hematoxylin and eosin (HE) and green trichrome modified according to Koãová (1970). For an immunohistochemical detection of smooth muscle cells, the endogenous peroxidase activity was blocked by a solution composed of hydrogen peroxide (1 volume) and methanol (50 volumes). For alpha-smooth muscle actin detection, sections were incubated with a monoclonal mouse anti-human antibody (clone 1A4, dilution 1:150; Dako, CA, USA) for 12 hours at 4 C. As stated in the manufacturer s declaration, the antibody cross-reacts with the alpha-smooth muscle actin-equivalent protein in the mouse as well. The secondary antibody (45 min, 37 C) and avidin-biotin peroxidase complex (45 min, 37 C) were applied, using the Novostain Super ABC Universal Kit (Novocastra Laboratories Ltd., GB). Following immunohistochemistry, the background tissue was stained with Gill s haematoxylin (30 s; Bio-Optica, Italy). For a quantitative analysis, we followed the well-documented methodology of Nachtigal et al. (2002, 2004) with respect to general principles of stereology (Howard and Reed 1998). A segment of 0.36 mm underwent a stereological analysis with the use of the PointGrid module (Plate I, Fig. 2, 3) of the Ellipse software (ViDiTo, Ko ice, Slovakia). Within the reference volume, eight equidistant sections were selected through systematic uniform random sampling. The position of the first tissue section in the volume was random, i.e. equal to a product of (72*n), where n was a random number between 0 and 1. Starting with this section, every ninth section was captured with two constant magnifications, so that the distance between the two neighbouring calibrated photomicrographs (sampling period) was 45 µm. We assessed the area of an atherosclerotic lesion in each tissue section according to Equation 1: esta = a P, (1) 80
83 where esta is the estimated area, grid parameter a is the area corresponding to one test point and P is the number of test points hitting the atherosclerotic lesion. The Cavalieri principle (Russ and Dehoff 2001) was used for the estimation of the volume V of the atherosclerotic lesion within the reference segment of the aorta, see Equation 2: estv = T*(A 1 + A Am), (2) where estv is the Cavalieri volume estimator, T = mm is the distance between the two following selected sections, and A i is the area of the atherosclerotic lesion in the i-th section. We evaluated eight sections as representatives of each tissue sample, i.e. (m=8). The area fraction of the free vessel lumen (AFFVL) was used as a parameter that characterizes the relative obliteration of the aortic lumen by the atherosclerotic lesion, see Equation 3: A(lesion) AFFVL = (1 - ) * 100%, (3) A(lumen) where A(lesion) is the area of the atherosclerotic lesion, and A(lumen) is the area of the total vessel lumen, including the lesion. In the case of a deeper invasion of the lesion towards tunica media, where the border between subendothelial connective tissue and tunica media was altered, the arbitrary bottom of the atherosclerotic lesion was considered to be at the level of the innermost elastic lamina. We compared our findings to the classification of atherosclerotic lesions recommended by the American Heart Association (Stary et al. 1994, 1995; Stary 2000). In the lesion type I, isolated macrophage foam cells invade the intima. Multiple foam cell layers are formed in the lesion type II. Isolated extracellular lipids pools are added in type III. In type IV, confluent extracellular lipid pools are formed. Further progression leads to the production of fibromuscular tissue layers (type V). Surface defects, haematoma, and thrombosis represent type VI lesions, which are very rare in the mouse aorta. Calcification or fibrous tissue changes predominate in lesion types VII, or VIII, respectively. 503 Fig. 1. Cholesterol concentrations in plasma in apo E KO mice after a cholesterol diet. *p < 0.05 vs. two months, n = number of animals Fig. 4. The average area fraction of the free vessel lumen in one histological section (AFFVL, mean ± SD) and estimated total volume of atherosclerotic lesion in the reference volume. The AFFVL is highly inversely correlated with the volume (r = -0.89). The sample No. 12 was deleted because of mechanical damage. 81
84 504 Statistics The unpaired Student s t-test was used to test for differences between the groups. Data are presented as means ± SD. The Welch test was used to compare the stereological parameters estimated in the animal group under study. In both cases, the differences are considered statistically significant if p < The correlation was assessed with the use of the Pearson correlation coefficient. Results The resulting cholesterol concentrations in apo E KO mice after two or five months on a cholesterol diet are summarized in Fig. 1. In both Groups 1 and 2, total cholesterolemia was higher than had been found in previous studies in the apo E KO mice on chow. Plump et al. (1992) and also Breslow (1993) described in their experiments the plasma cholesterol concentrations in apo E KO mice on chow (control diet) as being about 10 mmol/l. Total cholesterol concentrations in the mice on the cholesterol diet for a period of five months (Group 1) was lower in comparison with the mice after two months on a cholesterol diet (Group 2). The differences between the groups were about 5 mmol/l. The quantitative results are summarized in Fig. 4. Average area fraction of a free vessel lumen in one histological section was found to be lower in Group 2 (p = 0.030) and the estimated total volume of atherosclerotic lesions was higher (p = 0.037) in the reference volume of animals of Group 2, when compared to Group 1. The AFFVL values were highly inversely correlated with the volume of lesions (r = -0.89). The sample No. 12 was deleted because of mechanical damage. Table 1. Presence (+) or absence (-) of intact (i.e. atherosclerosis-free) segments, atherosclerotic plaques and branching in the reference volume of thoracic descendent aortas. The extent of atherosclerotic plaques is indicated semiquantitatively according to subjective evaluation. The sample No. 12 was deleted (o) because of mechanical damage. Sample No. Intact segment Atherosclerotic plaque Branching o o o Segments of normal and atherosclerotic aortas were observed in both experimental groups, as presented in Table 1. Lesions were situated in the regions of arterial branching (Plate II, Fig. 5, 6, and Plate III, Fig. 7). They expanded beyond the vessel wall and invaded the lumen as bulge-shaped lesions (Fig. 8). No eccentric (non-diffuse) intimal thickening was found. In both groups under study, we found lesions with isolated lipid droplet-laden macrophages (foam cells) and with monocytes adhering to the surface of the endothelium (Fig. 5). This type was comparable to human type I, and it prevailed in Group 1. In Group 2, lesions comparable to type II and III prevailed, the former containing macrophage foam cells accumulated and stratified in adjacent cell layers together. The lipid-laden smooth 82
85 muscle cells were sporadic. Type III-like intermediate lesions (preatheroma) were present in samples No. 5-7, and 9 only (Fig. 6, 7, and Plate IV, Fig. 8). In these samples, small extracellular lipid deposits and cell remains formed isolated pools below the foam cell layers. Underneath the lesion, the interlamellar distance between the neighbouring elastic membranes was found to have increased. The accumulations of macrophages and extracellular lipids were separated by smooth muscle cells (Fig. 9). Discussion In accordance with our expectations, we found increased cholesterolemia in mice on the cholesterol diet, compared to previous findings on animals on a control diet (Plump et al. 1992; Breslow 1993). It has been found that the loss of a functional allele of the apolipoprotein E gene in apo E KO mice is connected with the inability to maintain cholesterol concentration consistent with that observed in wild-type mice (van D ijk et al. 1999). Loading the lipoprotein metabolisms of these mice by feeding them the cholesterol diet obviously led to a subsequent increase in cholesterolemia and facilitated penetration to the vessel wall and macrophages via their scavenger receptors without a feedback regulation (Plump et al. 1992). Under regular conditions, the vessel wall eliminates a surplus of cholesterol caused by production of HDL lipoproteins rich in apolipoprotein E, via a cholesterol reverse transport from macrophages (von Eckardstein 1996). Because of the loss of synthesis of apolipoprotein E, this way of cholesterol elimination from the vessel is impaired and the accumulation of cholesterol leads to the development of atherosclerosis. However, we found unexpectedly lower cholesterol concentrations in the mice fed the cholesterol diet for five months, in comparison with the mice after two months on the cholesterol diet. The plasma total cholesterol concentration is known to result from many factors, such as the alimentary cholesterol intake, its synthesis in the body, or its secretion via bile acids (Carey and Hernell 1992). Especially in rodents, a high cholesterol intake from a diet leads to stimulation of cholesterol conversion to bile acids in the liver (Peet et al. 1998). This mechanism was found as a regulator of the total cholesterol concentration in blood. We suppose that the long-term cholesterol feeding led in apo E KO mice to an increase of bile acids production in the liver and their excretion into the intestine. This mechanism together with increased penetration of lipoprotein particles into the vessel wall seems to be the main reason of the decrease of the cholesterol concentration in plasma observed in the apo E KO mice after five months on the cholesterol diet. The AFFVL parameters and the estimated volume (estv) of atherosclerotic lesions are to be considered complementary. The AFFVL parameter is relatively robust with respect to the deviation of the section plane with regard to the transversal plane. In spite of a careful orientation of the paraffin-embedded tissue sample, such a deviation might occur. As AFFVL is a dimensionless ratio, it does not get biased by absolute differences in the size or shape of the aorta among the animals. It was used as a measure of obstruction of the lumen by the lesion. Taking into account the size of the reference volume, it becomes apparent that in most cases we assessed the size of one lesion rather than several lesions. According to our experience, stereological assessment proved accurate, correct and reproducible, having a low intra- and inter-observer variability. If the bias of the results caused by the irregular shape of the lesion were avoided, the total number of test points hitting the area of interest should be above 60. This number was estimated according to the nomogram of Gundersen and Jensen (1987), taking into account the irregular shape of the lesion and the coefficient of error of the estimate lower than In our method, this conventional limit was certainly exceeded, ranging from 1300 to 3000 (depending on both lumen and lesion shape and size). The quantitative results are in concordance with the subjective assessment of the samples. An exception appeared in samples No. 7 and 8, where no lesions were found. We assume
86 506 that this happened due to an accidental absence of branching in the aortic segment under study. This explanation is supported by a remarkable coincidence of lesions and branching sites (Table 1). The sites of a lesion disposition are determined in part by haemodynamic forces acting on the endothelial cells. In the regions of arterial branching or curvature, the flow is disturbed. The fluid shear stress increases endothelium permeability to macromolecules, so that these regions become preferential sites for lesion formation (Lusis 2000). We conclude that besides a qualitative description, we quantified the volume of atherosclerotic lesions in histological sections through the descendent thoracic aortas of apo E KO mice. This parameter was inversely correlated with the area fraction of the free vessel lumen. We proved that atherosclerotic lesions were significantly more developed in the experimental Group 1 (five months on the cholesterol diet) than in Group 2 (two months on the cholesterol diet). We assume that the lower cholesterolemia found in apo E KO mice of Group 1 compared to Group 2, together with accelerated atherosclerosis is probably due to the combination of increased cholesterol elimination from the body via bile acids production, and increased penetration of cholesterol to the vessel wall. Efekt dlouhodobého podávání cholesterolové diety na rozvoj aterosklerotick ch zmûn u apolipoprotein E-deficientních my í Jeden z nejpouïívanûj ích experimentálních modelû umoïàujících studium rozvoje aterosklerotického procesu pfiedstavují apolipoprotein E-deficientní (apo E KO) my i. Cílem této studie bylo analyzovat závislost rozsahu aterosklerotického po kození u apo KO my í na délce dietní intervence. Skupina apo E KO my í byla rozdûlena do dvou skupin. První skupina byla od prvního dne od narození (prostfiednictvím diety matek) Ïivena 2% cholesterolovou dietou (n = 8), druhá skupina dostávala stejnou cholesterolem obohacenou dietu aï od 3. mûsíce vûku (n = 6). Po skonãení dietní intervence (5. mûsíc vûku) byla zvífiata dekapitována. Vzorky krve byly pouïity pro anal zu koncentrace cholesterolu. Rozsah aterosklerotického po kození úsekû descendentních hrudních aort byl kvantifikován stereologick m vyhodnocením nestrannû systematicky náhodnû vybran ch vzorkû ze série 72 histologick ch fiezû. U zvífiat Ïiven ch po dobu 5 mûsícû cholesterolovou dietou byla nalezena niï í koncentrace (p < 0,05) cholesterolu (26,75 ± 3,23 mmol/l) v porovnání se zvífiaty Ïiven mi cholesterolovou dietou po dobu 2 mûsícû (31,69 ± 4,10 mmol/l). U první skupiny byl objem aterosklerotick ch lézí signifikantnû vy í (p < 0,04). Paralelnû v obou skupinách zvífiat byly nalezeny na úsecích hrudních aort rozsáhlé aterosklerotické léze, lokalizované zejména do oblastí odstupu vûtví hrudní aorty. U zvífiat Ïiven ch cholesterolovou dietou po dobu 5 mûsícû mûla tato loïiska vût í rozsah neïli u zvífiat Ïiven ch cholesterolovou dietou po dobu 2 mûsícû. Z v sledkû vypl vá, Ïe dlouhodobé podávání cholesterolové diety je u apo E KO my í spojeno s masivnûj ím rozvojem aterosklerotick ch zmûn v dûsledku akcelerovaného ukládání cholesterolu do cévní stûny a pravdûpodobnû se zv ením exkrece cholesterolu cestou Ïluãov ch kyselin. Acknowledgements This work was supported by the grant 1M awarded by the Ministry of Education, Youth and Sports of the Czech Republic. We express special thanks to Mrs. Jaroslava Beránková for her technical assistance. References BEISIEGEL U, WEBER W, IHRKE G, HERZ J, STANLEY KK 1989: The LDL-receptor-related protein, LRP, is an apolipoprotein E-binding protein. Nature 341:
87 BRESLOW JL 1993: Transgenic mouse model of lipoprotein metabolism and atherosclerosis. Proc Natl Acad Sci USA 90: BRESLOW JL 1996: Mouse models of atherosclerosis. Science 272: CAREY, MC, HERNELL, O 1992: Digestion and absorption of fat. Sem Gastrointest Dis 3: GRAY, T 1996: Quantitation in histopathology. In: BANCROFT, JD, STEVENS, A (Eds): Theory and practice of histological techniques. Churchill Livingstone, New York, pp GUNDERSEN, HJG, JENSEN, EB 1987: The efficiency of systematic sampling in stereology and its prediction. J Microsc 147: HOWARD, CV, REED, MG 1998: Unbiased Stereology: Three Dimensional Measurement in Microscopy. Royal Microscopical Society, Microscopy Handbook Series No. 41. Springer-Verlag, New York, 246 p. KOâOVÁ, J 1970: Overall staining of connective tissue and the muscular layer of vessels. Folia Morphol 3: MOUTON, PR 2002: Principles and Practices of Unbiased Stereology. An Introduction for Bioscientists. The Johns Hopkins University Press, Baltimore, 214 p. LUSIS, AJ 2000: Atherosclerosis. Nature 407: NACHTIGAL, P, SEMECK, V, GOJOVÁ, A, KOPECK, M, BENE, V, JÒZKOVÁ, R 2002: The application of stereological methods for the quantitative analysis of the atherosclerotic lesions in rabbits. Image Anal Stereol 21: NACHTIGAL, P, SEMECKY, V, KOPECKY, M, GOJOVA, A, SOLICHOVA, D, ZDANSKY, P, ZADAK, Z 2004: Application of stereological methods for the quantification of VCAM-1and ICAM-1 expression in early stages of rabbit atherosclerosis. Pathol Res Pract 200: PAIGEN, B, PLUMP, AS, RUBIN, EM 1994: The mouse as a model for human cardiovascular disease and hyperlipidemia. Curr Opin Lipidol 5: PEET, DJ, TURLEY, SD, MA, W, JANOWSKI, BA, LOBACCARO, JM, HAMMER, RE, MANGELSDORF, DJ 1998: Cholesterol and bile acid metabolism are impaired in mice lacking the nuclear oxysterol receptor LXR alpha. Cell 93: PLUMP, AS, SMITH, JD, HAYEK, T, AALTO-SETALA, K, WALSH, A, VERSTUYFT, JG, RUBIN, EM, BRESLOW, JL 1992: Severe hypercholesterolemia and atherosclerosis in apolipoprotein E-deficient mice created by homologous recombination in ES cells. Cell 71: REARDON CA, GETZ GS 2001: Mouse models of atherosclerosis. Curr Opin Lipidol 12: RUSS JC, DEHOFF RT 2001: Practical Stereology. 2nd Ed. Plenum Press, New York, 307 p. SMITH, JD 1998: Mouse models of atherosclerosis. Lab Anim Sci 48: STARY HC, CHANDLER AB, GLAGOV S, GUYTON JR, INSULL W JR, ROSENFELD ME, SCHAFFER SA, SCHWARTZ CJ, WAGNER WD, WISSLER RW 1994: A Definition of Initial, Fatty Streak, and Intermediate Lesions of Atherosclerosis: A Report From the Committee on Vascular Lesions of the Council on Arteriosclerosis, American Heart Association. Circulation 89: STARY HC, CHANDLER AB, DINSMORE RE, FUSTER V, GLAGOV S, INSULL W JR, ROSENFELD ME, SCHWARTZ CJ, WAGNER WD, WISSLER RW 1995: A Definition of Advanced Types of Atherosclerotic Lesions and a Histological Classification of Atherosclerosis. A Report From the Committee on Vascular Lesions of the Council on Arteriosclerosis, American Heart Association. Arterioscler Thromb Vasc Biol 15: STARY HC 2000: Natural History and Histological Classification of Atherosclerotic Lesions. An Update. Arterioscler Thromb Vasc Biol 20: VAN DIJK KW, HOFKER MH, HAVEKES LM 1999: Dissection of the complex role of apolipoprotein E in Lipoprotein Metabolism and Atherosclerosis Using Mouse Models. Curr Atherosclerosis Reports 1: VAN REE JH, van den BROEK WJ, DAHLMANS VE, GROOT PH, VIDGEON-HART M, FRANTS RR, WIERINGA B, HAVEKES LM, HOFKER MH 1994: Diet-induced hypercholesterolemia and atherosclerosis in heterozygous apolipoprotein E-deficient mice. Atherosclerosis 111: VON ECKARDSTEIN A 1996: Cholesterol efflux from macrophages and other cells. Curr Opin Lipidol 7:


88 Plate I Bobková D.. et al.: Effect of Long-Term... pp Fig. 2. The estimation of the total area of the aortic lumen was the first step of the AFFVL parameter assessment. The test points hitting the lumen were highlighted (violet). Green trichrome and Verhoeff hematoxylin staining. Fig. 3. As a second step of AFFVL assessment, we estimated the lesion area with the use of a highdensity grid of test points. Detail of Fig
.")

89 Plate II Fig. 5. Sample No. 1 (Group 1). A lesion comparable to human type II contains macrophages covered by a fibrous cap. The branching of the aorta becomes obliterated. Fig. 6. Sample No. 9 (Group 2). The branching site is occupied by a lesion comparable to human type III which includes extracellular lipids. Note the acicular shape of the empty spaces occupied initially by cholesterol crystals. The superficial elastic laminae are destroyed, and the deeper ones have a dilated interlamellar space filled with lipid-laden smooth muscle cells. 87


90 Plate III Fig. 7. Sample No. 11 (Group 2). The branching site is occupied by a type III-like lesion with both intra- and extracellular lipid pool. Fig. 8. Sample No. 10 (Group 2). A detailed view of a lesion type analogous to human type III, bulging into the aortic lumen. It contains foam cells as well as extracellular lipid mass and cell debris. Monocytes adhere to the endothelium. 88
: The distribution of alpha-smooth muscle actin within a lesion analogous to human type III.")
91 Plate IV Fig. 9. Sample No. 10 (Group 2): The distribution of alpha-smooth muscle actin within a lesion analogous to human type III. Smooth muscle cells (brown) encircle macrophages and a well delineated accumulation of extracellular lipid (lipid core). 89

92 Workshops W9 Animal models of atherosclerosis 45 involved in bile formation, however its extrahepatic expression has been implicated in novel mechanisms of cholesterol ettlux. CYP27A deficiency is found in cerebrotendinous xanthomatosis and leads to cholesterol and cholestanol accumulation in peripheral tissues resulting in neurological manifestations and possibly premature atherosclerosis. We overexpressed the human CYP27A in mice (CYP27 tg) and examined whether crossing these animals to apee K mice would reduce atherosclerosis. These studies showed a non-significant reduction in atherosclerosis in CYP27 tg on an apoe K background as compared to littermates without CYP27A overexpression. Methods: In order to focus on the contribution of macrophage CYP27A to atherosclerosis we performed bone marrow transplantations from CYP27 tg, C57BL/6J, and apoe KO donors into apoe KO recipients. Results: Apt E expression levels in bone marrow derived macrophages from CYP27 tg and C57BL/6J animals was sufficient to reduce hypercholesterolemia (190ms/all and 200mg/dl compared to 1740mg/dl). Mean lesion area from cross sections showed reduced atherosclerosis in CYP27 tg bone marrow recipients as compared to C57BL/6J recipients (651xm 2 and 533~m 2, respectively). No Sudanophilic aortic lesions were demonstrated in either CYP27 tg or C57BL/6J recipients. IL6 assays suggested a borderline shift towards an inflammatory pattern in CYP'27 tg recipients. Conclusions: Allhough apoe expression levels in macrophages from CYP27 tg and C67BL/6J donors were sufficient to reduce hypercholesterolemia and thus decrease atherosclerosis in apoe deficient mice, preliminary measurements suggest an atheroscleorsis protective role for CYP27A. On the other hand, excess oxysterols in macrophages may promote IL6 secretion and contribute to inflammation in addition to their putative role in cholesterol ettlux. W09-P-023] TELMISARTAN REDUCES ATHEROSCLEROTIC LESION FORMATION BY DECREASING SUPEROXIDE GENERATION IN APOLIPOPROTEIN E-DEFICIENT MICE T. Takaya, S. Kawashima, M. Shinohara, T. Yamashita, N. Inoue, K. Hirata, M. Yokoyama. Div. of Cardiovascular & Respiratory Medicine, Kobe Univ. Graduate School of Medicine, Kobe, Japan Objectives: We investigated whether clinically relevant doses of telmisartan (Tls), an Angiotensin II type 1 receptor blocker (ARB), could reduce atherosclerotic lesion formation independently of its effect on blood pressure, and, if so, examined the mechanism. Methods and Results: We chronically treated apolipoprotein E- deficient mice with Tls dissolved in drinking water. Two doses of Tls (0.3mg/kgBW/day and 3mg/kgBW/day) were started at the age of 4weeks and continued for 12weeks. Lipid contents were not changed by Tls. Systolic blood pressure decreased by 3mg/kgBW/day Tls ( mmhg), but not by 0.3mg/kgBW/day Tls ( mmhg) compared with controls without Tls (107A mmhg). Atherosclerotic lesion size at the aortic sinus was significantly reduced by 0.3mg/kgBW/day Tls compared with controls, and additional reduction in size was proved by 3mg/kgBW/day. As the mechanism, we revealed that both doses of Tls markedly reduced superoxide generation from in situ vessels assessed by dihydrcethidium staining and the lncigenin chemiluminescence method. The activity of NAD(P)H oxidase in vessels was reduced by Tls without changes in its expression. Finally we found that urinary 8-isoprostane, a marker of systemic oxidative stress, was reduced by Tls. Conclusion: Clinically-relevant doses of Tls suppressed atherogenesis without changing blood pressure at least partly by decreasing oxidative stress. WO9-P-024 ] CIRCULATING PROGENITORS CONTRIBUTE TO NEOINTIMAL FORMATION IN NON-IRRADIATED BONE MARROW CHIMERIC MICE K. Tanaka, M. Sata, Y. Himta, R. Nagai. Cardiovascular Medicine, University of Tokyo Graduate School of Medicine, Tokyo, Japan Background: Recent reports suggested that bone marrow derived progenitor cells may contribute to lesion formation after mechanical vascular injury. In most of the studies, bone marrow chimerism was generated by injecting maker-positive bone marrow cells into lethal irradiated animals. Since irradiation has tremendous effects on recipient animals, it remains unknown whether bone marrow-derived circulating cells really contribute to organ remodeling under physiological conditions. Method and Remits: We established parabiotic model, in which two mice were joined at subcutaneous space without any vessel anastomosis. We joined wild-type mice with transgenic mice that expressed enhanced green fluorescent protein (EGFP) in all tissues. 4 weeks after the operation, 35-45% of the peripheral mononuclear cells were EGFP-positive cells as determined by flow cytometty. The femoral arteries of the wild-type mice were mechanically injured by inseaion of a large wire. At 4 weeks, there was neointima hyperplasia that was composed of a-smooth muscle actin-positive cells. Significant amount of EGFP positive cells were detected in the neointima ( %) and media( %) of the lesions. (n=8) Some of the cells expressed a-smooth muscle actin or endothelial cell markers (CD31 or MECA-32). Conclusion: Circulating cells contribute to re-endothelialization and neointimal formation after mechanical vascular injury even in the absence of irradiation. W09-P-025J VESSEL TRANSPLANTATION OF APOLIPOPROTEIN E-DEFICIENT MICE AS A MODEL OF ATHEROSCLEROSIS REGRESSION Z. Tonar 1, D. Bobkova 1, J. Havlickova 2, R. Poledne 1. 1Lab. for Atherosclerosis Research, Inst. for Clin. and Exp. Medicine, Prague, Czech Republic; 2Lab. of Pathophysiol. of Cardiovasc. System, Inst. Clin. and Exp. Medicine, Prague, Czech Republic Objective: The possibility of using the model of heterotopic aorta transplantation as an atherosclerosis regression model was tested in hemozygous apolipoprotein E-deficient (apt E KO) mice. Methods: Apt E KO mice (n=14) and wild-type mice (C57B1/6 strain) (n=16) at age of 3 months on chow were used. The segments of thoracic aorta were transplanted from apt E KO mice to wild-type (WT) mice to the abdominal aorta (subgroup 1) and examined one month after transplantation. Transplantations from WT to WT mice (subgroup 2) and from apt E KO to apt E KO mice (subgroup 3) were used as controls. Stereological methods were applied in order to quantify the volume of the atheresclerotic lesions (estv) and the area fraction of free vessel lumen (AFFVL) in serial equidistant histological sections stained with green trichrome and Verhoeff's hematoxyline. Results: The basal cholesterolemia was t-1.64 retool/1 and 2.14-t-0.13 mmol/l in the apt E KO mice and WT mice, respectively. The analysis of variance proved no significant differences in parameters AFFVL and estv among the subgroups 1, 2, and 3. In the samples which underwent transplantation, the AFF~L was lower and the estv was higher than in the neighbouring non-transplanted samples of aorta (p<0.003), no matter what subgroup they had originated from. Diffuse intimal thickening with foam cells was observed in all the transplanted aortas, as well as leukocytic infiltration and elastinolysis around the suture material. It is suggested that the tiny and sensitive wall of aorta suffered from severe disturbance of vasa and nervi vasornm caused by the invasive intervention in the transplanted animals, so that it became vulnerable to atherosclerosis progression in all the samples. The reproducibility of the promising regression model was derogated by the striking dependence of the results upon the operation technique. Conclusions: Thoracic to abdominal aorta transplantation did not offer a way which would enable us to study atherosclerosis regression in apt E KO mice. This work was supported by grant 1M awarded by the Ministry of Education of the Czech Republic. W09-P-026] EXERCISE TRAINING INCREASES SKELETAL MUSCLE LDL UPTAKE C. Vinagre, K. De Angelis, C. Irigoyen, R. Maranhao. Heart Institute (InCor), Medical Schoo~ University of Sat Paulo, Sat Paulo, Brazil Objective: The purpose of this study was to evaluate the effects of exercise on the LDL tissue uptake. Methods: Twenty four C57 mice (C) and 11 LDL receptor knockout mice (K) were studied. The C group was divided: 12 exercise-trained (TC) and 12 untrained (UC) mice. The K group was also divided: 5 exercise-trained (TK) and 6 untrained (UK) mice. The TC and TK groups were submitted to a training protocol. At the end of training, a artificial lipid emulsion similar to LDL (LDE) labeled with 3H-cholesteryl eter was injected intravenously, in the animals of the 4 groups. After 24 h, the animals were sacrified and the liver, skeletal muscle and spleen were 0 I 0 Go 75th EAS Congress, April 2005, Prague, Czech Republic 90
93 Aorta transplantation in juvenile apolipoprotein E-deficient mice: Possible model for studies on regression of atherosclerotic lesions? Zbynek Tonar 1,2, Dagmar Bobkova 1, Kirsti Witter 3, Vit Martin Matejka 2, Jana Havlickova 4, Vera Lanska 5, Rudolf Poledne 1 1 Laboratory for Atherosclerosis Research, Institute for Clinical and Experimental Medicine, Prague, Czech Republic 2 Department of Histology and Embryology, Faculty of Medicine in Pilsen, Charles University in Prague, Czech Republic 3 Institute of Histology and Embryology, Department of Pathobiology, University of Veterinary Medicine Vienna, Austria 4 Laboratory of Pathophysiology of Cardiovascular System, Institute for Clinical and Experimental Medicine, Prague, Czech Republic 5 Statistics Unit, Institute for Clinical and Experimental Medicine, Prague, Czech Republic Abstract Syngeneic transplantation of murine aorta sections with advanced atherosclerotic lesions to defined recipients is a valuable model for regression studies. So far, this model has not been used to study the regression of initial atherosclerotic lesions. The aim of this study was to evaluate a microsurgical technique of syngeneic heterotopic transplantation of the thoracic aorta of apolipoprotein E-deficient (ApoE-/-) juvenile mice to the abdominal aorta of wild-type recipients. Stereological quantification methods were tested in order to assess changes in structure and volume of the aortic wall including the involvement of immune cells in changes of the atherosclerotic lesions. The animals were euthanized one month after surgery and histological analysis including stereological quantification of changes in both the grafts and adjacent aorta segments was performed. The overall survival rate of the recipients was 62.5%. No regression of initial atherosclerotic lesion was achieved and neointima formation and degradation of elastin prevailed in all transplanted specimens. The volume of the atherosclerotic lesions was higher (p<0.001) and elastin length density was lower (p<0.001) in transplanted ApoE-/- samples compared to adjacent segments. In transplanted grafts, T- and B-lymphocytes, macrophages and neutrophilic granulocytes formed non-random clusters within the vessel wall and they were colocalised with the sutures. The reproducibility of the promising regression model was derogated in young mice by the striking dependence of 91
94 the results upon the operation technique. Stereological assessment has proven to be accurate, correct and reproducible and provided us with with robust quantitative estimates which can be achieved with a reasonable effort. Key words heterotopic transplantation; histology; stereology Introduction Mechanisms of regression of atherosclerotic plaques can be readily studied using the ApoE-deficient mouse model. Apo E-/- mice are characterized by the loss of the ligands for lipoprotein receptors, which is associated with an increase in total cholesterol due to slowed utilization of remnant-like particles and with an increased risk for the development of atherosclerosis due to LDL particle accumulation (Plump et al., 1992; Breslow, 1993; Breslow, 1996). Development of atherosclerotic lesions is also affected by cholesterol reverse transport, in which ApoE plays a pivotal role. Excessive cholesterol is released from the subendothelial space by means of macrophage-derived ApoE (von Eckardstein, 1996; Curtiss, 2000; for review see Greenow et al., 2005). Unlike mice and rats with unpertuberted cholesterol metabolism, the Apo E-/- mice are characterized by increased cholesterolemia and spontaneous development of atherosclerotic lesions. Basal cholesterolemia of Apo E-/- mice is up to five times higher than that of animals of the same strain without the genetic defect, i.e. about 10 mmol/l. Due to the inability of ApoE production, ApoE-/- mice are highly sensitive to dietary intervention. In these animals, administration of a cholesterol diet, mimicking increased cholesterol intake by humans in developed countries, leads to an increase in cholesterolemia and the development of macroscopic atherosclerotic lesions (van Ree et al., 1994). Sites of predilection and early development of atherosclerosis in the ApoE-/- model include the aortic root and the curvature of the aortic arch and its branches (Nakashima et al., 1994). Lesions developing in ascendent aorta and aortic arch of ApoE-/- mice are in both localisation and histological appearance very similar to those in human (Jawien et al., 2004; Ohashi et al., 2004), although lipoprotein profiles are not the same in both species (Garber et al., 2000). In wild type mice, HDL represent the majority of lipoprotein particles. In ApoE-/- mice, a shift in advantage of VLDL and chylomicron remnants can be observed. In contrast, human blood contains predominantly LDL particles (Havel et al., 1955; Gotto et al., 1986). Development and regression of atherosclerotic lesions can be readily studied by syngeneic transplantation of cells or vessel segments between ApoE-/- and wild type animals. Transplantation of macrophages expressing mouse or human apolipoproteins to ApoE-/- recipients can lead to plaque regression or stabilisation with or 92
95 without the normalisation of the lipoprotein profile of the animal (Shi et al., 2000; van Eck et al., 2000, Gough and Raines, 2003; Su et al., 2003). Syngeneic transplantation of atherosclerotic aorta segments from ApoE-/- mice to defined recipients seems to be a particularly valuable model for regression studies (Reis et al., 2001; Rong et al., 2001; Chereshnev et al., 2003; Trogan et al., 2004). It was demonstrated that even advanced atherosclerotic lesions can regress completely in a normolipidaemic environment with normal apolipoprotein levels (Reis et al., 2001) or at least stabilised and prevented from progression in an environment with increased HDL concentration (Rong et al., 2001). For reviews of immune mechanisms in development of atherosclerotic lesions, see the papers published by Hansson (2001), Libby (2002), Boyle (2005), and Moos et al. (2005). So far, studies based on the transplantation of aorta segments used only adult animals with fully developed plaques. For examination of subtle regression mechanisms of atherosclerotic lesions it would be, however, desirable to develop a similar transplantation model using juvenile animals. The aim of our study was therefore to evaluate a microsurgical technique of syngeneic heterotopic transplantation of the thoracic aorta of juvenile mice to the abdominal aorta of wild-type recipients, and to assess and to quantify the changes in structure and volume of the aortic wall (preliminarily assessed by Tonar et al., 2005) including a screening of involvement of immune cells in changes of the atherosclerotic lesions. Material and Methods Animals and diet Three-month-old male mice of ApoE-/- (C57Bl/6) strain (n=24) and age-matched syngeneic wild type mice (n=24) were used. All the animals were obtained from the Jackson Laboratory (Bar Harbor, ME, USA). They weighed g at the start of the experiment. Before and after transplantation, the animals were fed standard laboratory diet (chow), 8 mm pelleted diet (SEMED, Prague, Czech Republic) ad libitum. Tap water without any pre-treatment was available ad libitum. During the experiment, all animals were kept separately in cages (placed in conventional breeding place) on softwood granules as bedding and under standard conditions: fluorescent lighting: aprox. 300 lux at 1 m above floor from 07:00 to 18:00, room temperature was controlled at 21 ± 2ºC with 17 air changes per hour and a relative air humidity of 45 ± 5%. The study protocol was approved by the local research ethics committee and the animals were given care according to rules valid in the Czech Republic as well as the European Convention for the Protection of Vertebrate Animals used for Experimental and other Scientific Purposes (1986). 93
96 Experimental design The thoracic aorta of donor mice, which is known to be the site of initiation of atherosclerotic lesions, was transplanted to the abdominal aorta of age-matched syngeneic recipients as follows: from ApoE-/- to ApoE-/- (group 1, n=8); from ApoE-/- to wild type (group 2, n=8); from wild type to wild type (group 3, n=8). Transplanted segments, as well as the segments of donor thoracic aortae situated proximally and distally to the transplanted area, were analysed one month after transplantation. Transplantation procedure The aortic transplantation with infrarenal position was performed as described by Koulack et al. (1995). Donor and recipients were anesthetized by administration of fentanyl and droperidole i. m. (0.5 ml of combination/kg body weight, Innovar-Vet Inj containing 20 mg/ml droperidol mg/ml fentanyl citrate; Janssen, Toronto, Canada) and midazolam (5 mg/kg body weight). Thoracic donor aortae were removed, perfused with chilled heparinised saline, and a 5 mm segment was taken from the midportion between the left subclavian artery and diaphragm. Harvested aortae were preserved in chilled saline (-4 C) while the recipient mice were being prepared. The recipient infrarenal aorta was exposed, clamped and transsected. The donor aortic segment was inserted as a tube graft by microsurgical anastomosis (interrupted sutures of 11-0 nylon monofilament, S&T, Neuhausen, Switzerland) as described Reis et al. (2001). The handling time of the transplantation was less than 30 minutes. After removing the aortae, the donors were euthanized by overdose of anaesthesia. The recipient animals were euthanized one month post surgery by overdose of anaesthesia followed by cervical dislocation with subsequent exsanguination (suing decapitation). Lipid analysis After euthanasia, blood (contaminated by a small amount of lymph) was collected in order to analyse plasma cholesterol concentrations. Plasma was harvested by centrifugation of the blood sample (containing 5 µl of 10% EDTA per 1 ml of blood) for 10 minutes at 12,000 rpm. Cholesterol concentrations were measured using colorimetric enzymatic assay kits (Boehringer Mannheim Biochemicals, Germany). Histology Recipient vessel (cranial and caudal part of the abdominal aorta) and grafted aorta were sampled individually, fixed with formalin and embedded in paraffin. Cross sections (5 µm) were stained with Verhoeff's haematoxylin and green trichrome according to the modified method described by Kocova (1970). Pathological alteration of 94
97 the vessel wall was assessed by light microscopy. We compared our findings to the classification of atherosclerotic lesions recommended by the American Heart Association (Stary, 2000; Bobkova and Tonar, 2005). Immunohistochemistry Cross sections (5 µm) of the aortae were mounted on Super Frost slides coated with (3- aminopropyl)triethoxysilane (Sigma-Aldrich, Vienna, Austria), deparaffinised and rehydrated. Endogenous peroxidase activity was blocked with 0.6% H 2 O 2 in methanol. After antigen unmasking in citrate buffer (ph 6.0) in a microwave oven, unspecific binding reactivity was blocked with normal goat serum (DakoCytomation, Glostrup, Denmark) or bovine serum albumin (Sigma-Aldrich, Vienna, Austria). The sections were incubated with the primary antibodies (Table 1) overnight at 4 C. Immunoreaction of rabbit and mouse primary antibodies was detected using the PowerVision TM Poly-HRP anti-rabbit IgG IHC Kit (Immunovision Technologies, Daly City, CA, USA) and the Vector M.O.M. Peroxidase kit (Vector Laboratories, Burlingame, CA, USA), respectively. Immunoreaction of rat primary antibodies was detected by rat biotinylated mouse adsorbed secondary antibodies (Vector Laboratories, Burlingame, CA, USA) and the Vectastain Peroxidase Standard ABC kit (Vector Laboratories, Burlingame, CA, USA). The immunohistochemical reactions were visualised with diaminobenzidine (Sigma-Aldrich, Wien, Austria) in 0.03% H 2 O 2. All sections were counterstained with Mayer's haematoxylin, dehydrated and mounted with DPX (Fluka, Buchs, Switzerland). Sections of the small intestine of wild type and Apo E-/- mice served as a positive control. For negative control, unspecific rat, rabbit and mouse IgG were used instead of the primary antibody. Quantitative assessment of alterations of the vessel wall For a quantitative analysis, we followed the well-documented methodology of Nachtigal et al. (2004) with respect to general principles of stereology (Howard and Reed, 1998). These methods allow a reliable estimation of lesion volume in a three dimensional space. Furthermore it is possible to assess quantitatively, whether certain structures are distributed randomly or whether their occurence is related to the pathological changes of the vessel under study. In order to estimate angiostenosis and size of the atherosclerotic lesion, in each sample, a segment of 0.36 mm underwent a stereological analysis with the use of the PointGrid module (Figure 1A) of the Ellipse software (ViDiTo, Kosice, Slovakia). Within the reference volume, equidistant sections were selected through systematic 95
98 uniform random sampling. The position of the first tissue section in the volume was random, i.e. equal to a product of (72*n), where n was a random number between 0 and 1. Starting with this section, every ninth section was captured with two constant magnifications, so that the distance between the two neighbouring calibrated photomicrographs (sampling period) was 45 µm. We assessed the area of an atherosclerotic or arteriosclerotic lesion in each tissue section according to Equation 1: esta = a P, (1) where esta was the estimated area of the arteriosclerotic lesion or of the vessel lumen, grid parameter a was the area corresponding to one test point and P was the number of test points hitting the arteriosclerotic lesion or vessel lumen. The total number of points counted was at least 200 in all sections of each series. The Cavalieri principle (Russ and Dehoff, 2001) was used for the estimation of the volume V of the arteriosclerotic lesion within the reference segment of the aorta (Equation 2): estv = T A + A A ), (2) ( 1 2 m where estv was the Cavalieri volume estimator, T = mm was the distance between the two following selected sections, Ai was the area of the arteriosclerotic lesion or vessel lumen in the i-th section, and m stood for the total number of sections selected from the series. To estimate the value of m, i.e. the variation caused by sampling the serial sections, we used Gundersen and Jensen s (1987) method to predict the coefficient of error (CE). Preliminary analysis proved that the number of sections sampled within each tissue block had to be m=8 in order to keep the CE 0.05 (Figure 2). The area fraction of the free vessel lumen (AFFVL) was used as a parameter that characterizes the relative obliteration of the aortic lumen by the arteriosclerotic lesion (Equation 3): (mozna otocit: The relative obliteration of the aortic lumen was characterised by the parameter... ) A( lesion) AFFVL = ( 1 ) 100% ( ), (3) A lumen 96
99 where A(lesion) was the area of the arteriosclerotic lesion, and A(lumen) was the area of the total vessel lumen, including the lesion. In cases of deeper invasion of the lesion towards tunica media, where the border between subendothelial connective tissue and tunica media was altered, the outer border of the arteriosclerotic lesion was considered to be at the level of the innermost elastic lamina. Elastinolysis was assessed by means of length density of profiles of elastin fibres and membranes using the relation L A =L/A, where L A was the length density of elastin fibres (intensity of planar fibre process, Stoyan et al., 1995), L was the estimated length of elastin profiles and A was the reference area the tunica media. The method (module LineSystem, software Ellipse) was based on counting the intersections of elastin fibres and membranes with a system of circular arcs randomly superposed on the micrographs (Figure 1B). The results are presented as average values for each set of 8 micrographs per tissue sample. We tested the randomness of spatial patterns of T- and B-lymphocytes, neutrophilic granulocytes, and macrophages in sections through the vessel wall, describing the distribution of interpoint distances among the centres of gravity of the profiles of the cells (Philimonenko et al., 2000) at the intervals µm. The method was based on the analysis of paired correlation (clustering) and cross-correlation (colocalisation) functions implemented in the module Gold of Ellipse software. The vessel wall was selected as the region of interest, while the vessel lumen was excluded from the reference space. The same testing procedure as for clustering (local increase of density) was performed to test colocalisation of the leukocytes with the stitches. Monte Carlo estimates of two-sided 95% confidence intervals for histogram bar heights and one-sided 1% and 5% tests for clustering or colocalisation were carried out using 999 simulations of N realizations (N was equal to the number of evaluated images) of the binomial process with number of simulated points equal to the number of observed points. Similarly, calculated critical values were used for verifying the clustering and/or colocalisation of the particles: for the one-sided tests the 50th value from the maximum was used at 5% confidence level, and the 10th value from the maximum at a 1% confidence level. Statistics The data were processed with the Statistica Base 7.1 (StatSoft, Inc., Tulsa, OK, USA). The Shapiro-Wilks' W test was used in testing for normality. The Kruskal-Wallis test was used to compare the groups under study. The differences were considered statistically significant if p<0.05. The concordance between three observers was 97
100 quantified with the intraclass correlation coefficient (ICC) according to Shrout and Fleiss (1979). The results of lipid analysis are presented as mean ± standard deviation. Results Animals and surgery The basal cholesterolemia was ± 1.64 mmol/l in the ApoE-/- mice and 2.14 ± 0.13 mmol/l in the wild type mice. Three animals died during the operation or on the operation day due to non-patency of the aorta. Six other animals died during the first week after transplantation. The overall survival rate in the transplanted animals was 62.5%. All survivor recipients appeared to be healthy and behaved normally. Morphology of adjacent segments of the donor aorta The aortic segments of wild-type mice adjacent to the transplanted segment contained no lesions (Figure 3A). In several aortae of ApoE-/- mice, foam cells were found in small initial eccentric lesions comparable to human type I lesions (Figure 3B), but most of the vessels were free of any lesions, even in the regions of arterial branching. Immunohistochemistry proved only occasional lymphocytes and neutrophils (but no macrophages) in the vicinity of vasa vasorum. No difference between the proximal (upstream) and distal (downstream) nontransplanted segments was found. Morphology of aortic grafts In all groups, transplantation led to neointima formation (Figure 3C) as well as disruption and regression of the elastic lamellae (Figure 3D) in the tunica media of the grafted aorta. The neointima was rich in smooth muscle cells. In group 1, where ApoE-/- were donors as well as recipients, initial type I lesions were found, but without any qualitative difference when compared to the non-transplanted segments. In all the transplanted aorta segments, i.e. in samples from group 1, 2, and 3, endothelium was continuous. No signs of neoangiogenesis within the intima was observed. In some cases, the part of the adventitia facing the stitch was slightly thickened with increased cellularity in comparison with the other parts of the adventitia. In this region, neutrophilic granulocytes and T-lymphocytes were found. In two specimens, only T-lymphocytes invaded the tunica media of the aorta (Figure 3E). In some cases, an increased amount of connective tissue was present in the adventitia next to the stitches. T- and B-lymphocytes (Figure 3E, 3F), a few macrophages (Figure 3G) and neutrophils (Figure 3H) were found in this location, dispersed among collagen fibres and fibrocytes. 98
101 The stitches were usually encircled by a capsule composed of concentrically arranged fusiform cells. This capsule contained a large number of neutrophilic granulocytes with normal nuclei and B-lymphocytes. Quantification of lesions after transplantation The estv of the lesion, AFFVL and elastin length density did not differ between the individual groups of this study (Figure 4). However, in all the transplanted grafts of the aorta estv of the lesion was higher (p<0.001), the AFFVL was lower (p<0.001), and the elastin length density was lower (p<0.001) than in neighbouring proximal and distal non-transplanted segments. The Pearson correlation coefficient between estv and AFFVL was -0.41, between estv and L A it was 0.36, and between AFFVL and L A it was Seven samples were excluded from quantification because of mechanical damage to the vessel wall which did not allow reliable morphometry. The variability among three independent observers in estimates of lesion volume and of length density of elastin network are presented in Figure 5 as values of the intraclass correlation coefficient. Spatial distribution of leukocytes In transplanted grafts, all types of leukocytes, i.e. lymphocytes, monocytes/macrophages and neutrophilic granulocytes, were arranged in significant non-random clusters, which were colocalised with stitches within the intervals summarized in Table 2. Discussion Clinical outcome Although Chereshnev et al. (2003) reported excellent results with a 100% recovering rate in 26-week-old animals, the findings of Reis et al. (2001) and Rong et al. (2001) with 70-80% success seem much more likely and correspond to the survival rate in our study (67.5%). When developing a mouse aortic transplantation model, Koulack et al. (1995) reported an initial 75% mortality rate (caused mainly by thrombosis and shock), which was improved to a success rate of >80% after performing nearly 200 operations. As our experiment was carefully performed by a skilled technician with sufficient experience in microsurgery on small laboratory animals, the present results cast doubt on the reproducibility of the transplantation model of atherosclerosis regression in young mice. The surgery might have coincided with the normal growth of aorta so the alteration of the vessel wall by invasive procedure and damage to the nervi and vasa vasorum resulted in much more pronounced formation of concentric neointima rich in smooth muscle cells than known from adult animals. Except for age, we are not aware of any other factor which might explain the relatively high mortality and significant transplant arteriosclerosis in young animals used in this study. 99
102 Lesions in the transplanted aorta sections and transplant arteriosclerosis Structural alterations observed in transplanted aorta sections in comparison with host aorta segments included development and/or increasing volume of the arteriosclerotic lesion, decrease of the free vessel lumen, neointima formation, elastinolysis and accumulation of immune cells in the vessel wall. The volume of the arteriosclerotic lesions as well as the decrease of the free vessel lumen in the transplanted aorta segment strikingly did not differ between the individual study groups (Figure 4A-D). Although the median of estv of the lesions was higher in group 1, i.e., in ApoE-/- recipients, than in the other groups with wild-type recipients, the difference was not significant. Fatty streak formation did not occur or progress in any of the analysed samples. Since Lee et al. (2000) reported about the protective role of nitric oxide synthase (NOS) induced by aortic transplantation, we speculate that NOS might have inhibited adhesion of leukocytes and further progression of initial fatty streaks in all transplanted specimens, thus compensating the hyperlipidemia in ApoE-/- mouse. The lesions found in transplanted specimens have probably to be considered as transplant arteriopathy rather than progression of initial atherosclerotic lesions. The etiology of transplant arteriosclerosis was suggested to be multifactorial and its precise mechanism remains obscure to date (Soleimani and Shi, 2006). In the rat, the severity of age-related neointima formation in syngeneic aorta transplantation (in the absence of alloreactivity and immunosuppressive drugs) is primarily determined by the recipient's age rather than the donor's age, young recipients generally being less affected (Calfa et al., 2005). This complies with the fact that the lowest AFFVL in juvenile ApoE-/- mice was 60%, i.e. the narrowing of the vessel lumen caused by transplant arteriosclerosis was far from being occlusive, perhaps due to the known arterioprotective property of bone marrow-derived progenitor cells in juvenile ApoE-/- mice (Rauscher et al., 2003). Neointima formation in our experiment was qualitatively the same as usually reported from allograft studies in mice (e.g. Chow et al., 1996; Sun et al., 1998). However, as neointima proliferation, endothelial regeneration (Hu et al., 2003), and smooth muscle cells recruitment are dependent on alloimmune cellular responses (Chow et al., 1996) and involvement of hematopoietic stem cells (Sakihama et al., 2004), we have no evidence the mechanisms of transplant arteriosclerosis are the same in syngeneic as in non-syngeneic transplantation. Detailed descriptions of transplant arteriosclerosis in syngeneic aortic transplantation in mice are not available. We can 100
103 only speculate that our findings suggest that the susceptibility to transplant arteriosclerosis might be higher in ApoE-/- mice than in female Fisher rats (Calfa et al., 2005), where neointimal lesions after syngeneic transplantation could not be detected.. To elucidate these questions, a detailed study focused on transplant arteriosclerosis in syngeneic mice would be required, including quantitative immunohistochemistry of adhesion molecules (VCAM, ICAM), electron microscopy to reveal the phenotypic alteration of vascular smooth muscle cells, assessment of kinetics of cytokine production and MHC-matching. Such results would be comparable to those published by Ensminger et al. (2002), who performed their studies on partially and fully allogeneic mouse. Elastin degradation is generally related to advanced atherosclerotic lesions rich in macrophage-borne proteases, but not to initial atherosclerotic lesions (Gough et al., 2006). Since we found only slight arteriosclerotic lesions (type I), but significant elastinolysis, we conclude that atherosclerosis itself did not contribute to the decrease of elastin length density. Elastin destruction observed in transplanted specimen corresponded to the distribution pattern of macrophages which surrounded the stitches. At these sites, elastinolysis was also most evident. Degradation of elastin fibres, accumulation of immune cells and fibrous encapsulation of the stitches probably represent rather stages of healing processes than an answer to infection during surgery, since neither bacteria nor neutrophilic granulocytes with hypersegmented nuclei could be found. Histological quantification in assessment of development and regression of atherosclerotic lesions Due to our experience, stereology provided us with reproducible quantitative estimates which were achieved with a reasonable effort. The sampling strategy used for the Cavalieri method was based on systematic uniform random sampling, the variability of which was low enough. Point counting method seemed to be more laborious, but more robust to the staining variation than the segmentation methods used for the same purpose e.g. by Rong et al. (2001). As the lower limits of the 95% confidence intervals of the intraclass correlation coefficient exceeded 0.7 in both estv of atherosclerotic lesions and length density of the elastic fibres, we consider the interobserver variability to be low enough. The wider confidence intervals in the length density of elastin fibres was caused by successive branching of the main elastin fibres into a fine network so that the very detailed demarcation of the delicate fibres remained rather subjective. The AFFVL parameter and estv of arteriosclerotic lesions have to be considered complementary. The AFFVL parameter is relatively robust with respect to the deviation of the section plane in regard to the transversal plane. In spite of carefully orienting the paraffinembedded tissue sample, such a deviation might occur. As AFFVL is a dimensionless ratio, it does not become biased by absolute differences in the size or shape of the aorta among the animals. It was used as an obstruction 101
104 measure of the lumen by the lesion. Taking into account the size of the reference volume, it becomes apparent that in most cases we assessed the size of one lesion rather than several lesions. According to our experience, stereological assessment has proven to be accurate, correct and reproducible. If the bias of the results caused by the irregular shape of the lesion were avoided, the total number of test points hitting the area of interest should be above 80. This number was estimated according to the nomogram of Gundersen and Jensen (1987), taking into account the irregular shape of the lesion and a CE<0.05 for the estimate. In our method, this conventional limit was certainly exceeded, ranging from 200 to 300 intersections (depending on both lumen and lesion shape and size). Conclusions No regression of initial atherosclerotic lesion was achieved by syngeneic heterotopic transplantation of thoracic aorta segments of juvenile ApoE-/- mice to wild-type recipients of the same age. On the contrary, neointima formation, arteriosclerosis and degradation of elastin prevailed in all transplanted specimens, even in control groups. It is suggested that the tiny and sensitive wall of juvenile aorta suffered from severe disturbance of vasa and nervi vasorum caused by the invasive intervention in the transplanted animals, so that it became vulnerable to inflammation and transplant arteriopathy. The reproducibility of the promising regression model in 12-weekold mice was derogated by the striking dependence of the results upon the operation technique. Thoracic to abdominal aorta transplantation did not offer a method which would enable us to study atherosclerosis regression in 12-week-old Apo E-/- mice. Stereological assessment has proven to be accurate, correct and reproducible and provided us with with robust quantitative estimates achieved with a reasonable effort. Acknowledgements The experimental part of the work was supported by the grant 1M , and the histological evaluation was supported by the project MSM and MSM , all of them awarded by the Ministry of Education, Youth and Sports of the Czech Republic. Special thanks to Mrs. Magdalena Helmreich (Vienna, Austria) for performing the immunohistochemical processing. References Bobkova, D., Tonar, Z. (2005): Effect of long-term cholesterol diet on cholesterol concentration and development of atherosclerosis in homozygous apolipoprotein E-deficient mice. Acta veterinaria Brno, 74,
105 Boyle, J.J. (2005): Macrophage activation in atherosclerosis: Pathogenesis and pharmacology of plaque rupture. Current Vascular Pharmacology, 3, Breslow, J.L. (1993): Transgenic mouse model of lipoprotein metabolism and atherosclerosis. Proceedings of the National Academy of Sciences of the USA, 90, Breslow, J.L. (1996): Mouse models of atherosclerosis. Science, 272, Calfa, M., Aitouche, A., Vazquez-Padron, R.I., Gay-Rabinstein, C., Lasko, D., Badell, J., Farji, A., El-Haddad, A., Liotta, C., Louis, L.B., Simmonds, A., Pestana, I.A., Pang, M., Li, S., Pham, S.M. (2005): Aging and transplant arteriosclerosis in absence of alloreactivity and immunosuppressive drugs in a rat aortic model: recipient age's contribution. Transplantation, 79, Chereshnev, I., Trogan, E., Omerhodzic, S., Itskovich, V., Aguinaldo, J.G., Fayad, Z.A., Fisher, E.A., Reis, E.D. (2003): Mouse model of heterotopic aortic arch transplantation. Journal of Surgical Research, 111, Chow L.H., Huh S., Jiang J., Zhong R., Pickering J.G. (1996): Intimal thickening develops without humoral immunity in a mouse aortic allograft model of chronic vascular rejection. Circulation, 94, Curtiss L.K. (2000): ApoE in atherosclerosis: A protein with multiple hats. Arteriosclerosis, Thrombosis, and Vascular Biology, 20, Ensminger, S.M., Spriewald, B.M., Witzke, O., Morrison, K., Pajaro, O.E., Morris, P.J., Rose, M.L., Wood, K.J. (2002): Kinetics of transplant arteriosclerosis in MHC-class I mismatched and fully allogeneic mouse aortic allografts. Transplantation, 73, European Communities (1986): European convention for the protection of vertebrate animals used for experimental and other scientific purposes. European Treaty Series No. 123, Strasbourg. Garber, D.W., Kulkarni, K.R., Anantharamaiah, G.M. (2000): A sensitive and convenient method for lipoprotein profile analysis of individual mouse plasma samples. Journal of Lipid Research, 41, Gotto, A.M. Jr, Pownall, H.J., Havel, R.J. (1986): Introduction to the Plasma Lipoproteins, 3-4. In: Segrest JP, Albers JJ, (ed.): Methods in Enzymology. Vol Plasma Lipoproteins. Part A. Preparation, Structure, and Molecular Biology. Academic Press, Orlando, 992 pp. Gough, P.J., Raines, E.W. (2003): Gene therapy of apolipoprotein E-deficient mice using a novel macrophagespecific retroviral vector. Blood, 101, Gough, P.J., Gomez, I.G., Wille, P.T., Raines, E.W. (2006): Macrophage expression of active MMP-9 induces acute plaque disruption in apoe-deficient mice. The Journal of Clinical Investigation, 116,
106 Greenow, K., Pearce, N.J., Ramji, D.P. (2005): The key role of apolipoprotein E in atherosclerosis. Journal of Molecular Medicine, 83, Gundersen, H.J.G., Jensen, E.B. (1987): The efficiency of systematic sampling in stereology and its prediction. Journal of Microscopy, 147, Hansson, G.K. (2001): Immune mechanisms in atherosclerosis. Arteriosclerosis, Thrombosis, and Vascular Biology, 21, Havel, R.J., Eder, H.A., Bragdon, J.H. (1955): The distribution and chemical composition of ultracentrifugally separated lipoproteins in human serum. The Journal of Clinical Investigation, 34, Howard, C.V., Reed, M.G. (1998): Unbiased Stereology: Three Dimensional Measurement in Microscopy. 1st edn. Royal Microscopical Society, Microscopy Handbook Series No. 41. Springer-Verlag, New York, 246 pp. Hu, Y., Davison, F., Zhang, Z., Xu, Q. (2003): Endothelial replacement and angiogenesis in arteriosclerotic lesions of allografts are contributed by circulating progenitor cells. Circulation, 108, Jawien, J., Nastalek, P., Korbut, R. (2004): Mouse models of experimental atherosclerosis. Journal of Physiology and Pharmacology 55, Kocova J. (1970): Overall staining of connective tissue and the muscular layer of vessels. Folia Morphologica, 3, Koulack, J., McAlister, V.C., Giacomantonio, C.A., Bitter-Suermann, H., MacDonald, A.S., Lee, T.D. (1995): Development of a mouse aortic transplant model of chronic rejection. Microsurgery, 16, Lee, P.C., Wang, Z.L., Qian, S., Watkins, S.C., Lizonova, A., Kovesdi, I., Tzeng, E., Simmons, R.L., Billiar, T.R., Shears, L.L. 2nd. (2000): Endothelial nitric oxide synthase protects aortic allografts from the development of transplant arteriosclerosis. Transplantation, 69, Libby, P. (2002): Inflammation in atherosclerosis. Nature, 420, Moos, M.P.W., John, N., Gräbner, R., Nossmann, S., Gunther, B., Vollandt, R., Funk, C.D., Kaiser, B., Habenicht, A.J. (2005): The lamina adventitia is the major site of immune cell accumulation in standard chow-fed apolipoprotein E-deficient mice. Arteriosclerosis, Thrombosis, and Vascular Biology, 25, Nachtigal, P., Semecky, V., Kopecky, M., Gojova, A., Solichova, D., Zdansky, P., Zadak, Z. (2004): Application of stereological methods for the quantification of VCAM-1and ICAM-1 expression in early stages of rabbit atherosclerosis. Pathology - Research and Practice, 200,
107 Nakashima, Y., Plump, A.S., Raines, E.W., Breslow, J.L., Ross, R. (1994): ApoE-deficient mice develop lesions of all phases of atherosclerosis throughout the arterial tree. Arteriosclerosis, Thrombosis, and Vascular Biology, 14, Ohashi, R., Mu, H., Yao, Q., Chen, C. (2004): Cellular and molecular mechanisms of atherosclerosis with mouse models. Trends in Cardiovascular Medicine, 14, Philimonenko, A.A., Janacek, J., Hozak, P. (2000): Statistical evaluation of colocalization patterns in immunogold labelling experiments. Journal of Structural Biology, 132, Plump, A.S., Smith, J.D., Hayek, T., Aalto-Setala, K., Walsh, A., Verstuyft, J.G., Rubin, E.M., Breslow, J.L. (1992): Severe hypercholesterolemia and atherosclerosis in apolipoprotein E- deficient mice created by homologous recombination in ES cells. Cell, 71, Rauscher, F.M., Goldschmidt-Clermont, P.J., Davis, B.H., Wang, T., Gregg, D., Ramaswami, P., Pippen, A.M., Annex, B.H., Dong, C., Taylor, D.A. (2003): Aging, progenitor cell exhaustion, and atherosclerosis. Circulation, 29, Reis, E.D., Li, J., Fayad, Z.A., Rong, J.X., Hansoty, D., Aguinaldo, J.G., Fallon, J.T., Fisher, E.A. (2001): Dramatic remodeling of advanced atherosclerotic plaques of the apolipoprotein E-deficient mouse in a novel transplantation model. Journal of Vascular Surgery, 34, Rong, J.X., Li, J., Reis, E.D., Choudhury, R.P., Dansky, H.M., Elmalem, V.I., Fallon, J.T., Breslow, J.L., Fisher, E.A. (2001): Elevating high-density lipoprotein cholesterol in apolipoprotein E - deficient mice remodels advanced atherosclerotic lesions by decreasing macrophage and increasing smooth muscle cell content. Circulation, 104, Russ J.C., Dehoff R.T. (2001): Classical stereological measures, In: Russ J.C., Dehoff R.T. (ed): Practical Stereology. 2nd edn. Plenum Press, New York, 307 pp. Sakihama, H., Masunaga, T., Yamashita, K., Hashimoto, T., Inobe, M., Todo, S., Uede, T. (2004): Stromal cellderived factor-1 and CXCR4 interaction is critical for development of transplant arteriosclerosis. Circulation, 110, Soleimani, B., Shi, V.C. (2006): Experimental models of graft arteriosclerosis. Methods in Molecular Biology, 333, Shi, W., Wang, X., Wang, N.J., McBride, W.H., Lusis, A.J. (2000): Effect of macrophage-derived apolipoprotein E on established atherosclerosis in apolipoprotein E-deficient mice. Arteriosclerosis, Thrombosis, and Vascular Biology, 20,
108 Shrout, P.E., Fleiss, J.L. (1979): Intraclass Correlations: Uses in Assessing Rater Reliability. Psychological Bulletin, 2, Stary, H.C. (2000): Natural History and Histological Classification of Atherosclerotic Lesions. An Update. Arteriosclerosis, Thrombosis, and Vascular Biology, 20, Stoyan, D., Kendall, W.S., Mecke, J. (1996): Fibre and surface processes, In: Stoyan, D., Kendall, W.S., Mecke, J. (ed.): Stochastic geometry and its applications. 2nd edn. John Wiley & Sons, Chichester, 456 pp. Su, Y.R., Ishiguro, H., Major, A.S., Dove, D.E., Zhang, W., Hasty, A.H., Babaev, V.R., Linton, M.F., Fazio, S. (2003): Macrophage apolipoprotein A-I expression protects against atherosclerosis in ApoE-deficient mice and up-regulates ABC transporters. Molecular Therapy, 8, Sun, H., Valdivia, L.A., Subbotin, V. (1998): Improved surgical technique for the establishment of a murine model of aortic transplantation. Microsurgery, 18, Tonar, Z., Bobkova, D., Havlickova, J., Poledne, R. (2005):Vessel transplantation of apolipoprotein E-deficient mice as a model of atherosclerosis regression Atherosclerosis Supplements, 6, Trogan, E., Fayad, Z.A., Itskovich, V.V., Aguinaldo, J.G., Mani, V., Fallon, J.T., Chereshnev, I., Fisher, E.A. (2004): Serial studies of mouse atherosclerosis by in vivo magnetic resonance imaging detect lesion regression after correction of dyslipidemia. Arteriosclerosis, Thrombosis, and Vascular Biology, 24, van Eck, M., Herijgers, N., van Dijk, K.W., Havekes, L.M., Hofker, M.H., Groot, P.H., van Berkel, T.J. (2000): Effect of macrophage-derived mouse ApoE, human ApoE3-Leiden, and human ApoE2 (Arg158->Cys) on cholesterol levels and atherosclerosis in ApoE-deficient mice. Arteriosclerosis, Thrombosis, and Vascular Biology, 20, van Ree, J.H., van den Broek, W.J., Dahlmans, V.E., Groot, P.H., Vidgeon-Hart, M., Frants, R.R., Wieringa, B., Havekes, L.M., Hofker, M.H. (1994): Diet-induced hypercholesterolemia and atherosclerosis in heterozygous apolipoprotein E-deficient mice. Atherosclerosis, 111, von Eckardstein, A. (1996): Cholesterol efflux from macrophages and other cells. Current Opinion in Lipidology, 7,
109 Table 1 Primary antibodies Antibody Specifity Concentration Company CD3 monoclonal rabbit anti human (clone SP7) T-lymphocytes 1:500 LabVision, Fremont, CA, USA CD20 monoclonal rabbit anti human B-lymphocytes 1:100 LabVision, Fremont, CA, USA Monoclonal mouse anti human monocytes/macrophages MCA 874G Macrophages 1:100 Serotec, Düsseldorf, Germany (clone MAC 387) purified anti mouse neutrophils rat monoclonal antibody (clone 7/4) Neutrophil granulocytes 1:500 AMS Biotechnology Ltd., Abingdon Oxon, UK Table 2 Spatial distribution of leukocytes within the transplanted aortic grafts Clustering in the intervals: [µm] Colocalization with stitches in the intervals: [µm] p< <p<0.05 p< <p<0.05 T-lymphocytes none ; B-lymphocytes none 10-50; Macrophages none none Neutrophilic none 20-30; ;50-60 leukocytes 107
110 Figure 1. Counting points and lines. (A) Assessment of the estimated volume of the atherosclerotic lesion (estv) and the area fraction of the free vessel lumen (AFFVL) was based on counting the test points hitting the lesion (highlighted as yellow), or the lumen, respectively. The grid parameter a corresponds to the area of one test point. Scale bar 170 µm. (B) Circular arcs were used for estimating length density of elastin fibres and membranes. Scale bar 60 µm. Green trichrome and Verhoeff s hematoxylin stain. Figure 2. Analysis of sampling error. Average values of the Gundersen and Jensen s coefficient of error (estce(gj))for all sampling combinations of corresponding values of m (the number of sections). The pilot study was performed for volume of both vessel lumen (avg(lumen)) and lesions (avg(lesion)). To keep the CE 0.05 for each of the parameters, the suitable value of m=8 was found. 108

 Non-transplanted lesion-free")
. Scale bar 100 m.")

 Aorta of a wild type to wild type")

 Same, detail of elastinolysis and")
111 Figure 3. Histology of aorta grafts and adjacent host aorta segments. (A) Non-transplanted lesion-free abdominal aorta of a wild-type mouse (group 3). Scale bar 100 m. (B) Foam cells in the intima of an apoe-/- mouse, non-transplanted segment (group 1). Scale bar 50 m. (C) Aorta of a wild type to wild type transplantation case (group 3) with nearly concentric intimal thickening. Scale bar 200 m. (D) Same, detail of elastinolysis and inflammatory cells surrounding the stitch. Scale bar 50 m. A-D were stained with green 109
112 trichrome and Verhoeff s hematoxylin. (E) T-lymphocytes infiltrating the tunica media of a transplanted aorta segment of a wild-type mouse (group 3), immunohistochemical detection of CD3. Scale bar 50 m. (F) B- lymphocytes surrounding the stitch in the tunica adventitia of a transplanted aorta segment of an apoe-/- mouse (group 2), immunohistochemical detection of CD20. Scale bar 70 m. (G) Macrophages in the tunica adventitia of the same sample as in F, immunohistochemical detection of MCA 874G. Scale bar 70 m. (H) Neutrophilic leukocytes encircle a stitch in the tunica adventitia of a transplanted segment of an apoe-/- mouse (group 1), immunohistochemical detection using an anti-mouse neutrophils antibody. Scale bar 100 m. (E-H) Visualisation of the immunoreaction horseradish peroxidase/diaminobenzidine. Figure 4. Quantitative analysis of aortae in the experimental groups and in samples taken from different sites. (A, B) Estimated volume of lesions (estv), (C, D) area fraction of the free vessel lumen (AFFVL), and (E, F) length density (L A ) of elastin fibres. Values are medians with percentiles; n=12 in group 1 (ApoE-/- to ApoE-/-), n=13 in group 2 (ApoE-/- to wild-type(wt)), n=13 in group 3 (WT to WT); n=12 in transplanted, n=12 in proximal, n=13 in distal. P-values of Kruskal-Wallis ANOVA are presented; n.s. non significant. Proximal and distal are non-transplanted aortic segments adjacent to the transplanted graft. 110
113 Figure 5. Intraclass correlation coefficients (ICC). The variability among three independent observers in estimates of lesion volume and of length density of elastin network. Values are ICC and lower-upper limits of the 95% confidence intervals. 111
114 112
115 113
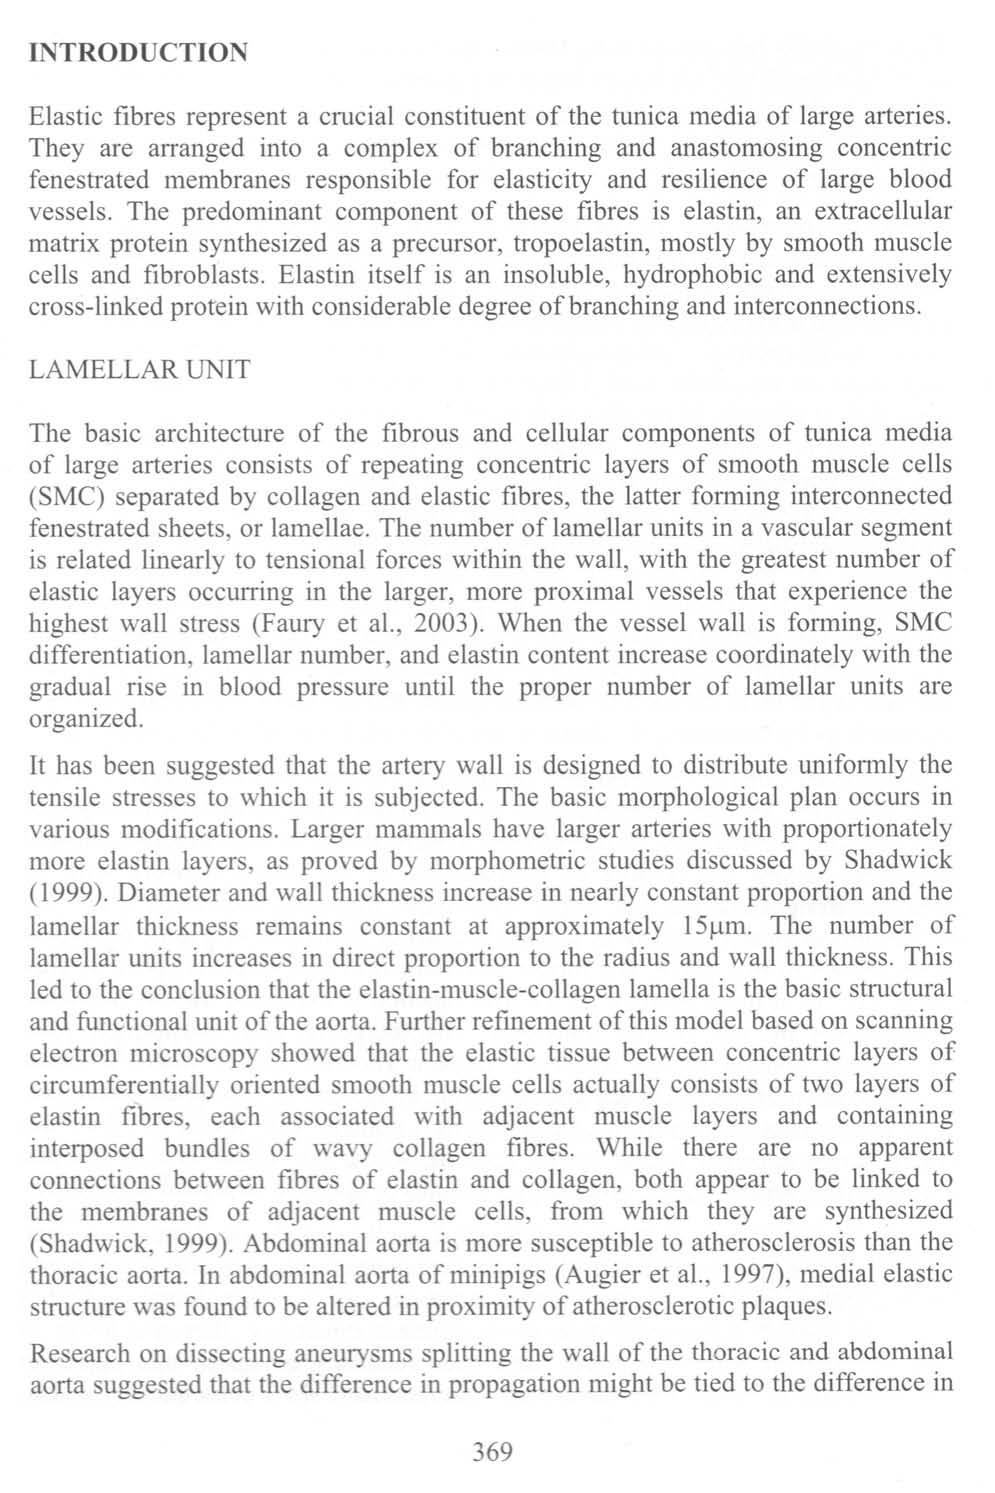
116 114
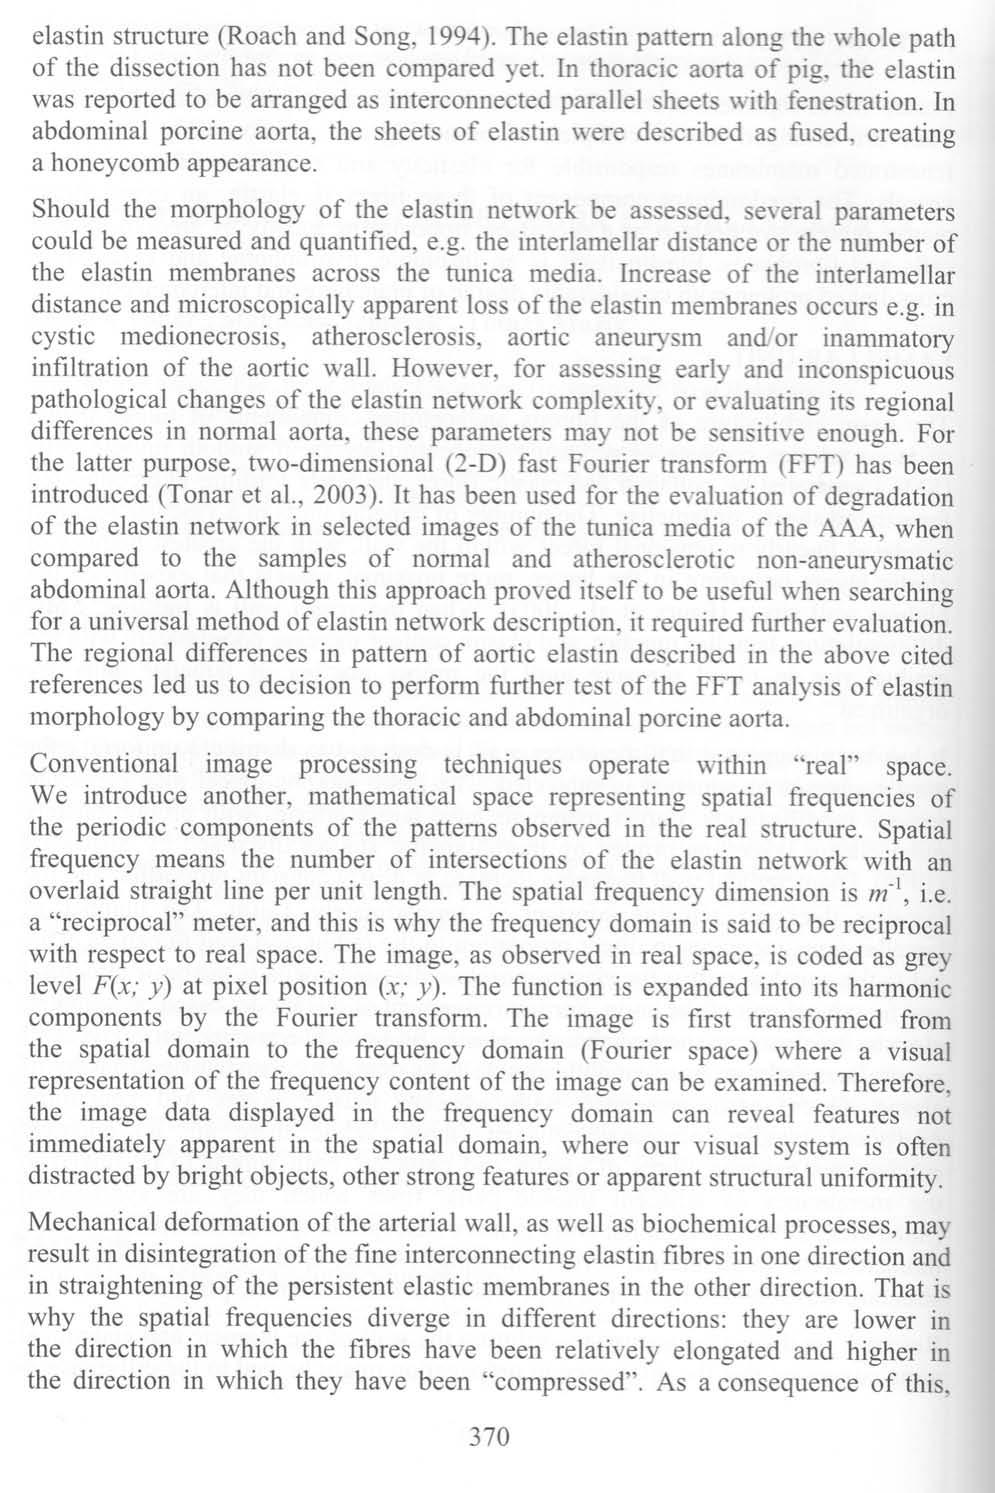
117 115
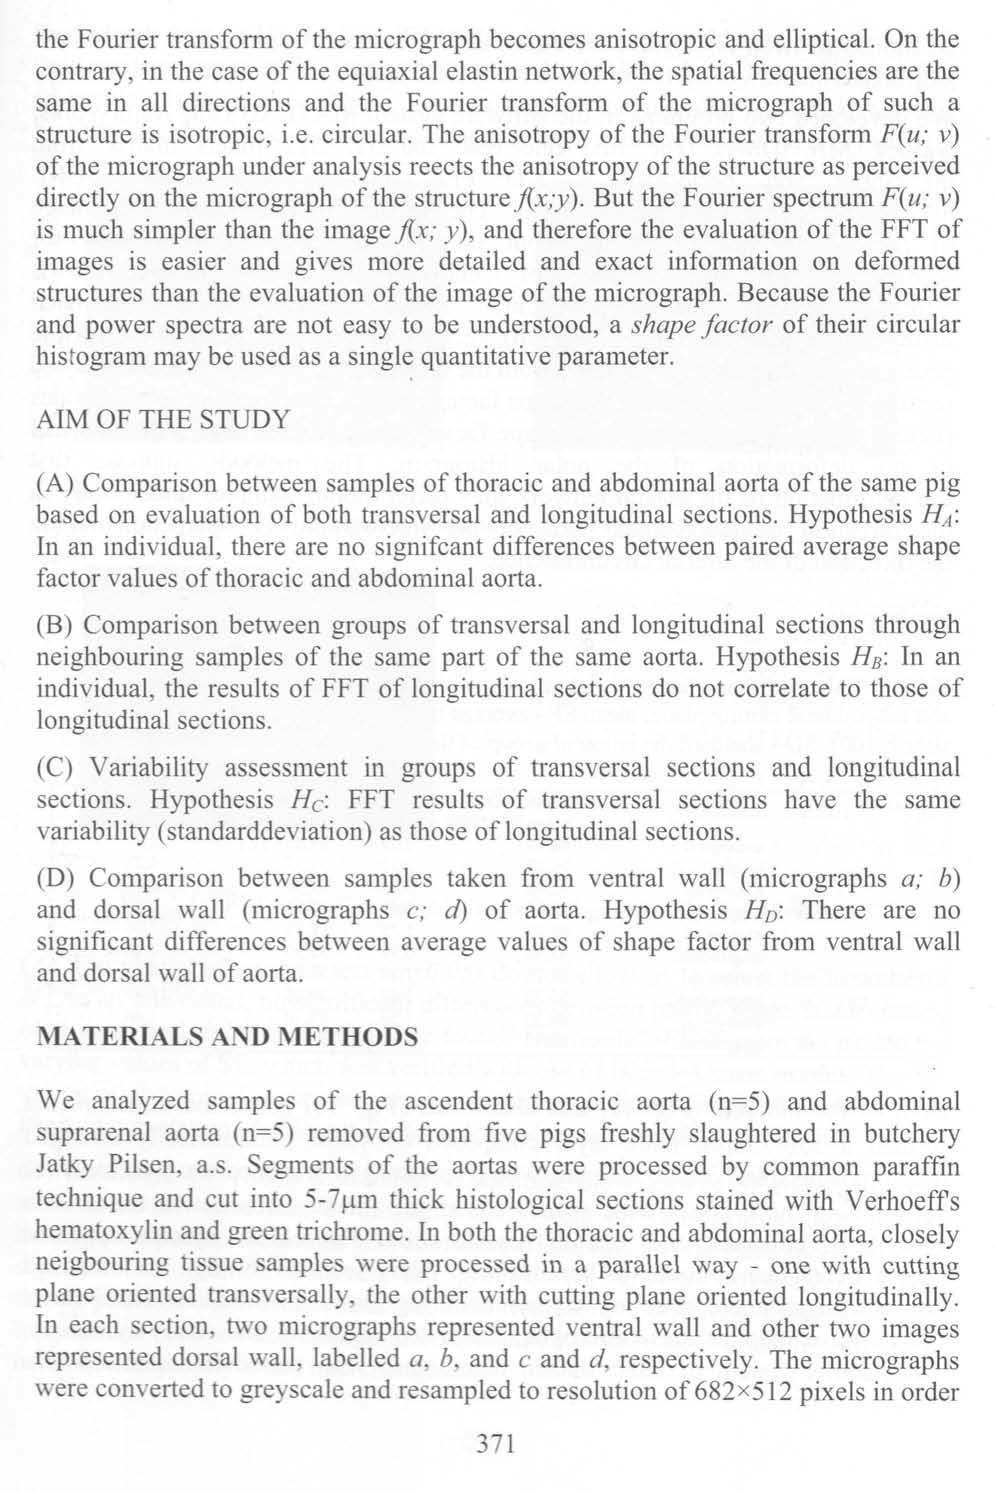
118 116
119 117
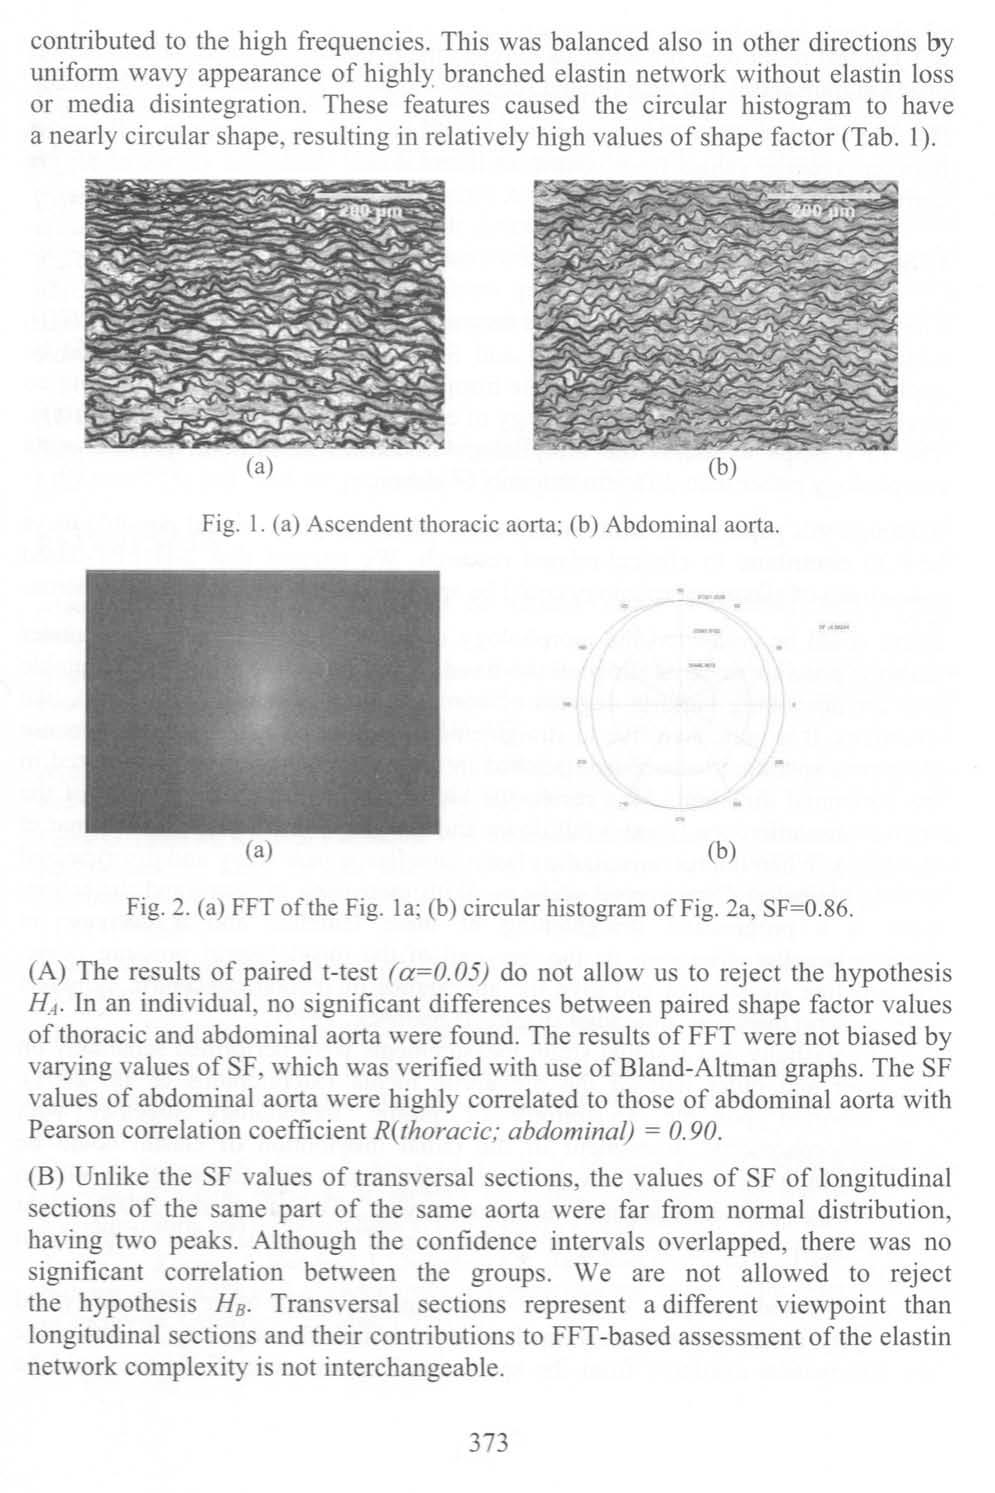
120 118
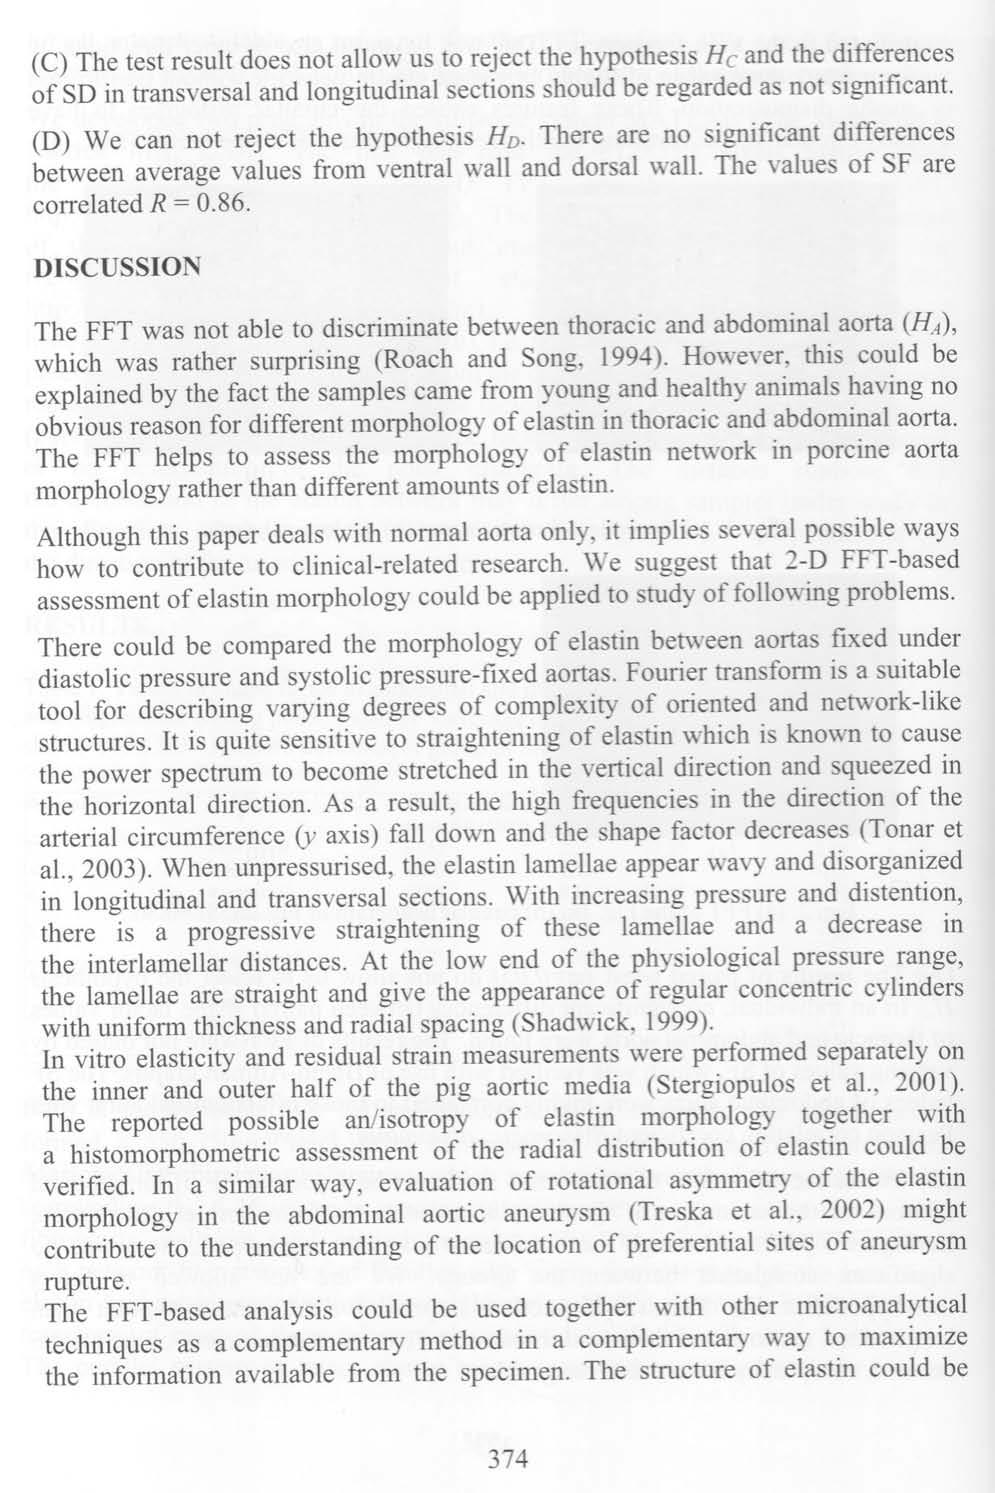
121 119
122 120
123 The 3 rd European Medical and Biological Engineering Conference November 20 25, 2005 EMBEC'05 Prague, Czech Republic MICROSCOPIC IMAGE ANALYSIS OF ELASTIN AND MORPHOMETRY OF WALL OF THORACIC AND ABDOMINAL PORCINE AORTA Z. Tonar, S. Němeček and R. Holota Charles University/Faculty of Medicine in Pilsen, Department of Histology and Embryology, and University of West Bohemia/Department of Mechanics, Pilsen, Czech Republic Comtes FHT Ltd., Pilsen, Czech Republic University of West Bohemia/Department of Applied Electronics and Telecommunications, Pilsen, Czech Republic tonar@ntc.zcu.cz Abstract: We analyzed tissue samples of the ventral and dorsal wall of normal thoracic and abdominal porcine aorta. The results of the two-dimensional Fourier analysis of micrographs of tunica media proved that the Fourier transform provided an efficient method for evaluating transversal and longitudinal cross sections of the elastin membranes and fibres. The shape of the power spectrum of elastin was a simple pattern, whose description was quantified by the shape factor of its polar coordinates histogram. We found no significant differences between paired shape factor values of thoracic and abdominal aorta. There were no significant differences between samples from ventral and dorsal wall of aorta. The FFT-based analysis provided us with reasonable results, therefore its further use can be recommended being aware of its limitations. We suggested several advisable applications of this method for elastin-related research. Lamellar unit thickness was higher in abdominal than in thoracic aorta, unlike the relative elastin content, which was the same in the thoracic as in the abdominal segment. Introduction Elastic fibres represent a crucial constituent of the tunica media of large arteries. They are arranged into a complex of branching and anastomosing concentric fenestrated membranes responsible for elasticity and resilience of large blood vessels. The predominant component of these fibres is elastin, an extracellular matrix protein synthesized as a precursor, tropoelastin, mostly by smooth muscle cells and fibroblasts. Elastin itself is an insoluble, hydrophobic and extensively cross-linked protein with considerable degree of branching and interconnections. Lamellar unit: The basic architecture of the fibrous and cellular components of tunica media of large arteries consists of repeating concentric layers of smooth muscle cells (SMC) separated by collagen and elastic fibres, the latter forming interconnected fenestrated sheets, or lamellae. The number of lamellar units in a vascular segment is related linearly to tensional forces within the wall, with the greatest number of elastic layers occurring in the larger, more proximal vessels that experience the highest wall stress [1]. When the vessel wall is forming, SMC differentiation, lamellar number, and elastin content increase coordinately with the gradual rise in blood pressure until the proper number of lamellar units are organized. It has been suggested that the artery wall is designed to distribute uniformly the tensile stresses to which it is subjected. The basic morphological plan occurs in various modifications. Larger mammals have larger arteries with proportionately more elastin layers, as proved by morphometric studies discussed by Shadwick [2]. Diameter and wall thickness increase in nearly constant proportion and the lamellar thickness remains constant at approximately 15 mm. The number of lamellar units increases in direct proportion to the radius and wall thickness. This led to the conclusion that the elastinmuscle-collagen lamella is the basic structural and functional unit of the aorta. Further refinement of this model based on scanning electron microscopy showed that the elastic tissue between concentric layers of circumferentially oriented smooth muscle cells actually consists of two layers of elastin fibres, each associated with adjacent muscle layers and containing interposed bundles of wavy collagen fibres. While there are no apparent connections between fibres of elastin and collagen, both appear to be linked to the membranes of adjacent muscle cells, from which they are synthesized [2]. Abdominal aorta is more susceptible to atherosclerosis than the thoracic aorta. In abdominal aorta of minipigs [3], medial elastic structure was found to be altered in proximity of atherosclerotic plaques. Research on dissecting aneurysms splitting the wall of the thoracic and abdominal aorta suggested that the difference in propagation might be tied to the difference in elastin structure [4]. The elastin pattern along the whole path of the dissection has not been compared yet. In thoracic aorta of pig, the elastin was reported to be arranged as interconnected parallel sheets with fenestration. In abdominal porcine aorta, the sheets of elastin were described as fused, creating a honeycomb appearance. Should the morphology of the elastin network be assessed, several parameters could be measured and quantified, e.g. the interlamellar distance or the number of the elastin membranes across the tunica media. Increase IFMBE Proc (1) ISSN: IFMBE 121
124 The 3 rd European Medical and Biological Engineering Conference November 20 25, 2005 EMBEC'05 Prague, Czech Republic of the interlamellar distance and microscopically apparent loss of the elastin membranes occurs e.g. in cystic medionecrosis, atherosclerosis, aortic aneurysm and/or inflammatory infiltration of the aortic wall. However, for assessing early and inconspicuous pathological changes of the elastin network complexity, or evaluating its regional differences in normal aorta, these parameters may not be sensitive enough. For the latter purpose, twodimensional (2-D) fast Fourier transform (FFT) has been introduced [5]. It has been used for the evaluation of degradation of the elastin network in selected images of the tunica media of the AAA, when compared to the samples of normal and atherosclerotic non-aneurysmatic abdominal aorta. Although this approach proved itself to be useful when searching for a universal method of elastin network description, it required further evaluation. The regional differences in pattern of aortic elastin described in the above cited references led us to the decision to perform a further test of the FFT analysis of elastin morphology by comparing the thoracic and abdominal porcine aorta. Conventional image processing techniques operate within a real space. We introduced another, mathematical space representing spatial frequencies of the periodic components of the patterns observed in the real structure. Spatial frequency means the number of intersections of the elastin network with an overlaid straight line per unit length, therefore its dimension is m 1. The image, as observed in real space, is coded as grey level F(x;y) at pixel position (x; y). The function is expanded into its harmonic components by the Fourier transform. The image is first transformed from the spatial domain to the frequency domain (Fourier space) where a visual representation of the frequency content of the image can be examined. Therefore, the image data displayed in the frequency domain can reveal features not immediately apparent in the spatial domain, where our visual system is often distracted by bright objects, other strong features or apparent structural uniformity. Mechanical deformation of the arterial wall, as well as biochemical processes, may result in disintegration of the fine interconnecting elastin fibres in one direction and in straightening of the persistent elastic membranes in the other direction. That is why the spatial frequencies diverge in different directions: they are lower in the direction in which the fibres have been relatively elongated and higher in the direction in which they have been compressed. As a consequence of this, the Fourier transform of the micrograph becomes anisotropic and elliptical. This contrasts with the case of the equiaxial elastin network, where the spatial frequencies are the same in all directions and the Fourier transform of the micrograph of such a structure is isotropic, i.e. circular. The anisotropy of the Fourier transform F(u; v) of the micrograph under analysis reflects the anisotropy of the structure as perceived directly on the micrograph of the structure f (x;y). But the Fourier spectrum F(u;v) is much simpler than the image f (x;y), and therefore the evaluation of the FFT of images is easier and gives more detailed and exact information on deformed structures than the evaluation of the image of the micrograph. Because the Fourier and power spectra are not easily understood, a shape factor of their circular histogram may be used as a single quantitative parameter. Aim of the study was to test the following hypotheses H A In an individual, there are no significant differences between paired average shape factor values of circular histograms of 2-D FFT (fast Fourier transform) spectra in both transversal and longitudinal sections of thoracic and abdominal aorta. H B In an individual, the results of FFT of transversal sections do not correlate to those of longitudinal sections through neighbouring samples of the same part in the same individual. H C FFT results of transversal sections have the same variability (standard deviation) as those of longitudinal sections. H D There are no significant differences between average values of shape factor in samples taken from ventral wall and dorsal wall of aorta. H E H F There are no significant differences in relative elastin content between samples of thoracic and abdominal aorta. There are no significant differences in lamellar unit thickness between samples of thoracic and abdominal aorta. Materials and Methods We analyzed samples of the ascendent thoracic aorta (n = 6) and abdominal suprarenal aorta (n = 6) removed from five pigs (weighing between kg) freshly slaughtered in the Jatky Plzeň butchery. After removing loose connective tissue, segments of the aortas were processed by common paraffin technique and cut into 5 7 µm thick histological sections stained with Verhoeff s hematoxylin and green trichrome [6]. In both the thoracic and abdominal aorta, closely neigbouring tissue samples were processed in a parallel way one with cutting plane oriented transversally, the other with cutting plane oriented longitudinally. In each section, two micrographs represented ventral wall and two images represented dorsal wall, labelled a, b, and c, d, respectively (Fig. 1) so that the total number of micrographs under study was n = 48 both in group of thoracic and abdominal aorta samples. The captured areas were free of any observable lesions. The micrographs were converted to greyscale (Fig. 2) and resampled to resolution of pixels in order to get images suitable as an input for the FFT analysis. We developed two programs in the software system MATLAB (The MathWorks, Natrick MA, USA). The first one read the pixels matrix from the input and performed a 2-D FFT on this data [7]. The second program [8] used the image of the Fourier spectra as an input image and applied the methods for recognition of IFMBE Proc (1) ISSN: IFMBE 122
 [9]. The testing line was perpendicular to elastin lamellae.")

.")
125 The 3 rd European Medical and Biological Engineering Conference November 20 25, 2005 EMBEC'05 Prague, Czech Republic Figure 1: Location of micrographs. Figure 4: Histogram of the FFT, SF = used the Plot Profile function in software ImageJ (W. Rasband, NIH, Bethesda, MD, USA) [9]. The testing line was perpendicular to elastin lamellae. In each cross section we assessed three profiles (n = 72). The lamellar thickness was calculated as e/ f, where e stood for the length of testing line and f for the number of intersections between lines and elastin lamellae. Figure 2: Image converted to greyscale. the degree of elastin complexity. These methods used calculated histograms in polar coordinates (Fig. 2b), i.e. they summarized the number of white pixels in each direction (0 to 360) from the centre of the image. Then an enclosed rectangle was constructed and the shape factor was calculated as a ratio of its sides (Feret s ratio). A minimum of the shape factor was 0, values near 1 meant small or no deformation of the polar histogram. The methods assume that the deformation of the elastin network may differ among samples under study in the direction of the vertical axis of the micrograph, i.e. perpendicular to the direction of the arterial circumference. We used the Oclass learning classifier module in Lucia software (Laboratory Imaging, Prague) in order to perform a phase segmentation of elastin, collagen and smooth muscle pixels (Fig ) in the RGB colour space (Fig. 13). After a visual verification, the area proportions of individual phases of micrographs were assessed (Fig. 14). For assessment of average lamellar unit thickness we Figure 3: FFT of the Fig. 2. Results Both in the thoracic and abdominal aorta, the tunica media formed a µm thick layer composed of concentrically arranged anastomosing spiral elastic laminae, which appeared as branched wavy membranes surrounding the 6 26 µm wide spaces containing the fine connective tissue with fibroblasts, collagen, and smooth muscle cells. The elastin system appeared as a network-like complex of bundles with many sections through the branched elastin bridges interconnecting the neighbouring elastic membranes. The Fourier transform of most of these micrographs showed regularity and rotary symmetry. The parallel system of intact elastin membranes with periodicity in the y axis contributed to the high frequencies. This was balanced also in other directions by uniform wavy appearance of highly branched elastin network without elastin loss or media disintegration. These features caused the circular histogram to have a nearly circular shape, resulting in relatively high values of shape factor. An overall morphology of tunica media of thoracic and abdominal aorta is demonstrated in Fig. 5 6, respectively. (A) The results of paired t-test do not allow us to reject the hypothesis H A. In an individual, no significant differences between SF values of thoracic and abdominal aorta were found. The results of FFT were not biased by varying values of SF (see the Bland- Altman graph, Fig. 7). The SF values of thoracic aorta were highly correlated to those of abdominal aorta (Fig. 8), R(thor, abdom) = (B) Unlike the SF values of transversal sections, the values of SF of longitudinal sections were far from normal distribution, having two peaks (Fig. 9). Although the confidence intervals overlapped, there was no significant correlation between the groups (Fig. 10). We IFMBE Proc (1) ISSN: IFMBE 123
. Figure 6: Abdominal aorta. are not allowed to reject the hypothesis H B.")
 The test result does not allow us to reject the hypothesis H C and the differences of SD in transversal and longitudinal sections should be regarded as not significant.")
 We do not reject the hypothesis H E. Relative proportion of elastin does not differ between thoracic (37.59% in average) and abdominal (37.41% in average) aorta. Figure 7: Difference plot (A).")
126 The 3 rd European Medical and Biological Engineering Conference November 20 25, 2005 EMBEC'05 Prague, Czech Republic Figure 9: Probability density plot (B). Figure 5: Ascendent thoracic aorta. Figure 10: Bivariate scatterplot (B). Figure 6: Abdominal aorta. are not allowed to reject the hypothesis H B. Transversal sections represent a different viewpoint than longitudinal sections and their contributions to assessment of the elastin network complexity is not interchangeable. (C) The test result does not allow us to reject the hypothesis H C and the differences of SD in transversal and longitudinal sections should be regarded as not significant. (D) We do not reject the hypothesis H D. There are no significant differences between mean SF values from ventral and dorsal wall. They are correlated, R = 0.86 (E) We do not reject the hypothesis H E. Relative proportion of elastin does not differ between thoracic (37.59% in average) and abdominal (37.41% in average) aorta. Figure 7: Difference plot (A). Figure 8: Bivariate scatterplot (A). Figure 11: Elastin (black), collagen (green), smooth muscle (reddish to brown) in thoracic aorta. IFMBE Proc (1) ISSN: IFMBE 124
 We reject the hypothesis H F.")
 and abdominal (AA) porcine aorta.")
 Figure 13: Classifier learning data in RGB space. Quantity AA TA Mean±SD n Mean±SD n matrix [%] 2.0±1.0 24 2.0±1.0 24 SMC [%] 38.2±5.94 24 25.2±3.62 24 collagen [%] 23.0±3.77 24 36.2±2.")
127 The 3 rd European Medical and Biological Engineering Conference November 20 25, 2005 EMBEC'05 Prague, Czech Republic Figure 15: Intensity profile plot. The periodic minima of gray value correspond to intersections of the testing line with elastin. Figure 12: Pixels classified into three phases. (F) We reject the hypothesis H F. The lamellar unit is more thick (p = 0.03) in abdominal aorta (16.70 µm in average) than in thoracic aorta (16.10 µm in average). Table 1: Results of morphometry of thoracic (TA) and abdominal (AA) porcine aorta. (SD Standard Deviation, n number of samples, cross sections or micrographs, SMC smooth muscle cells, EV D external vessel diameter, IV D internal vessel diameter, WT wall thickness, LUT lamellar unit thickness.) Figure 13: Classifier learning data in RGB space. Quantity AA TA Mean±SD n Mean±SD n matrix [%] 2.0± ± SMC [%] 38.2± ± collagen [%] 23.0± ± elastin [%] 36.8± ± EVD [mm] 20.2± ± IVD [mm] 13.7± ± WT [mm] 2.10± ± LUT [µm] 16.1± ± Discussion Figure 14: Results of segmentation. The FFT was not able to discriminate between thoracic and abdominal aorta (HA), which was rather surprising [4]. However, this could be explained by the fact the samples came from young and healthy animals having no obvious reason for different morphology of elastin in thoracic and abdominal aorta. The FFT helps to assess the morphology of elastin network in porcine aorta morphology rather than different amounts of elastin. Although this paper deals with normal aorta only, it implies several possible ways to contribute to clinicalrelated research. We suggest that 2-D FFT-based assessment of elastin morphology could be applied to study of following problems. There could be compared the morphology of elastin between aortas fixed under diastolic pressure and systolic pressure-fixed aortas. Fourier transform is a suitable tool for describing varying degrees of complexity of IFMBE Proc (1) ISSN: IFMBE 125
128 The 3 rd European Medical and Biological Engineering Conference November 20 25, 2005 EMBEC'05 Prague, Czech Republic oriented and network-like structures. It is quite sensitive to straightening of elastin which is known to cause the power spectrum to become stretched in the vertical direction and squeezed in the horizontal direction. As a result, the high frequencies in the direction of the arterial circumference (y axis) decreased as did the shape factor [5]. When unpressurised, the elastin lamellae appear wavy and disorganized in longitudinal and transversal sections. With increasing pressure and distention, there is a progressive straightening of these lamellae and a decrease in the interlamellar distances. At the low end of the physiological pressure range, the lamellae are straight and give the appearance of regular concentric cylinders with uniform thickness and radial spacing [2]. In vitro elasticity and residual strain measurements were performed separately on the inner and outer half of the pig aortic media [10]. The reported possible an/isotropy of elastin morphology together with a histomorphometric assessment of the radial distribution of elastin could be verified. In a similar way, evaluation of rotational asymmetry of the elastin morphology in the abdominal aortic aneurysm [11] might contribute to the understanding of the location of preferential sites of aneurysm rupture. The FFT-based analysis could be used together with other microanalytical techniques as a complementary method in to maximize the information available from the specimen. The structure of elastin could be characterized in terms of textural features, using other stereological methods for quantitation of elastin alteration [12]. The technique described in this investigation requires highly standardized processing of tissue samples and hence is not readily applicable to routine use. Nevertheless, it is suitable for research purposes to study the effects of ageing, hypertension, atherosclerosis, and other conditions associated with changes of elastin. We presented an approach for description of the complexity and regional differences of morphology of elastin network in samples of thoracic and abdominal porcine aorta. Conclusions We presented an approach for describing the complexity and regional differences of morphology of elastin network in samples of thoracic and abdominal porcine aorta. Using the Fourier transform of the micrographs, we found no significant differences between paired shape factor values of thoracic and abdominal aorta. We found no significant differences between samples from ventral wall and dorsal wall of aorta. The FFT-based analysis provided us with reasonable results, therefore its further use can be recommended in case of respecting its limitations. We suggested several advisable applications of this method for elastin-related research. We assessed lamellar unit thickness and relative elastin content. Acknowledgements This work was supported by the project MSM and the project MSM awarded by the Ministry of Education, Youth and Sports of the Czech Republic. References [1] FAURY, G., PEZET, M., KNUTSEN, R.H., BOYLE, W.A., HEXIMER, S.P., MCLEAN, S.E., MINKES, R.K., BLUMER, K.J., KOVACS, A., KELLY, D.P., LI, D.L., STARCHER, B., and MECHAM, R.P. Developmental adaptation of the mouse cardiovascular system to elastin haploinsufficiency. J. Clin. Invest., 112: , [2] SHADWICK, R.E. Mechanical design in arteries. J. Exp. Biol., 202: , [3] AUGIER, T., CHARPIOT, P., CHAREYRE, C., RE- MUSAT, M., ROLLAND PH, and GARCON, D. Medial elastic structure alterations in atherosclerotic arteries in minipigs: Plaque proximity and arterial site specificity. Matrix Biol, 15: , [4] ROACH, M.R. and SONG, S.H. Variations in strength of the porcine aorta as a function of location. Clin Invest Med, 17: , [5] TONAR, Z., NEMECEK, S., HOLOTA, R., KO- COVA, J., and TRESKA, V. nd MOLACEK, J. Microscopic image analysis of elastin network in samples of normal, atherosclerotic and aneurysmatic abdominal aorta and its biomechanical implications. J Appl Biomed, 1: , [6] KOČOVÁ, J. Overall staining of connective tissue and the muscular layer of vessels. Folia Morphol, 18: , [7] 2-D FFT Matlab source. Internet site address: tonar/arch/2dfft.m. [8] Polar histogram Matlab source. Internet site address: tonar/arch/polhist.m. [9] ABRAMOFF, M.D., MAGELHAES, P.J., and RAM, S.J. Image processing with imagej. Biophot. Int., 11:36 42, [10] STERGIOPULOS, N., VULLIMOZ, S., RACHEV, A., MEISTER, J.J., and GREENWALD, S.E. Assessing the homogeneity of the elastic properties and composition of the pig aortic media. J Vasc Res, 38: , [11] TRESKA, V., KOCOVA, J., BOUDOVA, L., NEPRASOVA, P., TOPOLCAN, O., PECEN, L., and TONAR, Z. Inflammation in the wall of abdominal aortic aneurysm and its role in the symptomatology of aneurysm. Cytokines Cell. Mol. Ther., 7:91 97, [12] AVOLIO, A., JONES, D., and TAFAZZOLI- SHADPOUR M. Quantification of alterations in structure and function of elastin in the arterial media. Hypertension, 32: , IFMBE Proc (1) ISSN: IFMBE 126
129 ON MODELLING ARTERIES USING COMPOSITE MODEL OF SOFT TISSUE Eduard Rohan 1 ), Robert Cimrman 1) and Zbyněk Tonar 2) 1 ) 2) New Technologies Research Centre, University of West Bohemia, Plzeň, Czech Republic; Department of Histology and Embryology, Charles University Plzeň, Czech Republic. INTRODUCTION The arterial wall consists of three layers: tunica intima, tunica media and tunica adventitia. In this study we focus on the media, as it is the most important of the three from the mechanical point of view. The media of healthy elastic arteries is formed by elastin, collagen and smooth muscle cells which are distributed in spirals with a very small angle. Under the normal arterial pressure, the musle cells in the media produce only a basal tone which assists in reducing nonuniformity of strains and stresses in the wall. This effect is similar to that of the residual strains associated with the passive components. We consider three kinds of arterial prestraining: 1) residual strains in the isotropic matrix elastin; they are characterised by an artificial opening angle of the pseudo-arterial ring without fibres, 2) prestraining, or releasing of fibres which form circumferential elastic lamelae, 3) effects of the muscular tone which depends on the local strain and on the activation. The residual strains in healthy arteries have been studied e.g. in Rachev et. al. (1999) and Holzaplfel et. al. (2000) with reference to a natural configuration; this corresponds to the open sector (unstressed) which is obtained by cutting a thin arterial ring radially. The opening angle depends on the thickness and the radius of the ring (the position of a circumferential cut). COMPOSITE MODEL Analysing micrographs of soft tissue, the volume fractions can be determined for major tissue components (further assigned by α ), such as collagen, elastin, or muscle fibres. These fibrous components are responsible for anisotropy of the tissue. Therefore, it is important to determine also one, or more preferential directions for each component α and the associated volume fractions. Let N PFD be the total number of preferential directions for all components α =1, 2,..., N FC. We define the index subsets I α, so that NFC k { 1,..., N PFD} = U α = 1 Iα. By ϕ we denote volume fraction associated with preferential k direction ν. Denoting by ϕ m the volume fraction of the amorphous matrix, we have N FC k ϕ ϕ = 1. (1) m + α = 1 k Iα We assume that any interpenetration of the components is negligible, so that a unique field of displacements is considered. It possesses a unique macroscopic strain field; denoting by E ij the Green-Lagrange strain tensor, we define the projected strain for each k = 1,..., N : PFD k k k ε = Eij ν i ν j, no sumation over k. (2) k k Using ε we can define tension τ in the axis of the k-th component. In general, the constitutive law depends on internal variables χ,, 1 χ 2... and activation parameters a,, 1 a2... (in muscle fibres). Thus, for the component associated with the k-th direction the corresponding 2nd Piola- Kirchhoff stress is given by k k k = ν i ν j τ,where k k k k τ = f ( t, ε, & ε, { χ}, { a} ), (3) k Tij where t is time and ε& is the strain rate. If k is associated with a collagen fibre, then f k is introduced as a visco-elastic response, involving one internal variable. If k is associated with a muscle fibre, then one, or more activation parameters a, a 1 2 must be defined as functions of time t. The amorphous matrix of the tissue can be described as a hyperelastic material. The effective part of the stress S m ij is defined using energy function m m m W ( Eij ), i.e. Sij = W / Eij. The assumed incompressibility of all tissue components yields a unique pressure field p. By virtue of the mixture theory the total 2nd Piola-Kirchhoff stress in the tissue is S ij = J C 1 ij p + W m NFC k k ϕ m + ϕ Tij, (4) Eij α = 1 k Iα
130 where C = 2 + δ and J = ( detc ) 1/ 2. ij E ij ij ANALYTICAL MODEL OF THE MEDIA We shall assume that the distribution of elastin, collagen and smooth muscle is homogeneous, so that the deformation problem for the arterial wall is axisymmetric. The reference configuration Ω 0 of ij R i the media is a segment of the tube with inner and outer R e radii, the angle of opening (w.r.t. the axis) is 2π 2Θ, which corresponds to the first kind of prestraining, as mentioned above. A point position in Ω 0 is referred by ( R,Φ, Z ). Denoting by r the radial position in the deformed (loaded) configuration Ω occupied by the closed artery, the circumferential stretch is given as λ φ = ω r / R, and the radial one is given by (using the incompressibility assumption) = ( ) 1 r λ λz where ω π / Θ λ φ, = and λ z is the axial stretch. We can find such a prestraining of the wall, that for a given arterial pressure the circumferential Cauchy stress is uniform. Given a Θ, characterising the domain Ω 0, we solve an inverse problem to find the prestraining of elastin lamelae, which in our simplified model are represented by circumferential and longitudinal fibres. The true tension in these fibres is defined as (see (3)) k k k τ max{ 0, S( ε η )}, k = φ, z =, (5) where S is a (nonlinear) elastic response function, k k η is the prestraining parameter. If ε = 0, then k k k k τ = 0 for η 0 and τ > 0 for η < 0. Here for simplicity we do not treat the collagen. First we assume, that the muscle cells are not activated. The equilibrium equation σ σ r σ r + r r φ = 0 with the constraint written as (6) σ σ = const can be φ = φ p( r) p( r) f ( r) f ( r) + = +, where (7) r r r r m 2 W ω r ρω f ( r) = ϕm σ φ. Err λz ω r Solving (7) we obtain the pressure p ( r) = C 1 + f ( r), (8) r where C is a constant obtained by applying the boundary condition σ r ( ri ) = Pi. Thus the hydrostatic pressure in the matrix is p m 2 ( ) = ri W ω r ρω r ( P + σ φ ) + ϕ m σ 2 2 φ r E λ ω r 2 i, (7) 2 2 where ρ ω = ω ri R i. From σ r ( re ) = Pe we obtain the deformed inner radius A P e+ σ φ r i = κ, κ, (8) 2 1 κ P + σ i 2 2 where 0 < 1 A R e R i /. If we φ φ define η i = η ( r i ), we can compute the deformed radius r i using (8) noting that σ φ can be written as the function of r i. Then σ φ is φ evaluated and the desired prestraining η ( r) follows from (5). In the results that follow we used λ = 1 and the following constitutive equations z < κ and ( ) ω rr φ μ 2 2 ( 2/ λ φ λ 1) σ r = p + 3 φ, (9) μ 2 2 σ φ = p + ( 2λφ 1/ λφ 1) Eφ λφ ( λφ 1) ηφ + τ act 2 (10) μ 2 2 σ z = p + ( 2 λφ 1/ λφ ) + E z ( ηz ), 3 (11) where τ is the tension in muscle fibres. In act physiological conditions smooth muscle fibres are activated to generate a basal tone. For the static stress analysis the muscular tension can be defined in the simple form (the 2nd Piola-Kirchhoff stress) 1 τ = ( λ ) act a f φ λφ, (12) see [3], where 0 f ( λ ) 1 φ, expresses capability of generating force depending on the stretch of muscle cells; a 0 is the nominal active tension. φ For a given a, the optimal η ( r) can be computed by the procedure sketched above, z
 Also the fibres in the longitudinal direction can be z prestrained (with η ( r) ), so that for a given uniform axial load σ z 1 μ 1 2 ηz = 2 λ p σ z E.")
131 η ( r) φ 1 = E φ 2 ωr ρω 2 2 τ ω r ω 1 + ρω ωr ρ ω r ω 2 act 1 ( r) + μ ω + ω ( P + σ ) i φ r i r ω r ωr ρ ω (13) Also the fibres in the longitudinal direction can be z prestrained (with η ( r) ), so that for a given uniform axial load σ z 1 μ 1 2 ηz = 2 λ p σ z E. (14) 2 φ z 3 λφ In order to illustrate effects of the complex prestraining we consider a vessel with R e / R i = 1.5, ω =1. 3, the neo-hookean matrix with eff. shear modulus 20 kpa and the linear elastic fibres with eff. modulus 28 kpa. The arterial pressure is kpa. In Fig. 1 we illustrate, how the prestraining of elastic fibres (for which σ φ = const ) changes with increasing activation a. The residual stresses in the wall of the open sector are introduced in Fig. 2 for the nominal active tension 5 kpa. The circumferential cut at the middle of the thickness results in further deformation and release of the total stresses, see Fig. 3. Figure 1: Left: tensions in passive and active fibres for a=0,5,10,15 kpa. Right: the prestraining. Figure 2: Residual stresses in open arterial sector; left: inactive, right: activated muscle. RESULTS Figure 3: Effects of residual stresses in open sectors with circumferential cuts; circles depict the loaded configuration, uniform circumf. stress. EXPERIMENT We collected six aortae of the young male and female pigs and we took away 1 cm high ringlike samples of the ascending thoracic part and of the descending abdominal portion. Without any fixation, the wall of the samples was cut longitudinally. We measured the opening angle determinated by the cutting edges and the geometric centre of the vessel, see Figure 4. The measurement was done within 3 hours after the slaughter of the animals, so we suppose that the tissue was not altered by postmortem autolysis. From the same localization another tissue samples were taken for the histological analysis. They were fixed with 10% formaline and cut to 5-7 micrometers thin slides. The slides were stained by green trichrome method modified with Verhoeff's hematoxylin so that the elastin fibres appeared black, the collagen fibres were green and the smooth muscle cells were reddish. The colour photomicrographs were taken at the standard magnification, then

![8 1.4 1.6 Opening angle [deg] 19 25 25 23 Elastin [%] 32 39 25 35 Collagen [%] 29 36 29 35 SMC [%] 32 40 37 48 Table 1. Experimental results. Figure 4: Opening angle of artery.](/docs-images/103/159708864/images/132-1.jpg "With regard to the aim of our study, we focussed especially on the elastin in the tunica media.")
132 digitized (see Figure 5) and analyzed in an image processing software in order to gain the proportions of the cardinal constituents of the arterial wall. Thus, we obtained the input data required to tune the composite model, Table 1. Aorta: Thoracic Abdomina l Inner diameter [cm] Wall thick. [mm] Media thick. [mm] Opening angle [deg] Elastin [%] Collagen [%] SMC [%] Table 1. Experimental results. Figure 4: Opening angle of artery. With regard to the aim of our study, we focussed especially on the elastin in the tunica media. The bundles of the elastin fibers are arranged as a system of concentric lamellae with countless fine interconnections. Due to this structure of the tunica media, the aorta is regarded as an "artery of elastic type", whose cardinal task is to absorb partially the energy of the systolic period of pulsatile blood flow and return it back during the diastole. The sufficiency of the aortic wall to perform this task depends mainly on integrity of the elastin network; the destruction of the elastin leads inevitably to the development of an aortic aneurysm. According to our microscopic observation, the bundles of the elastin fibres do not have uniform thickness across the whole diameter of the aorta. The innermost elastin fibres, i.e. under the tunica intima, are rather fine, unlike the coarse elastin fibres near the outer tunica adventitia. As the image analysis of the photomicrographs shows, the thoracic part of the aorta contains more elastin fibres than the abdominal segment. The closer towards the periphery of the arterial system, the lower proportion of elastin and the higher percentage of smooth muscle cells can be found in the aortic wall. Figure 5: The elastin fibres in thoracic (left) and abdominal (right) porcine aortae. The length of the scale bar is 0.3 mm. Therefore we presume that in the aorta the residual strain in the extracellular martix (i.e. mainly in elastin fibers) is much more important for the proper function of the arterial wall than the tone of the smooth muscle cells. On the contrary, in the periphery of the arterial system, where the proportion of elastin decreases rapidly and the smooth muscle prevails, the tone of the muscle tissue plays the main role in controlling the diameter of the artery and the peripheral arterial resistance. SUMMARY The composite model can describe anisotropy and prestraining of arterial walls. The residual strains in the matrix can be identified using opening angle measurements with further assumptions on residual strains in passive and active fibres. REFERENCES Rohan E, Cimrman R. (2000) Sensitivity analysis and material identification for activated smooth muscle. In Proc. of the Conf. Numerical Methods in Continuum Mechanics 2000, Liptovský Ján, Slovak Republic (CD-ROM, also to appear in CAMES). Rachev, A, Hayashi, K (1999) Theoretical study of the effects of vascular smooth muscle contraction on strain and stress distribution in arteries. Annals of Biomed. Engrg., (27): Holzapfel G, Gasser T, Ogden R. (2000) A new constitutive framework for arterial wall mechanics and comparative study of material models. Jour. of Elast. (61): 1-48 ACKNOWLEDGEMENTS The research was supported by the project LN00B084 of The New Technologies Research Centre, University of West Bohemia, Plzeň
133 Computer Methods in Biomechanics and Biomedical Engineering, Supplement ,71-72 SB Numerical and experimental aspects of arterial wall modelling L, DEMJANCUKOVAtt E. ROHANt. O, BOIRON+ and Z. TONAR+1 tdepartment of Mechanics, Faculty of Applied Sciences, University of West Bohemia in Pilsen, Czech Republic tequipe de Biomecanique Cardiovasculaire, IRPHE, Marseille, France Ilnstiluie of Histology and Embryology, Faculty of Medicine. Charles University in Pilsen, Czech Republic 1. Introduction The arterial wall is a complex structure made of several concentric layers. The middle layer, called media, is the thickest one in elastic arteries. It consists of a complex 3D network of smooth muscle cells, elastin and collagen fibrils embedded in extracellular substance. In the present article, we use the complex maeroscopic, fibre-reinforced one-layer 3D model of the elastic arterial wall (Rohan and Cimrman 2004) and we demonstrate some numerical examples based on morphometric data. the bulk tissue (K the bulk modulus). Then the second Piola- Kirchhoff stress in the media tissue is given by with the matrix volume fraction tp'*\ the fibrous volume fractions ^""^(superscript a denoting active fibres and/ the passive ones), so that (p'" + (p" + tp^ = 1. We denote J the Jacobian of the deformation gradient, C,j the right Cauchy^Green deformation tensor, fi the shear modulus, and T,j comprises the tensions in fibrous components. 2. Model Composite macroscopic model has been originally introduced by Rohan & Cimrman to describe the macroscopic highly anisotropic mechanical properties of smooth muscle (Rohan and Cimrman 2002, 2004), The proposed model is homogenized, reflecting at any point in the material properties of the solid, the bulk behaviour of the microstructure. We suppose that the wall of elastic artery can be described by one-layer model representing the media of the arterial wall. We consider tbe media made of three basic components: the active fibres. representing bundles of smooth muscle cells, embedded in the amorphous phase called tbe matrix that is reinforced by the passive fibres, i.e. the collagen and elastin fibres. The amorphous matrix is described by the neo- Hookean hyperelastic material. Four preferential directions are defined for the fibrous components: two helicoidal directions with the mean angle a for the active fibres followed by collagen fibres, and the circumferential and longitudinal elastin fibres. Finally, a unique tbermodynamic pressure field p = - K{J - I) is included corresponding to the near incompressibility of 3. Morphometry and nnmerical simulations In order to identify the proportional representation of the collagen and elastin fibres and of smooth muscle cells, as well as the maximal diameter of the vessel and the thickness of the wall, the specimens of thoracic and abdominal porcine aorta underwent both microscopic and macroscopic morphometry. The results of morphometry indicate that passing from thoracic to abdominal segment of porcine aorta, the percentage of collagen and smooth muscle cells changes significantly while the proportional representation of elastin fibres remains approximately unchangeable, see table I. Table I, matrix smooth muscle cells collagen elastin Percentage of main constituents of arterial wall based on the morphometry. Thoracic aorta (%) Abdominal aorta (%) 2,0 38, ,6 Computer Methods in Biiimechanics and Biomedical Engineering ISSN lo2.'i-5842 prim/issn online 2()O5 Taylor & Francis hltp;//www,tanilf.co,uk/joumals DOI: IO,1O8O/IO255841}
134 72 L. Demjancukova et al. 4. Conclusion Numerieal simulations of dynamic finite deformation of arterial wall were presented using the morphometric data. A further work will be focused on validation of numerical computations. References Figure 1. Defoniialion of artery in the sense of Ihe norm of displacemeni u for the thoracic aorta data. E. Rohan and R. Cimrman, "Sen.sitivity analysis and material identification for activated.smooth muscle". Comp. Mech. & Eng. Sfi..9. pp E. Rohan and R. Cimnnan. "Coupled flow-structure model for simulation of peristalsis in ureter". Biomech. Man Czech Republic, on CD-ROM Z. Tonar. et al.., "Morphology of elastin network in thoracic and abdominal porcine aorta". Biomech. Man 2004, Czech Republic, on CD-ROM Due to the assumed axial symmetry, only one half of a cylinder was used to model the artery in our numerical simulations, see figure I. 132
 that has small duration time (50 ms).")
135 $622 Journal of Biomechanics 2006, Vol. 39 (Suppl 1) Poster Presentations waves shows the possibility for new therapy. In our previous investigations, it was found that all of cells are not disintegrated by high shock wave (0.5 MPa) that has small duration time (50 ms). So it is expected that the elastic cells such as endothelial cells, cardio cells have a potential to regenerate or growth fast by using high pressure and short duration time from 1 micro s to 100ms. It is reported that the angiogenesis is enhanced by focused shock wave. There are two mechanism for this, one is effect pf shock wave and the other is effect of cavitation bubbles. Thus, it is necessary to distinguish the effects of the plane shock wave from the cavitation bubbles near cells appeared in focused shock wave field. In this paper, to investigate the effects of plane shock waves on the endothelial cells in vitro, the cells worked by shock waves are observed by microscope and the growth rate and others are measured by image processing. We have two boundary conditions for the shock wave tests. One is suspended cell, the other is fixed cell on the culture dishes. The feature of the shock tube apparatus is that (1) the propagating wave is plane and (2) the duration time is long (several 10ms) compared with laser shock wave and focusing shock wave. The peak pressure in the pressure history in water at the test case is 0.4 MPa. After working shock waves on suspended cells and fixed cells, the disintegration, shape, growth and gene were investigated. It is concluded that once shock waves worked, some of them are disintegrated, but the other has capacity to increase growth rate of cell culture in vitro. The growth of cells by plane shock waves is also confirmed by the fact that activated gene expression is enhanced Vascular Wall Mechanics 5151 Mo-Tu, no. 82 (P66) Mechanical testing for the evaluation of arteries compressibility S. Celi, E Di Puccio, P. Forte. Department of Mechanical, Nuclear and Production Engineering, University of Pisa, Italy A well-established assumption in the mechanical behaviour of arteries, as well as of most of the biological tissues, is their incompressibility, e.g. [1,2]. Although experimental evidence has shown a nearly compressible behaviour in [2,3], the incompressibility assumption is commonly accepted maybe because it simplifies both the experimental and analytical description of the tissue mechanics, having important consequences in the numerical description of its constitutive law. In this study the compressibility of porcine arteries is investigated by means of a simple apparatus for pressure-diameter testing described in [4]. The apparatus is provided with two graduated capillary tubes which detect the artery outer and inner volume variations. The sample have been pressurized up to 1 atm by means of an angioplasty syringe; a drop of mercury inside the inlet tube works as a slider to measure the inner volume variations. Preliminary calibration tests have been carried out to evaluate the stiffness of the apparatus and the effect of the air dissolved in the solution. Seven samples of porcine renal artery were used, and the percentage volume variation evaluated for each pressure level of the loading cycle obtaining 140 values, (scattered between -24% and 2%), having a mean value (over the whole range of pressure) of 4.69% and a standard deviation of 5.6%, in partial agreement with [5]. References [1] Carew T.E., Vaishnav R.N. and Patel D.J. Compressibility of the arterial wall. Circ Res. 1968; 23: [2] Fung Y.C. and Chuong C.J. Compressibility and constitutive equation of arterial wall in radial compression experiments. J. Biomech. 1983; 17(1): 1984, p [3] Misra J. C. and Chakravarty S. Study of incompressibility in vascular rheology, Rheol Acta 1980; 19: [4] Di Puccio E, Forte P. Mastrullo A. Experimental compliance evaluation of arterial segments for angioplasty simulation. ICEM12, pp , Italy [5] Tickner E.G., Sacks, A.H. A theory for the static elastic behaviour of blood vessel. Biorheology 1967; 4: Mo-Tu, no. 83 (P66) Composite model of healthy arterial wall: material identification based on uniaxial traction tests and morphometric analysis L. Demjan~ukov~ 1,2, E. Rohan 1, R. Cimrman 1, J. Polansk~ 2, Z. Tonar 1, O. Boiron 2. 1Department of Mechanics, Faculty of Applied Sciences, University of West Bohemia, Pilsen, Czech Republic, 2Equipe de Biom~canique Cardiovasculaire, IRPHE, Marseille, France During a cardiac cycle, the radius of an elastic artery may undergo a variation of about 10% so that the arterial wall is subjected to relatively large deformation. This deformation may change the orientation of fibrous components included in the arterial wall and leads to interaction between the wall microcomponents. Thus the macroscopic properties of the tissue may change entirely. Hence, in order to describe properly the mechanical behavior of healthy arterial wall, we employ the fibre reinforced composite macroscopic model. According to the histological analysis of healthy arteries, the solid mechanical properties of the arterial wall are determined primarily by the tunica media and the tunica adventitia. Consequently, we model the elastic artery as a two-layer thick-wall cylindrical tube where each layer is treated as a composite of two constituents: the passive fibres (representing the collagen or elastin fibres) embedded in the isotropic matrix (representing other constituents including the extracellular substance). This mathematical model involves many constitutive parameters which must be identified using experimental results of a macroscopic specimen of the healthy artery. The proportional representation of the basic components in terms of volume fractions (also the elastin length density, the diameter of the aorta and the thickness of the wall) were determined using both microscopic and macroscopic morphometry of the tissue samples. In order to find the constitutive parameters, quasi-static uniaxial traction tests of samples from porcine aorta were performed. Methods based on optimization are adopted to the material identification. Finally, we demonstrate the results of our numerical tests. References Rohan E., Cimrman R. (2002). Sensitivity analysis and material identification for activated smooth muscle. Comp. Assisted Mech. and Engrg. Science 9: Holzapfel G.A. (2006). Determination of material models for arterial walls from uniaxial extension tests and histological structure. J. Theoretical Biology 238: Mo-Tu, no. 84 (P66) The effect of SNP and Isoptin on viscoelastic characteristics of rat aorta in vitro P. Antonov 1, M. Antonova 2, N. Antonova 3, L. Kasakov 2. 1National Cardiology Hospital, Sofia, Bulgaria, 2Institute of Physiology, Bulgarian Academy of Sciences, Sofia, Bulgaria, 3Institute of Mechanics, Bulgarian Academy of Sciences, Sofia, Bulgaria The method of sinusoidal excitation of intralumenal pressure (p) [1] was employed to study viscoelastic characteristics (VEC) of rat aorta in vitro prior and after 50~tM sodium nitroprusside (SNP) and 10, 30 and 50~tM Isoptin hydrochloride (Is). The frequency of excitation (fexc) was sweeped from 3 to 30 Hz up and down. The resonance curve was plotted by volume response oscillations and used for estimation of VEC natural frequency (f0), dynamic modulus of elasticity (E') and coefficient of viscosity (15). It was found that the resonance curves were different whenever increasing or decreasing fexc when the decreasing fexc frequency was being shifted to the right. This contrasted our previous data for rat aorta strips preparations in which both curves coincided. VEC values were higher for cylindrical than for the strip preparations. Our E' values were similar to these obtained by other authors (human [3,4], dog [5]). The results showed that f0 decreased linearly, E' increased nonlinearly and 15 increased linearly with p. The SNP and Is induced relaxation led to the independence of f0 from p. The values of E' increased significantly which verified the failure of distensibility. The 15 values increased significantly only at higher pressure. The multitude of VEC might be useful for a better understanding of the effect of vasoactive drugs on biomechanical properties of the blood vessels wall. References [1] Antonova M., Kasakov L. Compt. Rend. Acad. Bulg. Sc. 1999; 52(9-10): [2] Antonova M., P. Antonov, G. Marinov, L. Kasakov. Med. Eng. Phys. In press. [3] Gozna E.R., Marble A.E., Shaw A.J., Winter D.A. Cardiovasc. Res. 1973; 7: [4] Lang R.M., Cholley B.P., Corcarz C., Marcus R.H., Shroff S.G. Circ. 1994; 90(4): [5] Armentano R.L., Barra J.G., Levenson J., Simon A. and Pichel R.H. Circ. Res. 1995; 76(3), Mo-Tu, no. 85 (P66) Beat to beat assessment of common carotid artery stiffness by noninvasive measurement T. Lyyra-Laitinen, J. Vanninen, T. Laitinen. Department of C/inica/Physiology and Nuclear Medicine, Kuopio University Hospital, Kuopio, Finland Noninvasive measurement of common carotid artery stiffness has been traditionally made by ultrasound imaging based measurement of pulse pressure induced artery dilatation. Furthermore, blood pressure has been typically measured from the upper arm by sphygmomanometer before and after ultrasound imaging. Our aim was to develop a noninvasive beat to beat measurement of arterial stiffness. Study population consisted of 10 subjects aged years. We acquired by computer simultaneously ultrasound images (25 frames/second) of common carotid artery in longitudinal projection, ECG and continuous blood pressure using volume clamp method (1000 samples/second both). An automated neural network based edge detector was used in analysis of arterial near and far wall positions and, thus, artery diameter frame by frame. R-peaks of ECG 133
136 134
137 Simulations in Biomedicine 25 On coupling cellular automata based activation and finite element muscle model applied to heart ventricle modelling R. Cimrman, J. Kroc, E. Rohan, J. Rosenberg & Z. Tonar New Technologies Research Centre, University of West Bohemia, Plzeň, Czech Republic Abstract The paper deals with the finite element macroscopic model of contracting myocardium. The constitutive model of the tissue is based on the theory of mixtures, involving a simple model of intramyocardial blood perfusion. Anisotropy of the tissue is described in terms of preferential directions of the muscle and connective fibres. A simple Hill-type model of the muscle fibre contraction is employed. The local value of the activation parameter is defined through the four phases of the action potential wave; its propagation is simulated using the cellular automaton (CA). The approximated excitable medium, which comprises the conducting system, is partitioned into the normal, conducting and void cells. The coupling of the CA analysis with the FEM model of the heart mechanics is discussed. Introductory numerical examples are included, describing contraction of the dog heart. 1 Introduction The aim of this paper is to present a computational model of the excitable myocardial tissue. Although this topic has become a subject of intensive research in recent decade, cf. [7, 1, 3], the existing models usually do not capture the complexity of the phenomena which feature modelling of the myocardium mechanics. For realistic simulations of heart beats it is important to treat not only the 3D geometrical structure of the cardiac muscle fibres, but also a relevant model of the excitable medium. In our approach the latter is based on the cellular automaton (CA) which is employed to describe spatial propagation of the depolarization wave. The CA is coupled with FE model of the deformable ventricles. 135
138 26 Simulations in Biomedicine The CA FEM coupling is tested in a simulation of deforming dog-heart ventricles. So far in our model we have considered only a static, spatially uniform pressure load of the ventricles and computed the CA response to define activation of the muscle fibres in time over the 3D geometry. For a more genuine description of the heart beats the fluid flow problem inside the ventricles should be considered as well as a correct interaction of the blood with the ventricular walls. This, however, is beyond purpose of this study which should show only viability of the approach presented. 2 Structure and functions of the myocardium Cardiac muscle is the striated type of muscle tissue with contractile myofibrils regularly arranged in the form of sarcomeres, cf. [4]. The ventricular muscle is arranged into three systems of fibres. Whereas the inner and outer layers are thin muscle membranes, the middle layer consists of locally parallel muscle fibres that are organized into twisted sheets immersed in the collagenous matrix. The electrophysiological discontinuity between the atrial and ventricular myocardial masses is ensured by the fibrous skeleton, which also serves as a stable but deformable base for the attachments of the muscle fibres. 2.1 Excitatory and conductive system of the heart The heart is endowed with a special system for generating rhythmical impulses and conducting these impulses rapidly throughout the heart. Its elements are derived from cardiac muscle cells containing few contractile fibrils and they exhibit selfexcitation with inherent rhythmicity and varying rates of conduction. The conduction velocities are shown in Table 1. The sinus node displays self-excitation acting as a normal pacemaker. Then the impulse is conducted to the atrioventricular (A-V) node, where the action potential (AP) wave from the atria is delayed before passing into the ventricles. This delay allows the atria to empty their contents into the ventricles before ventricular contraction begins. The A-V bundle, conducting the impulse from the atria into the ventricles, admits only forward conduction, preventing re-entry of cardiac impulses by this route from the ventricles to the atria. The left and right bundle branches and the system of large subendocardial Purkinje fibres conduct the impulse immediately to all portions of the ventricles, thus, preserving synchronous contraction required for the effective pressure generation. Cardiac muscle is refractory to restimulation during the AP wave, when a normal cardiac impulse cannot re-excite an already excited muscle area. The absolute refractory period of the ventricle is s, which is about the duration of the AP. During an additional relative refractory period of about 0.05 s, the muscle is excitable by a supranormal impulse only. 136
139 Simulations in Biomedicine 27 Table 1: Conduction velocities of the action potential in the heart [4] Part of the conducting system Velocity of conduction [m.s 1 ] atrial muscle and internodal pathways A-V node and penetrating A-V bundle left/right bundle branches and Purkinje fibres ventricular muscle Excitation-contraction coupling and function of calcium ions The action potential initiates release of Ca 2+ ions from the sarcoplasmic reticulum and their diffusion from the T tubules, thus enhancing the contraction power. The Ca 2+ ions diffuse into the system of myofibrils and catalyze the chemical reactions in the troponin-tropomyosin complex that promote sliding of the actin and myosin filaments along one another; this produces the muscle contraction. At the end of the plateau of the AP, the influx of Ca 2+ to the interior of the muscle fibre is suddenly cut off, and the Ca 2+ ions are rapidly pumped back from the sarcoplasm. As a result, the contraction ceases until a new action potential occurs. 3 Macroscopic model of the heart tissue 3.1 Application of the mixture theory approach A detailed description of the heart tissue mechanics from the sub-microscopic to macroscopic scales is beyond our capabilities; such a model would be too complex and, thus, expensive to be used for practical simulations. The model presented below reflects main anisotropic features of the tissue, which can be observed by a standard analysis of micrographs. In this way volume fractions can be determined for major heart tissue components which form the tissue fibrous skeleton and connective tissue matrix. These fibrous components are assigned by α; they are responsible for anisotropy of the tissue. Therefore, it is important to determine also one or more preferential directions for each component α and the associated volume fractions. Let N PFD be the total number of preferential directions for all fibrous components α = 1, 2,, N FC. We define the index subsets I α, so that {1,..., N PFD } = N FC α=1 I α. By φ k we denote a volume fraction associated with the preferential direction ν k. Denoting by φ m the volume fraction of the amorphous matrix, we have φ m + N FC α=1 k I α φ k = 1. (1) We assume that any interpenetration of the components is negligible, so that a unique field of displacements can be considered. It possesses a unique macro- 137
140 28 Simulations in Biomedicine scopic strain field; denoting by E ij the Green-Lagrange strain tensor, we define the projected strain for each k = 1,..., N PFD : ɛ k = E ij ν k i ν k j, no summation over k. (2) Using ɛ k we can define tension τ k in the preferential direction of the k-th component. In general, the constitutive law depends on internal variables χ 1, χ 2,... and activation parameters a 1, a 2,... (in muscle fibres). Thus, for the k-th component the corresponding 2nd Piola-Kirchhoff stress is given by T k ij = ν k i ν k j τ k, where τ k = f k (t, ɛ k, ɛ k, {χ}, {a}), (3) where t is time and ɛ is the strain rate. If k is associated with a collagen fibre, then f k is introduced as a viscoelastic response, involving one internal variable. In our model we employ the three parametric model of the standard solid element with a nonlinear elastic response. If k is associated with a muscle fibre, then one, or more activation parameters a 1, a 2 depend on the local value of the excitation wave. The muscle contraction force can be described using the sliding cross-bridge theory with approximation of the distribution moments, cf. [10]. In this case (3) involves three internal parameters χ 0, χ 1, χ 2 which correspond to the 0th, 1st and 2nd moments of the crossbridge distribution; these obey the differential equations χ l = g l (ɛ, ɛ, a, {χ 0, χ 1, χ 2 }), l = 0, 1, 2, (4) where ɛ is the projected strain (2). Thus, {χ} are associated with the particular preferential direction. In this study we use a model of the Hill type, which does not involve internal variables and, thus, cannot describe fading memory effects. The generated tension τ of (3) is defined as follows: { ( ) } 2 ɛ εopt τ(ɛ, ɛ, F a ) = η ɛ + F a Fmax exp exp{κ min{0; ɛ} }, (5) s where s determines the sensitivity of the actin-myosin overlaps with respect to difference of deformation ɛ and the optimal deformation ε opt, κ relates to behaviour while shortening and η is a viscosity coefficient. For more information about this and similar models, see [8]. The value of the activation parameter F a [0, 1] should correspond to a propagation of an action potential in heart. This can be done using e.g. the Fitz-Hugh Nagumo equations, or using the theory of cellular automata, see Section 4. The amorphous matrix of the tissue can be described as a hyperelastic material. The effective part of the stress Sij m is defined using energy function W m (E ij ), i.e. Sij m = W m / E ij. A unique thermodynamic pressure field p corresponds with (in)compressibility of the bulk tissue. In the next section we discuss the blood 138
141 perfusion problem where p acts as the intramyocardial pressure. By virtue of the mixture theory the total 2nd Piola-Kirchhoff stress in the tissue is S ij = JC 1 ij p + φ W m N FC m + E ij α=1 k I α φ k T k ij, (6) where C ij = 2E ij + δ ij is the right Cauchy-Green deformation tensor and J = (detc ij ) 1/2. The model enables that at any material point both the passive and the active fibres can be defined in several preferential directions, as required in accordance with the histological observation. The fibres are defined to have no stiffness opposing their compression, which corresponds to the buckling phenomenon of fibres dispersed in the matrix at the microstructure. It amplifies anisotropy of the composite, making the difference between tension and compression. As another consequence it allows for describing creep and relaxation of unloaded viscoelastic fibres when the matrix is being compressed in the direction of the fibres. 3.2 Intramyocardial blood perfusion Simulations in Biomedicine 29 The blood perfusion of the myocardial muscle presents the most important source of the energy which is needed for muscle fibres to contract and, thus, to pump the blood. The perfusion is maintained thanks to the coronary arteries which form a network branching in the epicardium and entering the deeper layers. Neglecting the hierarchical structure of the intracoronary system, here we shall consider only a crude approximation of the perfusion which is based on the macroscopic Darcy s flow, see [1]. Using this approach, however, we should be able to account for the periodic changes of the bulk volume of the myocardial tissue, as dependent on shrinkage and distension processes during one cardiac cycle. The local compression of the myocardium can be a measure of the blood supply. In consequence, this can be used as a feedback which influences the local propagation of the activation wave. The apparent perfusion velocity w i depends on the gradient of the intramyocardial pressure ( ) 2 p J 1 w i = K ij, K ij = kδ ij + 1, (7) x j N f where k is the permeability, and N f the porosity, [1]. The local conservation of mass is expressed as u i + w i = 0 in Ω(t), (8) x i x i where u i is the material derivative of the displacements. In order to write (8) in the weak form, the boundary conditions for p, or p/ x i must be specified. On the epicardium the blood can be squeezed out to the coronary system (or sucked in), p = p 0 on Ω epicard ; p 0 should correspond to the venous pressure. As no blood is assumed to seep into the ventricle, or through the basement, p/ x i = 0 on 139
142 30 Simulations in Biomedicine Ω\ Ω epicard. After transformation to the reference domain Ω(0) and using some other manipulations we obtain the weak formulation Ω(0) J q dx + Ω(0) K ij p X j q X i dx = 0, q Q(Ω(0)), (9) where Q(Ω) = {q H 1 (Ω) q = 0 on Ω epicard }, J = J(C 1 ) ij Ė ij and the transformed permeability tensor is K ij = k J(C 1 ) ij ((J 1)/N f + 1) 2. Here (9) replaces the usual incompressibility equation which is comprised in the mixed formulation for computing the displacement and pressure fields. 3.3 FE discretization and the energy conserving scheme In this scheme [2] the quantities are evaluated at a mid-point m between the time levels t 1 (known) and t (unknown). We denote a quantity at times t 1, t by X 1, X 2 respectively. Thus X m = w 1 X 1 + w 2 X 2, w 1 + w 2 = 1, w 1 [0, 0.5]. By setting w 1 < 0.5 a numerical dissipation, which stabilises the solution, is introduced into the system. The finite element approximation of displacements and the pressure is given by u χ T u, p ψ T p respectively, where χ and ψ are the Galerkin basis functions. In this paragraph we employ the following notation: F the deformation gradient, J = detf, s the 2 nd Piola-Kirchhoff stress tensor in vector form, G c the pressure gradient operator, C the right Cauchy-Green tensor in matrix form, M the mass matrix, δ u E m (u m ; v m ) = B m v m the gradient of the Green strain. Using this notation, we can write the discrete equilibrium equation in the mid-point m (omitting any loading terms for brevity): g m := Ω 0 ( ) Bms T u2 u 1 m dω + M = 0, (10) t h m := (J 1 J 2 )ψ dω t G T K c 1 G c dω p 2 = 0. (11) Ω 0 Ω 0 Above we have replaced J of (9) by (J 2 J 1 )/ t and related K ij to step t 1 to simplify the tangent matrix. The tangent linear system of the Newton method then attains this form (using u 2 2(u 2 u 1 )/ t u 1 ): ( K t,m + 2 t M 2, R m P m, td ) ( δu δp ) = ( g m,old h m,old ), (12) where K t,m is the usual tangent stiffness matrix, R m = g m / p 2, P m = h m / u 2 and D is the bracketed term of (11) (= h m / p 2 ). We set u 2,new = u 2,old + δu, p 2,new = p 2,old + δp and iterate until convergence is achieved. 140
 Simulations in Biomedicine 31 In the mathematical model of muscle fibres, the tension generated by these fibres depends on one, or more, activation")

143 4 Modelling propagation of the excitation wave 4.1 Simulation by the cellular automata (CA) Simulations in Biomedicine 31 In the mathematical model of muscle fibres, the tension generated by these fibres depends on one, or more, activation parameters (functions of space and time), which have to be specified as an input. For simulations of complex problems, such as the myocardium contraction, these parameters must vary, as the activation propagates, reflecting the chemical and other processes in the tissue. A suitable modelling tool fitted for this purpose seems to be provided by the theory of cellular automata (CA), cf. [6, 9]. The concept of CA was developed already by John von Neumann in In fact, CA are discrete dynamic systems useful for simulations of complex problems, where a classical formulation in terms of (partial) differential equations is too difficult or does not exist. CA model discretizes space into three dimensional (3D) lattice of cubes. Cubes, i.e. elements of this lattice, are called cells. Every cell has defined a neighbourhood usually a list of nearest neighbouring cells and the cell itself that is uniform through the whole lattice. Every cell contains a list of variables, e.g. state, morphology, etc. Morphology is divided into three different classes: conducting system, muscle, and the SA node. The evolution of the system is driven by a transition rule that computes new values of variables using values of cells laying in the neighbourhood of given cell from the previous CA step. Generally, the transition rule can be split into several sequential steps that handle the evolution of different parts of the cellular automaton belonging into different morphological classes, i.e. the conducting system, muscle, and the SA node. Due to computational reasons, one additional morphological class is defined with the empty value that should be understood in the following sense. A cell having the empty morphological state is not included into propagation of excitation events, but is important to define the neighbourhood; every surface cell has at least one cell with empty morphological state in its neighbourhood. Figure 1: The next state in the current cell (filled rectangle) depends on its actual state and on states of the cells in the local neighbourhood. Figure 2: Rotated body with a selected element T e, CA lattice. 141
144 32 Simulations in Biomedicine Each cell in the CA model has two variables, namely, state and morphology. Variable state of the cell defines the level of excitation of the cell laying in the interval of < 0, 21 >. State equal to the value of 21 is the excited state. As the value of the state variable decreases, first absolutely refractory states and then relatively refractory states are reached. The resting state, i.e. the situation when the cell waits for an excitation event, has assigned the zero value. Every cell inside the lattice belongs to one of the following morphology classes, i.e. empty, the conducting system, muscle, and the SA node with values of 0, 1, 2, and 3, respectively. All cells with values between 1 and 3 define excitable medium. Cells with value equal to zero, i.e. empty cells, do not influence the excitation process at all. 4.2 CA and FEM coupling The results of CA simulation serve for defining the activation parameters of the above mentioned model of muscle fibres. Thus, modelling of muscle contraction is performed in two steps: 1. CA simulation for all required time steps. 2. FE simulation of muscle mechanics using the distribution of action potentials, as computed by CA. As the result of step 1, at any time and for each integration point of the FE mesh the activation parameter F a, see (5), is obtained by an averaging procedure which operates on the state values of all CA cells within the particular element. This loose coupling is possible due to the assumed independence of the state of CA cells on deformation of the tissue at the corresponding point, as computed by FE simulation. Clearly, the CA lattice must reflect the geometry of (undeformed) FE mesh. For this purpose the following algorithm has been developed: Input the box which is going to contain the CA lattice.to minimize the number of CA cells it is possible to rotate the coordinate system ˆX i of CA box with respect to the system X i of the FE body. Set division of CA box, i.e. cell counts in axial directions ˆX i. For every element of FE mesh mark (as tissue, conducting system, pacemaker,... ) the CA cells c contained within, see Fig. 2. This step involves computing the reference element coordinates ξ = ξ(c) by the Newton method (with 3 3 tangent matrix of the mapping c(ξ) χ T (ξ) x, where x are coordinates of the element nodes). 5 Numerical simulation of the ventricular contraction The numerical simulations were performed using the geometry of the dog heart, for which we obtained relevant geometrical data with a correct orientation of muscle fibres, see Fig. 3. We consider a model of the heart ventricles only (i.e. beneath the basal skeleton), which can be assumed to form a separate electro-mechanical subsystem of the heart. The ventricles (fixed at the top) are inflated by ventricular pressures reaching 120 mm Hg for the left and 25 mm Hg for the right ventricle, 142


145 Simulations in Biomedicine 33 Figure 3: Geometry of the dog heart with outlined network of muscle fibres. Figure 4: Propagation of the action potential. Three consecutive instants. 4 states indicated by different colours. Figure 5: Contracted and inflated shapes of ventricles. Figure 6: Stress distribution in active (muscle) fibres. respectively. Difference between contracted and released heart geometry is demonstrated in Fig. 5. In Fig. 6 the tension in muscle fibres is displayed for an initial period of the systolic contraction. The values of activation are obtained from the CA analysis of excitation. For illustration, in Fig. 4 we display results of CA analysis on the human heart, for which we have the conducting system well defined. 6 Conclusion The model of myocardium presented in this paper allows for capturing important nonlinear and anisotropic features of the cardiac tissue. In order to describe behaviour of the pumping heart, a relevant model of the excitation wave propagation is needed. Our approach is based on coupling the cellular automata (CA), for simulation of the excitation, with the finite element model of the heart mechanics. The CA model seems to be a flexible tool, which can be adapted easily to approx- 143
146 34 Simulations in Biomedicine imate the wave propagation, influenced by various physiological effects. The simple model of muscle fibres currently used seems to be sufficient for simulation of steady state periodic responses. For studies regarding transition phenomena, caused e.g. arrhythmia, however, more sophisticated models based on cross-bridge kinetics can be used, which also involve fading memory effects. Due to inclusion of the myocardial intracoronary blood perfusion, its consequence on stiffening of the ventricular wall can be analyzed. Local deficiency in intramyocardial blood supply can decrease rapidly the speed of excitation wave; this effects can be captured by the CA algorithm. For further improvement of the heart model the dynamic blood flow inside the ventricles will have to be pursued. Effects of the local tissue deformation on propagation of the excitation wave should also be reconsidered in forthcoming studies; for this, however, the CA simulation will need to be tightly coupled with the FE analysis of deformation. Acknowledgment The research was supported by the project LN00B084 of The New Technologies Research Centre, University of West Bohemia, Plzeň. We would also like to thank Frank Genot of INRIA Rocquencourt (France) for providing us the refined FE meshes of the dog heart based upon the original Auckland data. References [1] Campen, D.H., Huyghe, J.M., Bovendeerd, P.H.M. & Arts, T., Biomechanics of the heart muscle. Eur. J. Mech., A/Solids, 13, pp , [2] Cimrman, R. & Rohan, E., FE simulation of muscle behaviour in dynamic problems. Proc. of the conference ECCM 2001, Krakow, full paper on CD- ROM, [3] Guccione, J.M., Costa, K.D. & McCulloch, A.D., Finite element stress analysis of left ventricular mechanics in the beating dog heart. Journal of Biomechanics, 28, pp , [4] Guyton, A.C. & Hall, J.E., Textbook of Medical Physiology. W.B. Saunders Company, Philadelphia, [5] Holzapfel, G.A., Nonlinear Solid Mechanics. J. Wiley, Chichester, [6] Chopard, B. & Droz, M., Cellular Automata Modeling of Physical Systems. Cambridge University Press, Cambridge, [7] Nash, M., Mechanics and material properties of the heart using an anatomically accurate mathematical model. Doctoral thesis, The University of Auckland, [8] Rohan, E. & Cimrman, R., Sensitivity analysis and material identification for activated smooth muscle. Comput. Assisted Meth. Engrg. Sci., 9, pp , [9] Vichniac, G.Y., Simulation physics with cellular automata, Physica 10D, pp , [10] Zahalak, G. I., A distribution-moment approximation for kinetic theories of muscular contraction. Mathematical Biosciences, 55, pp ,
147 The 3 rd European Medical and Biological Engineering Conference November 20 25, 2005 EMBEC'05 Prague, Czech Republic COMPUTER SIMULATION OF THE FLOW IN THE ABDOMINAL ANEURYSMATIC AORTA Z. Tonar, J. Jeník, V. Třeška and M. Novák University of West Bohemia/Department of Mechanics, Pilsen, Czech Republic University Hospital/Department of Surgery, Pilsen, Czech Republic University Hospital/Radiodiagnostic Clinic, Pilsen, Czech Republic tonar@ntc.zcu.cz Abstract: Our aim was to develop a computer model of the blood flow and vascular wall mechanics in the descending abdominal aneurysmatic aorta. The purpose was to study the relationship between the flow structure, wall behaviour, and aneurysm morphology. Morphology of a realistic model of the aortic lumen was based on a data obtained from a 76-year-old male patient undergoing computer tomography of descendent aorta and pelvic arteries. The geometry was created and covered with surface mesh in the Amira T M software. The numerical simulation was performed in the Fluent software. The numerical model was based on the equation of mass conservation with constant value of density and on the system of Navier-Stokes equations. The constitutive relations represented the Newtonian fluid. The inlet boundary condition was represented by the pulsatile flow. The outlet boundary condition was the pressure outlet ( Pa in each of the iliac arteries). The lumen of arteries was modelled as encircled by a rigid wall and the fluid-wall interaction was taken into account. The discretisation was realized by finite element method. Collections of maps were obtained describing redistribution of the wall stress contours and the velocity profiles. Introduction Numerical simulation of the flow in the aortic system proved itself to be a promising method for better understanding of the development of atherosclerotic abdominal aortic aneurysm (AAA) and its dependence on flow structure [1]. Our first task was to create a simplified finiteelement grid of the lumen of aneurysmatic aorta and its main visceral and pelvic branches. The second aim was to study the blood flow through this realistic geometry, taking into consideration the interaction of the fluid with the vessel wall. Interaction between a fluid and a solid continuum A loosely coupled method of interaction is useful for the solution of the interaction between a fluid and a solid continuum. This method is based on an alternately separated solution of both the fluid and the solid phase. The interface between fluid and solid part is composed of appropriate boundary conditions shared by both phases. The boundary is updated during each of the time steps. The basic algorithm is built up on two steps. The first one represents a solution of the fluid part where the vessel wall rigidity is taken in consideration. This configuration is signed as initial undeformed configuration and the first step produces the pressure field on the shared boundary condition. The second step represents a solution of elastic solid phase loaded by pressure field on its shared interface. Thereby the fluid channel becomes deformed and it is necessary to repair the solution of the fluid part where the solid wall rigidity is again taken into consideration. These steps are being solved up to limitation of convergency. Materials and Methods The morphology of the computational 3-D tetrahedral grid was obtained from 76-year-old male patient undergoing computer tomography (CT) angiography of descendent aorta and pelvic arteries because of subrenal abdominal aortic aneurysm (AAA, length of 14.5 cm, width 8 cm, parietal thrombus 4 cm thick; inner diameter of aneurysm was 57 mm 41 mm), affecting also both of the common iliac arteries. The data were transferred from a 16-row CT (Somatom Sensation 16, Siemens, Forchheim, Germany) via the DICOM format into Amira T M software (TGS Europe, Merignac Cedex, France), see Fig. 1. Full spatial resolution of the CT data matrix was preserved (512 pixels 512 pixels, nominal slice thickness (collimation) of 0.75 mm, increment of 0.75 mm). The calibrated image data set was segmented semiautonomically with respect to the lumen of aorta. Neither visceral nor parietal branches of aorta were considered. The quality of the grid ( tetrahedral elements) was enhanced by adaptive resizing of elements according to vessel diameter and irregular regional shape of the aneurysm (Gambit, Fluent Europe, Sheffield, Great Britain). Computer simulation of the fluid continuum by means of the finite element volume (FEV) method The numerical simulation was performed with use of the commercial software Fluent (Fluent.Inc Europe). The computations started with simulation of simple steady laminar flow with constant values of density and IFMBE Proc (1) ISSN: IFMBE 145

148 The 3 rd European Medical and Biological Engineering Conference November 20 25, 2005 EMBEC'05 Prague, Czech Republic Pulsatile velocity boundary condition The inlet boundary condition of continuum flow was represented by the pulsatile velocity profile, which was called velocity inlet in terminology of the software package Fluent [2]. The theory of oscillatory pulsatile flow was described in [3]. This theory is based on the system of Navier-Stokes equations for unsteady viscous incompressible continuum Figure 1: CT-angiography, four-view. kinematic viscosity. The model was then improved, i.e. we proceeded to the modelling of an unsteady flow, where the non-constant value of viscosity depended on the shear rate. The power law model was used for this purpose. For the first approach, we took into account the laminar flow of Newtonian fluid with constant value of density ρ = 1050 (kg m 3 ) and constant value of the dynamic viscosity given by value of kinematic viscosity ν = (m s 2 ). For this purpose, we used the equations of mass conservation ρ t + (ρv i ) = 0, (1) y i where ρ represent density and v i velocity of the fluid stream, and the system of Navier-Stokes equations for incompressible continuum p η y j y j ( vi y j ) = ρ f i ρ Dv i Dt. (2) The second term on the right side of equation 2 represented the material derivation of an appropriate quantity. To obtain this form of Navier-Stokes equations, we started with the equation of force conservation ρ Dv i Dt = ρ f i + τ i j y j. (3) We put the the constitutive relation for the stress tensor τ i j into the equation 3 τ i j = pδ i j + R i j, (4) where p stood for the pressure, δ i j for the Kronecker delta and R i j for the dissipation tensor R i j = 2ηė i j + ήė ll δ ll, (5) where η denotes dynamic viscosity and ή the so-called second viscosity. The tensor of strain rate ė i j is given by kinematic relation D i j = ė i j = 1 ( v j + v ) i. (6) 2 y i y j 2 w p r r w p r 1 w p = 1 p ν t η x, (7) where the velocity boundary condition of the wall was set to w p = 0 and the inner radius r = R was taken into account. The evolution of the pressure gradient in time was used as a periodic function of time and therefore it was useful to put the development in Fourier series form p x = Re[ A e i(nω 0t+φ n) n=0 ], (8) where base frequency was signed as ω 0, amplitude as A, and n was the sequence of harmonic components. Re stood for the real part of complex value in the square brackets. For n = 1, φ 1 = φ, ω 0 = ω we wrote p x = Re [ Ae i(ωt+φ)]. (9) Finally, using the equations above, we converted the expression 7 into the following relation 2 w p r r w p r 1 w p = A ν t η eiωt. (10) This form of Navier-Stokes equations lead to Bessel zeroorder equation so we were allowed to deduce the following form { [ AR 2 1 w p = Re η α 2 i 3 1 J ( 0 αyi 3/2 ) } ( ]e J ) iωt, (11) 0 αi 3/2 where y = r/r denoted the relative radius, α = R ω/ν stood for a frequency parameter also called the Womersley number, where R was the radius of the tube (i.e. vessel wall), η was the dynamic viscosity and ω defined the angular velocity. The solution of the Bessel function was built up on the solution of Kelvin function [4] for the equation x 2 y + xy ix 2 y = 0. (12) The common integral of this term was ) ( ) y = c 1 J 0 (i 3/2 x + c 2 K 0 i 1/2 x. (13) Function J 0 ( i 3/2 x ) was developed into series ) ( x2 ) 2 ( x2 ) 4 ( x2 ) 6 J 0 (i 3/2 x = 1 + i (1!) 2 (2!) 2 i... (14) 2 (3!) IFMBE Proc (1) ISSN: IFMBE 146
 4 ( x2 ) 8 ( x2 ) 12 ber x = 1 (2!) 2 + (4!) 2... (16) 2 (6!")
149 The 3 rd European Medical and Biological Engineering Conference November 20 25, 2005 EMBEC'05 Prague, Czech Republic and therefore we were allowed to put ) J 0 (i 3/2 x = ber x + i bei x, (15) where function 16 and 17 were referred as Kelvin function Bessel real ber x and Bessel imaginary bei x of the function J 0. ( x2 ) 4 ( x2 ) 8 ( x2 ) 12 ber x = 1 (2!) 2 + (4!) 2... (16) 2 (6!) ( x2 ) 2 ( x2 ) 6 ( x2 ) 10 bei x = (1!) 2 (3!) (17) 2 (5!) The stationary component of the velocity was defined by the relation w s = q sr 2 ( 1 y 2 ), (18) 4η where q s was stationary component of the final pressure gradient which was build by stationary and pulsatile component d p dx = q = q s + q p. The final pulsatile velocity in the tube was composed by the stationary velocity and by the pulsatile velocity component of the flow, as shown by the following relation w = w s + w p. (19) Figure 2 presents the development of velocity profiles during the periodic time cycle for Womersley number α = 21( ). relation well known as Hook s theorem) was taken into account. The real field of movements inside the mesh of tetrahedral elements was replaced by linear base functions u = α 1 + α 2 x + α 3 y + α 4 z v = α 5 + α 6 x + α 7 y + α 8 z (20) w = α 9 + α 10 x + α 11 y + α 12 z. The field of movements was continuous. The density of deformation energy of the isotropic homogenous material, where the behaviour according the Hook s law was expected, was given by the term Λ = 1 2 (σ xε x + σ y ε y + σ z ε z + τ xy γ xy + τ yz γ yz + τ zx γ zx ), (21) where σ defined the main tension, ε was relative extension and τ signed the shear stress. Hook s law could be expressed in a matrix form σ = E ε, (22) and the matrix of the elastic constants E [6] was in the following form µ 1 µ E = µ E (1 µ) (1 + µ) (1 2µ) 1 1 µ µ µ 1 µ µ 1 µ µ (1 µ) µ µ 1 µ 1 µ (1 µ) 0 1 2µ 2 (1 µ) (23) and finally ε was the vector of appropriate relative extensions. The values were adopted according to [7] so the wall Young s modulus was set to E = 2.5MPa and Poisson coefficient was set to µ = 0.45 (nearly incompressible material). We were allowed to express the density of deformation energy by the equation Λ = 1 2 εt E ε. (24) Figure 2: Pulsatile velocity inlet boundary condition during a periodic time cycle. Presenting the boundary condition of the fluid part of the model, we have to mention also the outlet boundary condition. It was simply represented by a constant pressure of Pa in each of the iliac arteries, as adopted from expert literature [5]. This kind of conditions were named pressure outlet in the Fluent environment. Mathematical model of the solid continuum FEM The mathematical simulation of solid part was based on the finite element method (FEM). The system showed the behaviour of a deforming body where an isotropic, linear, homogeneous material (described by constitutive The vector ε was given by Cauchy s form ε kl = 1 ( uk + u ) l 2 x l x k (25) Deformation energy of a tetrahedral element was given by integrating the density of deformation energy through the volume of the element. Applying the stiffness matrix of the mesh element, the deformation energy was expressed. The surface boundary condition represented a force loading the appropriate surface. The directions of the loading pressure vector were obtained by righthand rules in directions of the increasing nodes indices (the vector of right sides in FEM terminology); in fact, it was the vector of force component relevant to each of the nodes [ ] T f c = f1 T f2 T f3 T... fn T p. (26) IFMBE Proc (1) ISSN: IFMBE 147

 This balance was expressed with the term K c c = f c.")
 2 +(σ z σ x) 2 +6 (τ 2 xy+τ 2 yz+τ 2 zx). (29) The developed model (Fig.")
150 The 3 rd European Medical and Biological Engineering Conference November 20 25, 2005 EMBEC'05 Prague, Czech Republic Figure 4: Stress contours at systolic peak, left lateral view and dorsal view. Figure 3: Anterior view on the lumen with subrenal aneurysm. The visceral branches of aorta were not involved in the simulation. The global stiffness matrix covered the system of relations among all the nodal movements represented by vector c and appropriate components of nodal reactions forces. These reactions forces had to be in balance with the outer force field. [ ] T c = T 1 T 2 T 3... T N p. (27) This balance was expressed with the term K c c = f c. (28) With knowing the node movements, it was possible to express the spatial tensions according to Von Mises (HMH) method, as shown by the following expression Results σ redhmh = 1 2 (σ x σ y) 2 +(σ y σ z) 2 +(σ z σ x) 2 +6 (τ 2 xy+τ 2 yz+τ 2 zx). (29) The developed model (Fig. 3) reflected the most significant features of the vessel wall altered by atherosclerosis and asymmetric aneurysmatic dilatation. The model included huge and medium-sized vessels, with mesh density created adaptively according to the lumen. During the systole, two swirls developed ventrally in the cranial segment of aneurysm and laterally in the right junction of aneurysm neck and sac close to the origin of right renal artery. Both swirls persisted through the whole cardiac cycle with maximum in end-diastolic phase. The distribution pattern of stress contours according to Von Mises HMH method was computed (Fig. 4). The highest stress values were found in the left dorsal part of the cranial third of the aneurysm. The velocity vectors during the whole cardiac cycle were computed (Fig. 5). Figure 5: Velocity vectors coloured by static pressure at systolic peak, left lateral view. Discussion During the computation, we found the spatial resolution of the model to be sufficient even in the very irregular and realistic morphology of the aneurysm. The lateral swirl could be caused by the effect of local irregular bending of aneurysm neck. In our case of realistic model, the swirls persisted through both systole and diastole. In an idealised smooth model of AAA without branching [1], the whirls regressed during the peak systolic flow and (unlike in our model) other swirls originated in the caudal segment of AAA. Our simulation of distribution pattern of stress contours in the wall of the aneurysmatic sac yielded heterogeneous values comparable to [7, 8], with maximum in the dorsal part of the cranial third of the aneurysm. As the hemodynamic parameters of the patient under study were not included in the model, the results do not provide the actual wall stresses of this patient they provide information on the stress pattern and rather characterise the geometrical type of the aneurysm. Unlike Di Martino et al. [7], we did not observe any significant vessel wall displacement. The reason is that in our simulation, the reference configuration of the wall model was set after processing the very first cardiac cycle. Although the simulation was performed for the Newtonian fluid only, we would have expected tiny differences in flow structure between results based on Newtonian and non-newtonian fluid, as our model comprised no small vessels. The 3-D flow field in AAA depends a great deal on the geometry of the vessel, as proved by simulations of flow pattern in hypothetically shaped idealized and asym- IFMBE Proc (1) ISSN: IFMBE 148
151 The 3 rd European Medical and Biological Engineering Conference November 20 25, 2005 EMBEC'05 Prague, Czech Republic metric models under realistic pulsatile flow conditions [9, 10]. However, simple geometric criteria are unreliable in modelling AAA biomechanics and the potential for rupture of an individual AAA can not be estimated in simulations based on statistics from aggregate populations [11]. In realistic models involving abdominal aortic branches, more information on the flow field in bifurcation regions can be acquired. Such information may provide an additional insight into hemodynamic factors involved in the predilection of atherosclerotic lesions in AAA development [12]. When modelling vascular networks with multiple branches, outflow boundary conditions play a great role in blood flow distribution. Also the effect of exercise on hemodynamic conditions and flow redistribution in aorta is considerable [13]. Patients with AAA are in danger of aneurysm rupture, which occurs most often in dorsal or dorsolateral wall of the aneurysmatic sac. Morphological and mechanical risk factors of rupture include e.g. aneurysm diameter and its expansion rate, loss of elastin and inflammatory infiltrates leading to mechanical inferiority of the wall, tensile wall stress, shear stress, flow patterns and swirls, blood pressure, etc. [14]. We did not solve the wall shear stress problem, as under common conditions the physiologic shear stress on the inner wall is of lesser effect than the tensile stress within the wall due to pressure in an AAA [15]. Simulation of aneurysm fluid dynamics and its effect on aneurysm wall mechanics in realistic 3- D models [7] served already as a guidance to assess the risk of rupture of the aneurysm. Similar to our study, the authors delt with the aneurysmatic sac only, omitting the hemodynamic influence of arterial branches of precedent and subsequent segment of the aorta. However, the effect of the flow in aorta branches on the flow in the aneurysm might be significant and deserves a further interest. Fillinger [15] analysed rupture risk over time in patients with AAA under observation, performing nonlinear hyperelastic modelling of aneurysm wall behaviour compared to CT data and blood pressure observation. A noninvasive study of 3-D tensile wall stress was found to be superior to maximum diameter for determining rupture risk. The simulation of wall stress provided significant differences of clinical use for aneurysms that could be safely observed for longer periods or needed surgical repair to prevent rupture within a short time. The effect of 3-D shape appeared to dominate the effect of blood pressure and the influence of diameter. Asymmetry and wall thickness on stresses has been studied thoroughly in both theoretical and CT-based realistic 3-D models of AAA [16, 17]. At present, there is need for predictive models with realistic morphology in order to gather experience with computational simulations correlated to clinical decision making. Our method of finite-element grid construction enables us to consolidate the view of clinical medicine (i.e. vascular surgery), diagnostic imaging methods and computational simulation. It does not describe the very important composition of atherosclerotic vessel wall and of intraluminal thrombus, which can be extracted from high-resolution magnetic resonance [18]. Nevertheless, CT angiography remains the most frequent and routine method of aneurysm diagnostics and morphometry in patients undergoing elective surgery for this condition. Young healthy patients with large aneurysms have a risk-benefit ratio that favours vascular or endovascular surgery. The presented method could be useful in patients with boundary value of aneurysm diameter and high surgical risk or in asymptomatic patients with smaller aneurysms (5 6 cm) without rapid expansion. In these patients, the final decision on surgery could be ambiguous because mortality and morbidity of elective surgery are too high when compared to conservative treatment. Also the tensile stress analysis of the aneurysm wall has the potential to aid management in patients who are at high risk for surgery and have aneurysms of a moderate size [15]. Pulsatile flow assessment should help the surgeon to evaluate localisation and significance of swirls in the AAA. Whether simulation of wall shear stress correlates with the risk of initial dissection of AAA, remains unsolved. Until now, we are lacking reference papers and case-reports bringing clinical experience with complementary results of simulation of blood flow through the AAA of the same patient. Our prospective work will be focused on the redistribution of the wall stress on the nonrigid wall induced by flow structure. Conclusions Creating mathematical models based on real morphology provides a tool integrating the view of medical diagnostics, therapy, and modelling of AAA. The numerical results obtained in this study showed the flow features and wall stress distribution in a model of AAA with realistic morphology. The approach presented was found to be suitable e.g. for follow-up study of patients observed for the aneurysm growth, where simulations could be correlated with surgeon s clinical experience. Then modelling of blood flow characteristics could be considered properly when predicting the individual aneurysm rupture potential. Acknowledgements This work was supported by the project MSM awarded by the Ministry of Education, Youth and Sports of the Czech Republic. References [1] FINOL, E. A., KEYHANI, K., and AMON, C. H. The effect of asymmetry in abdominal aortic aneurysms under physiologically realistic pulsatile flow conditions. J. Biomech. Eng., 125: , [2] FLUENT INC. EUROPE Sheffield, Great Britain. Fluent 6.1. manual, IFMBE Proc (1) ISSN: IFMBE 149
152 The 3 rd European Medical and Biological Engineering Conference November 20 25, 2005 EMBEC'05 Prague, Czech Republic [3] VALENTA, J. Biomechanics. Academia, Prague, [4] REKTORYS, K. Přehled užité matematiky 1 [outlines of applied mathematics vol. 1]. Prometheus, Prague, [5] MILLS, C. J., GABE, I. T., GAULT, J. H., MA- SON, D. T., ROSS JR., J., BRAUNWALD, E., and SHILLINGFORD, J. P. Pressure-flow relationships and vascular impedance in man. Cardiovascular Research, 4: , [6] BATHE, K. J. Finite element procedures. Prentice- Hall, Inc., New Jersey, pp. 194, [7] DI MARTINO, E. S., GUADAGNI, G., FUMERO, A., BALLERINI, G., SPIRITO, R., BIGLIOLI, P., and REDAELLI, A. Fluid-structure interaction within realistic three-dimensional models of the aneurysmatic aorta as a guidance to assess the risk of rupture of the aneurysm. Med. Eng. Phys., 23: , [8] LEE, D. and CHEN, J. Y. Numerical simulation of steady flow fields in a model of abdominal aorta with its peripheral branches. J. Biomech., 35: , [9] FINOL, E. A. and AMON, C. H. Flow-induced wall shear stress in abdominal aortic aneurysms: Part ii pulsatile flow hemodynamics. Comput. Methods Biomech. Biomed. Engin., 5: , [10] YIP, T. H. and YU, S. C. M. Cyclic flow characteristics in an idealized asymmetric abdominal aortic aneurysm model. Proc. Inst. Mech. Eng., 217:27 39, [11] HUA, J. and MOWER, W. R. Simple geometric characteristics fail to reliably predict abdominal aortic aneurysm wall stresses. J. Vasc. Surg., 34: , [12] SHIPKOWITZ, T., RODBERS, V. G. J., FRAZIN L. J., and CHANDRAN, K. B. Numerical study on the effect of secondary flow in the human aorta on local shear stresses in abdominal aortic branches. J. Biomech., 33: , [13] TAYLOR, C. A., HUGHES, T. J. R., and ZARINS, C. K. Effect of exercise on hemodynamic conditions in the abdominal aorta. J. Vasc. Surg., 29: , [14] SONESSON, B., SANDGREN, T., and LANNE, T. Abdominal aortic aneurysm wall mechanics and their relation to risk of rupture. Eur. J. Vasc. Endovasc. Surg., 18: , [15] FILLINGER, M. F., MARRA, S. P., RAGHAVAN, M. L., and KENNEDY, F. E. Prediction of rupture risk in abdominal aortic aneurysm during observation: Wall stress versus diameter. J. Vasc. Surg., 37: , [16] RAGHAVAN, M. L., VORP, D. A., FEDERLE, M. P., MAKAROUN, M. S., and WEBSTER, M.W. Wall stress distribution on three-dimensionally reconstructed models of human abdominal aortic aneurysm. J. Vasc. Surg., 31: , [17] THUBRIKAR, M. J., AL-SOUDI, J., and ROBIC- SEK, F. Wall stress studies of abdominal aortic aneurysm in a clinical model. Ann. Vasc. Surg., 15: , [18] YANG, F., HOLZAPFEL, G., SCHULZE-BAUER, C., Stollberger, R., THEDNS, D., BOLINGER, L., STOLPEN, A., and SONKA, M. Segmentation of wall and plaque in in vitro vascular mr images. Int. J. Cardiovasc. Imaging, 19: , IFMBE Proc (1) ISSN: IFMBE 150


153 ANEURYSMS Structure Interaction in Abdominal Aortic Aneurysms By Jiří Jeník 1,2, Zbyněk Tonar 1,3, Vladislav Třeška 4, and Milan Novák 5 1 Department of Mechanics at the University of West Bohemia in Pilsen, Czech Republic 2 New Technology Research Center in West Bohemia Region within University of West Bohemia in Pilsen, Czech Republic 3 Department of Histology and Embryology Faculty of Medicine in Pilsen, Charles University in Prague, Czech Republic 4 Surgery Clinic University Hospital Pilsen, Charles University in Prague, Czech Republic 5 Radiodiagnostic Clinic University Hospital Pilsen, Charles University in Prague, Czech Republic BIOMEDICAL INDUSTRY Four views of a CT-angiography scan in DICOM format Texture-based direct volume rendering, reconstruction of AAA based on the CT angiography scan in DICOM format of the vessel wall was computed using a finite-element method. The vessel wall motion was constrained on the side adjacent to the vertebrae, and at the inlet and outlet planes. Interaction of the fluid and solid regions was accounted for using an alternating calculation by FLUENT and an in-house code, which was coupled to FLUENT through userdefined functions (UDFs). The wall shape was assumed to be rigid for the purpose of computing the fluid flow. The resulting pressure on the interface shared by the fluid and wall was then used as a boundary condition for the solution of the elastic solid phase. The deformed wall led to a geometrically modified fluid region, which was subsequently updated by the CFD calculation. This so-called uncoupled FSI calculation was repeated until convergence was reached. Results of the FSI calculation show that at systole, where the flow rate is maximum, two circulation patterns are in evidence in the aneurysm. One is located laterally beyond the right junction of the aneurysm neck, close to the origin of the right renal artery. The second one is located in the superior segment of the aneurysm. These two circulation patterns are also evident at diastole, the point of minimum flow, but they are noticeably weaker. Throughout the cardiac cycle, it is also possible to identify regions where there is reduced contact time between the formed blood elements (blood platelets and corpuscles) and the inner vessel. This situation could be the reason why variations in the thickness of the parietal thrombus develop. The hemodynamic parameters of the patient were not included in the numerical model, and the results do not provide the actual vessel wall stresses. The reason is that in our simulation, the reference configuration of the wall model was set after processing the first cardiac cycle. Thus the AAA model provides information of the stress pattern relative to a basal stress redistribution. The model also successfully shows the geometrical influence of the vessel wall on the wall stress. The behavior of the wall is such that the rigidity increases with the thickness of the thrombus. A general overview of the relative Fluent News Fall 2006 s11 151


154 ANEURYSMS BIOMEDICAL INDUSTRY areas where artery wall touches vertebrae Model of the abdominal aortic aneurysm and nearby vertebrae without the peripheral branches stress redistribution can be illustrated in terms of the von Mises stress. At the top of the cardiac cycle, the maximum values of the relative stress are transferred to regions where the local vessel wall is thin, such as in the superior segment near the junction with the aneurysm neck. The results also indicate an oscillation of the second highest stress in the right and dorsal part of the cranial third of the aneurysm sac. The inferior segment, on the other hand, is encased with thrombus, which does not allow for elastic displacements of the wall. During the end of the cardiac cycle, the primary stress redistribution features are the same, but as with the circulation patterns, the values are weaker. The results of this study support the clinical observation that the danger of aneurysm rupture is highest in the dorsal or dorsolateral wall of the aneurysmatic sac. The morphological and mechanical risk factors of rupture include the aneurysm diameter and expansion rate, loss of elastin and inflammatory infiltrates leading to mechanical inferiority of the wall, tensile wall stress, shear stress, flow patterns such as recirculation, and blood pressure. Simulation of aneurysm fluid dynamics and their effect on aneurysm wall mechanics in realistic 3D models [1] could serve as guides to assess the risk of rupture. In realistic models involving abdominal aortic branches, more information on the flow field in the bifurcation region is needed. Such information may provide an additional insight into hemodynamic factors involved in the predilection of atherosclerotic lesions in s12 Fluent News Fall 2006 Velocity circulation at the top of the cardiac cycle, or systole (left) and at the end of the cardiac cycle, or diastole (right), plotted on the same scale abdominal aorta aneurysm development [2]. The effect of exercise on hemodynamic conditions and flow redistribution in the aorta is also considerable [3]. Simulations such as these do not describe the very important composition of the atherosclerotic vessel wall and intraluminal thrombus, which can be extracted from high-resolution magnetic resonance [4]. Nevertheless, CT angiography remains the most frequent and routine method of aneurysm diagnostics and morphometry in patients undergoing elective surgery for this condition. Young healthy patients with large aneurysms have a riskbenefit ratio that favors vascular or endovascular surgery. The presented method could be useful in patients with aneurysms of questionable size and high surgical risk or in asymptomatic patients with smaller aneurysms (< 5 cm) that are changing slowly. In these patients, the final decision on surgery could be ambiguous because the mortality and morbidity of elective surgery are too high when compared to conservative treatment. Also the tensile stress analysis of the aneurysm wall has the potential to aid management in patients who are at high risk for surgery and have aneurysms of a moderate size [5]. Pulsatile flow assessment should help the surgeon to evaluate the localization and significance of circulation patterns in the abdominal aortic aneurysm. Acknowledgements This work was supported by the project MSM and MSM awarded by the Ministry of Education, Youth and Sports of the Czech Republic. References 1 Di Martino, E. S.; Guadagni, G.; Fumero, A.; Ballerini, G.; Spirito, R.; Biglioli, P.; and Redaelli, A.: Fluid-structure interaction within realistic three-dimensional models of the aneurysmatic aorta as a guidance to assess the risk of rupture of the aneurysm. Med. Eng. Phys., 23: , Shipkowitz, T.; Rodbers, V. G. J.; and Chandran, K. B.: Numerical study on the effect of secondary flow in the human aorta on local shear stresses in abdominal aortic branches. J. Biomech., 33: , Taylor, C. A.; Hughes, T. J. R.; and Zarins, C. K.: Effect of exercise on hemodynamic conditions in the abdominal aorta. J. Vasc. Surg., 29: , Yang, F.; Holzapfel, G.; Schulze-Bauer, C.; Stollberger, R.; Thedns, D.; Bolinger, L.; Stolpen, A.; and Sonka, M.: Segmentation of wall and plaque in in vitro vascular MR images. Int. J. Cardiovasc. Imaging, 19: , Fillinger, M. F.; Marra, S. P.; Raghavan, M. L.; and Kennedy, F. E.: Prediction of rupture risk in abdominal aortic aneurysm during observation: Wall stress versus diameter. J. Vasc. Surg., 37: , Relative stress coutours on the outside (top) and inside (bottom) of the aneurysm at the top of the cardiac cycle, plotted on the same scale Postprocessed by Paraview 152
Atlas kvantitativní histologie
 Ústav histologie a embryologie LF UK v Plzni Atlas kvantitativní histologie příručka pro studenty MUDr. Mgr. Zbyněk Tonar, Ph.D. Spolupráce na aplikacích jednotlivých metod: Ing. Petra Kochová, Doc. MVDr.
Atlas kvantitativní histologie
 Ústav histologie a embryologie LF UK v Plzni Atlas kvantitativní histologie příručka pro studenty MUDr. Mgr. Zbyněk Tonar, Ph.D. Spolupráce na aplikacích jednotlivých metod: Ing. Petra Kochová, Ph.D.,
Atlas kvantitativní histologie
 Ústav histologie a embryologie LF UK v Plzni Atlas kvantitativní histologie příručka pro studenty MUDr. Mgr. Zbyněk Tonar, Ph.D. Spolupráce na aplikacích jednotlivých metod: Ing. Petra Kochová, Ph.D.,
Kvantitativní hodnocení krevních cév biopsie peritonea
 5. sympozium o peritoneální dialýze Regionální centrum, Olomouc, 29. 3. 2007 Kvantitativní hodnocení krevních cév biopsie peritonea Z. Tonar 1, S. Opatrná 2, L Nedorost 1, M. Kultscherová 1, K. Witter
DETEKCE HRAN V BIOMEDICÍNSKÝCH OBRAZECH
 DETEKCE HRAN V BIOMEDICÍNSKÝCH OBRAZECH Viktor Haškovec, Martina Mudrová Vysoká škola chemicko-technologická v Praze, Ústav počítačové a řídicí techniky Abstrakt Příspěvek je věnován zpracování biomedicínských
MATEMATIKA V MEDICÍNĚ
 MATEMATIKA V MEDICÍNĚ Tomáš Oberhuber Fakulta jaderná a fyzikálně inženýrská České vysoké učení technické v Praze Matematika pro život TOMÁŠ OBERHUBER (FAKULTA JADERNÁ A FYZIKÁLNĚ INŽENÝRSKÁ MATEMATIKA
Jasové transformace. Karel Horák. Rozvrh přednášky:
 1 / 23 Jasové transformace Karel Horák Rozvrh přednášky: 1. Úvod. 2. Histogram obrazu. 3. Globální jasová transformace. 4. Lokální jasová transformace. 5. Bodová jasová transformace. 2 / 23 Jasové transformace
Matematická morfologie
 / 35 Matematická morfologie Karel Horák Rozvrh přednášky:. Úvod. 2. Dilatace. 3. Eroze. 4. Uzavření. 5. Otevření. 6. Skelet. 7. Tref či miň. 8. Ztenčování. 9. Zesilování..Golayova abeceda. 2 / 35 Matematická
Regresní analýza 1. Regresní analýza
 Regresní analýza 1 1 Regresní funkce Regresní analýza Důležitou statistickou úlohou je hledání a zkoumání závislostí proměnných, jejichž hodnoty získáme při realizaci experimentů Vzhledem k jejich náhodnému
Analýza obrazu II. Jan Macháček Ústav skla a keramiky VŠCHT Praha
 Analýza obrazu II Jan Macháček Ústav skla a keramiky VŠCHT Praha +4- - 44-45 Reference další doporučená literatura Microscopical Examination and Interpretation of Portland Cement and Clinker, Donald H.
Uni- and multi-dimensional parametric tests for comparison of sample results
 Uni- and multi-dimensional parametric tests for comparison of sample results Jedno- a více-rozměrné parametrické testy k porovnání výsledků Prof. RNDr. Milan Meloun, DrSc. Katedra analytické chemie, Universita
Proudění vzduchu v chladícím kanálu ventilátoru lokomotivy
 Proudění vzduchu v chladícím kanálu ventilátoru lokomotivy P. Šturm ŠKODA VÝZKUM s.r.o. Abstrakt: Příspěvek se věnuje optimalizaci průtoku vzduchu chladícím kanálem ventilátoru lokomotivy. Optimalizace
PSY117/454 Statistická analýza dat v psychologii přednáška 8. Statistické usuzování, odhady
 PSY117/454 Statistická analýza dat v psychologii přednáška 8 Statistické usuzování, odhady Výběr od deskripce k indukci Deskripce dat, odhad parametrů Usuzování = inference = indukce Počítá se s náhodným
Karta předmětu prezenční studium
 Karta předmětu prezenční studium Název předmětu: Číslo předmětu: 545-0250 Garantující institut: Garant předmětu: Ekonomická statistika Institut ekonomiky a systémů řízení RNDr. Radmila Sousedíková, Ph.D.
Úvod do problematiky měření
 1/18 Lord Kelvin: "Když to, o čem mluvíte, můžete změřit, a vyjádřit to pomocí čísel, něco o tom víte. Ale když to nemůžete vyjádřit číselně, je vaše znalost hubená a nedostatečná. Může to být začátek
Chyby měření 210DPSM
 Chyby měření 210DPSM Jan Zatloukal Stručný přehled Zdroje a druhy chyb Systematické chyby měření Náhodné chyby měření Spojité a diskrétní náhodné veličiny Normální rozdělení a jeho vlastnosti Odhad parametrů
Statistická analýza dat v psychologii. Věci, které můžeme přímo pozorovat, jsou téměř vždy pouze vzorky. Alfred North Whitehead
 PSY117/454 Statistická analýza dat v psychologii Přednáška 8 Statistické usuzování, odhady Věci, které můžeme přímo pozorovat, jsou téměř vždy pouze vzorky. Alfred North Whitehead Barevná srdíčka kolegyně
LINEÁRNÍ MODELY. Zdeňka Veselá
 LINEÁRNÍ MODELY Zdeňka Veselá vesela.zdenka@vuzv.cz Genetika kvantitativních vlastností Jednotlivé geny nejsou zjistitelné ani měřitelné Efekty většího počtu genů poskytují variabilitu, kterou lze většinou
Operace s obrazem II
 Operace s obrazem II Biofyzikální ústav Lékařské fakulty Masarykovy univerzity Brno prezentace je součástí projektu FRVŠ č.2487/2011 Osnova Matematická morfologie Segmentace obrazu Klasifikace objektů
Automatická detekce anomálií při geofyzikálním průzkumu. Lenka Kosková Třísková NTI TUL Doktorandský seminář, 8. 6. 2011
 Automatická detekce anomálií při geofyzikálním průzkumu Lenka Kosková Třísková NTI TUL Doktorandský seminář, 8. 6. 2011 Cíle doktorandské práce Seminář 10. 11. 2010 Najít, implementovat, ověřit a do praxe
1 Tyto materiály byly vytvořeny za pomoci grantu FRVŠ číslo 1145/2004.
 Prostá regresní a korelační analýza 1 1 Tyto materiály byly vytvořeny za pomoci grantu FRVŠ číslo 1145/2004. Problematika závislosti V podstatě lze rozlišovat mezi závislostí nepodstatnou, čili náhodnou
Optimalizace provozních podmínek. Eva Jarošová
 Optimalizace provozních podmínek Eva Jarošová 1 Obsah 1. Experimenty pro optimalizaci provozních podmínek 2. EVOP klasický postup využití statistického softwaru 3. Centrální složený návrh model odezvové
VYUŽITÍ PRAVDĚPODOBNOSTNÍ METODY MONTE CARLO V SOUDNÍM INŽENÝRSTVÍ
 VYUŽITÍ PRAVDĚPODOBNOSTNÍ METODY MONTE CARLO V SOUDNÍM INŽENÝRSTVÍ Michal Kořenář 1 Abstrakt Rozvoj výpočetní techniky v poslední době umožnil také rozvoj výpočetních metod, které nejsou založeny na bázi
4 Přehled absolvovaných vědeckých a odborných stáží
 4 Přehled absolvovaných vědeckých a odborných stáží Termín Místo Vedoucí skupiny 1.11.2009-30.11.2009 1.11.2010-30.11.2010 3.10.2011-28.10.2011 Royal Institute of Prof. T. Christian Gasser, 6.5.2013-1.6.2013
Úvodem Dříve les než stromy 3 Operace s maticemi
 Obsah 1 Úvodem 13 2 Dříve les než stromy 17 2.1 Nejednoznačnost terminologie 17 2.2 Volba metody analýzy dat 23 2.3 Přehled vybraných vícerozměrných metod 25 2.3.1 Metoda hlavních komponent 26 2.3.2 Faktorová
Regresní analýza. Eva Jarošová
 Regresní analýza Eva Jarošová 1 Obsah 1. Regresní přímka 2. Možnosti zlepšení modelu 3. Testy v regresním modelu 4. Regresní diagnostika 5. Speciální využití Lineární model 2 1. Regresní přímka 3 nosnost
Porovnání dvou výběrů
 Porovnání dvou výběrů Menu: QCExpert Porovnání dvou výběrů Tento modul je určen pro podrobnou analýzu dvou datových souborů (výběrů). Modul poskytuje dva postupy analýzy: porovnání dvou nezávislých výběrů
analýzy dat v oboru Matematická biologie
 INSTITUT BIOSTATISTIKY A ANALÝZ Lékařská a Přírodovědecká fakulta, Masarykova univerzita Komplexní přístup k výuce analýzy dat v oboru Matematická biologie Tomáš Pavlík, Daniel Schwarz, Jiří Jarkovský,
Jednofaktorová analýza rozptylu
 I I.I Jednofaktorová analýza rozptylu Úvod Jednofaktorová analýza rozptylu (ANOVA) se využívá při porovnání několika středních hodnot. Často se využívá ve vědeckých a lékařských experimentech, při kterých
Projekční algoritmus. Urychlení evolučních algoritmů pomocí regresních stromů a jejich zobecnění. Jan Klíma
 Urychlení evolučních algoritmů pomocí regresních stromů a jejich zobecnění Jan Klíma Obsah Motivace & cíle práce Evoluční algoritmy Náhradní modelování Stromové regresní metody Implementace a výsledky
GIS Geografické informační systémy
 GIS Geografické informační systémy Obsah přednášky Prostorové vektorové modely Špagetový model Topologický model Převody geometrií Vektorový model Reprezentuje reálný svět po jednotlivých složkách popisu
STATISTICKÉ ODHADY Odhady populačních charakteristik
 STATISTICKÉ ODHADY Odhady populačních charakteristik Jak stanovit charakteristiky rozložení sledované veličiny v základní populaci? Populaci většinou nemáme celou k dispozici, musíme se spokojit jen s
Analýza dat na PC I.
 CENTRUM BIOSTATISTIKY A ANALÝZ Lékařská a Přírodovědecká fakulta, Masarykova univerzita Analýza dat na PC I. Popisná analýza v programu Statistica IBA výuka Základní popisná statistika Popisná statistika
1 Tyto materiály byly vytvořeny za pomoci grantu FRVŠ číslo 1145/2004.
 Testy hypotéz na základě více než 2 výběrů 1 1 Tyto materiály byly vytvořeny za pomoci grantu FRVŠ číslo 1145/2004. Testy hypotéz na základě více než 2 výběrů Na analýzu rozptylu lze pohlížet v podstatě
13 Barvy a úpravy rastrového
 13 Barvy a úpravy rastrového Studijní cíl Tento blok je věnován základním metodám pro úpravu rastrového obrazu, jako je např. otočení, horizontální a vertikální překlopení. Dále budo vysvětleny různé metody
Obsah přednášky Jaká asi bude chyba modelu na nových datech?
 Obsah přednášky Jaká asi bude chyba modelu na nových datech? Chyba modelu Bootstrap Cross Validation Vapnik-Chervonenkisova dimenze 2 Chyba skutečná a trénovací Máme 30 záznamů, rozhodli jsme se na jejich
Mechanika s Inventorem
 Mechanika s Inventorem 2. Základní pojmy CAD data FEM výpočty Petr SCHILLING, autor přednášky Ing. Kateřina VLČKOVÁ, obsahová korekce Optimalizace Tomáš MATOVIČ, publikace 1 Obsah přednášky: Lagrangeův
Pokročilé operace s obrazem
 Získávání a analýza obrazové informace Pokročilé operace s obrazem Biofyzikální ústav Lékařské fakulty Masarykovy univerzity Brno prezentace je součástí projektu FRVŠ č.2487/2011 (BFÚ LF MU) Získávání
Matematické modelování Náhled do ekonometrie. Lukáš Frýd
 Matematické modelování Náhled do ekonometrie Lukáš Frýd Výnos akcie vs. Výnos celého trhu - CAPM model r it = r ft + β 1. (r mt r ft ) r it r ft = α 0 + β 1. (r mt r ft ) + ε it Ekonomický (finanční model)
Matematika pro geometrickou morfometrii
 Matematika pro geometrickou morfometrii Václav Krajíček Vaclav.Krajicek@mff.cuni.cz Department of Software and Computer Science Education Faculty of Mathematics and Physics Charles University Přednáška
INVESTICE DO ROZVOJE VZDĚLÁVÁNÍ. Příklady použití tenkých vrstev Jaromír Křepelka
 Příklady použití tenkých vrstev Jaromír Křepelka Příklad 01 Spočtěte odrazivost prostého rozhraní dvou izotropních homogenních materiálů s indexy lomu n 0 = 1 a n 1 = 1,52 v závislosti na úhlu dopadu pro
Základy genetiky populací
 Základy genetiky populací Jedním z významných odvětví genetiky je genetika populací, která se zabývá studiem dědičnosti a proměnlivosti u velkých skupin jedinců v celých populacích. Populace je v genetickém
Optimalizace vláknového kompozitu
 Optimalizace vláknového kompozitu Bc. Jan Toman Vedoucí práce: doc. Ing. Tomáš Mareš, Ph.D. Abstrakt Optimalizace trubkového profilu z vláknového kompozitu při využití Timošenkovy hypotézy. Hledání optimálního
CYKLICKÁ VRYPOVÁ ZKOUŠKA PRO HODNOCENÍ VÝVOJE PORUŠENÍ A V APROXIMACI ZKOUŠKY OPOTŘEBENÍ. Markéta Podlahová, Ivo Štěpánek, Martin Hrdý
 CYKLICKÁ VRYPOVÁ ZKOUŠKA PRO HODNOCENÍ VÝVOJE PORUŠENÍ A V APROXIMACI ZKOUŠKY OPOTŘEBENÍ. Markéta Podlahová, Ivo Štěpánek, Martin Hrdý Západočeská univerzita v Plzni, Univerzitní 22, 306 14 Plzeň, ČR,
CT-prostorové rozlišení a citlivost z
 CT-prostorové rozlišení a citlivost z Doc.RNDr. Roman Kubínek, CSc. Předmět: lékařská přístrojová fyzika Prostorové rozlišení a citlivost z Prostorové rozlišení význam vyjádření rozlišení měření rozlišení
TECHNICKÁ UNIVERZITA V LIBERCI. Ekonomická fakulta. Semestrální práce. Statistický rozbor dat z dotazníkového šetření školní zadání
 TECHNICKÁ UNIVERZITA V LIBERCI Ekonomická fakulta Semestrální práce Statistický rozbor dat z dotazníkového šetření školní zadání Skupina: 51 Vypracovaly: Pavlína Horná, Nikola Loumová, Petra Mikešová,
Praktická cvičení. Anotace
 Pondělí Praktická cvičení Anotace Úloha 1. Úvod do práce se softwarem Surmon Cílem úlohy je ukázat účastníkům možnosti softwaru Surmon jako nástroje pro práci s daty. Jedná se o práci s pracovní plochou,
TERMINOLOGIE ... NAMĚŘENÁ DATA. Radek Mareček PŘEDZPRACOVÁNÍ DAT. funkční skeny
 PŘEDZPRACOVÁNÍ DAT Radek Mareček TERMINOLOGIE Session soubor skenů nasnímaných během jednoho běhu stimulačního paradigmatu (řádově desítky až stovky skenů) Sken jeden nasnímaný objem... Voxel elementární
Statistická analýza jednorozměrných dat
 Statistická analýza jednorozměrných dat Prof. RNDr. Milan Meloun, DrSc. Univerzita Pardubice, Pardubice 31.ledna 2011 Tato prezentace je spolufinancována Evropským sociálním fondem a státním rozpočtem
Statistická analýza jednorozměrných dat
 Statistická analýza jednorozměrných dat Prof. RNDr. Milan Meloun, DrSc. Univerzita Pardubice, Pardubice 31.ledna 2011 Tato prezentace je spolufinancována Evropským sociálním fondem a státním rozpočtem
5EN306 Aplikované kvantitativní metody I
 5EN306 Aplikované kvantitativní metody I Přednáška 5 Zuzana Dlouhá Předmět a struktura kurzu 1. Úvod: struktura empirických výzkumů 2. Tvorba ekonomických modelů: teorie 3. Data: zdroje a typy dat, význam
Stereometrie a volumometrie. H.Mírka, J. Ferda, KZM LFUK a FN Plzeň
 Stereometrie a volumometrie H.Mírka, J. Ferda, KZM LFUK a FN Plzeň Co a proč měříme - rozměry - volba léčebné strategie a taktiky - vzdálenosti - plánování intervenčních výkonů - plocha - určení velikosti
Únosnost kompozitních konstrukcí
 ČESKÉ VYSOKÉ UČENÍ TECHNICKÉ V PRAZE Fakulta strojní Ústav letadlové techniky Únosnost kompozitních konstrukcí Optimalizační výpočet kompozitních táhel konstantního průřezu Technická zpráva Pořadové číslo:
y = 0, ,19716x.
 Grafické ověřování a testování vybraných modelů 1 Grafické ověřování empirického rozdělení Při grafické analýze empirického rozdělení vycházíme z empirické distribuční funkce F n (x) příslušné k náhodnému
Pravděpodobnost, náhoda, kostky
 Pravděpodobnost, náhoda, kostky Radek Pelánek IV122, jaro 2015 Výhled pravděpodobnost náhodná čísla lineární regrese detekce shluků Dnes lehce nesourodá směs úloh souvisejících s pravděpodobností krátké
OBRAZOVÁ ANALÝZA. Speciální technika a měření v oděvní výrobě
 OBRAZOVÁ ANALÝZA Speciální technika a měření v oděvní výrobě Prostředky pro snímání obrazu Speciální technika a měření v oděvní výrobě 2 Princip zpracování obrazu matice polovodičových součástek, buňky
Intervalové odhady. Interval spolehlivosti pro střední hodnotu v N(µ, σ 2 ) Interpretace intervalu spolehlivosti. Interval spolehlivosti ilustrace
 Interpretace intervalu spolehlivosti. Interval spolehlivosti ilustrace") Intervalové odhady Interval spolehlivosti pro střední hodnotu v Nµ, σ 2 ) Situace: X 1,..., X n náhodný výběr z Nµ, σ 2 ), kde σ 2 > 0 známe měli jsme: bodové odhady odhadem charakteristiky je číslo) nevyjadřuje
Intervalové odhady Interval spolehlivosti pro střední hodnotu v Nµ, σ 2 ) Situace: X 1,..., X n náhodný výběr z Nµ, σ 2 ), kde σ 2 > 0 známe měli jsme: bodové odhady odhadem charakteristiky je číslo) nevyjadřuje
Dobývání znalostí. Doc. RNDr. Iveta Mrázová, CSc. Katedra teoretické informatiky Matematicko-fyzikální fakulta Univerzity Karlovy v Praze
 Dobývání znalostí Doc. RNDr. Iveta Mrázová, CSc. Katedra teoretické informatiky Matematicko-fyzikální fakulta Univerzity Karlovy v Praze Dobývání znalostí Pravděpodobnost a učení Doc. RNDr. Iveta Mrázová,
Mechanika kontinua. Mechanika elastických těles Mechanika kapalin
 Mechanika kontinua Mechanika elastických těles Mechanika kapalin Mechanika kontinua Mechanika elastických těles Mechanika kapalin a plynů Kinematika tekutin Hydrostatika Hydrodynamika Kontinuum Pro vyšetřování
EXPERIMENTÁLNÍ MECHANIKA 2 Přednáška 5 - Chyby a nejistoty měření. Jan Krystek
 EXPERIMENTÁLNÍ MECHANIKA 2 Přednáška 5 - Chyby a nejistoty měření Jan Krystek 9. května 2019 CHYBY A NEJISTOTY MĚŘENÍ Každé měření je zatíženo určitou nepřesností způsobenou nejrůznějšími negativními vlivy,
Konstrukční varianty systému pro nekoherentní korelační zobrazení
 Konstrukční varianty systému pro nekoherentní korelační zobrazení Technický seminář Centra digitální optiky Vedoucí balíčku (PB4): prof. RNDr. Radim Chmelík, Ph.D. Zpracoval: Petr Bouchal Řešitelské organizace:
Název práce: DIAGNOSTIKA KONTAKTNĚ ZATÍŽENÝCH POVRCHŮ S VYUŽITÍM VYBRANÝCH POSTUPŮ ZPRACOVÁNÍ SIGNÁLU AKUSTICKÉ EMISE
 Ing. 1 /12 Název práce: DIAGNOSTIKA KONTAKTNĚ ZATÍŽENÝCH POVRCHŮ S VYUŽITÍM VYBRANÝCH POSTUPŮ ZPRACOVÁNÍ SIGNÁLU AKUSTICKÉ EMISE Školitel: doc.ing. Pavel Mazal CSc Ing. 2 /12 Obsah Úvod do problematiky
2 Zpracování naměřených dat. 2.1 Gaussův zákon chyb. 2.2 Náhodná veličina a její rozdělení
 2 Zpracování naměřených dat Důležitou součástí každé experimentální práce je statistické zpracování naměřených dat. V této krátké kapitole se budeme věnovat určení intervalů spolehlivosti získaných výsledků
Pravděpodobnost, náhoda, kostky
 Pravděpodobnost, náhoda, kostky Radek Pelánek IV122 Výhled pravděpodobnost náhodná čísla lineární regrese detekce shluků Dnes lehce nesourodá směs úloh souvisejících s pravděpodobností připomenutí, souvislosti
Regresní a korelační analýza
 Regresní a korelační analýza Mějme dvojici proměnných, které spolu nějak souvisí. x je nezávisle (vysvětlující) proměnná y je závisle (vysvětlovaná) proměnná Chceme zjistit funkční závislost y = f(x).
VEGETAČNÍ BARIÉRY Mgr. Jan Karel
 VEGETAČNÍ BARIÉRY Využití metodiky pro kvantifikaci efektu výsadeb vegetačních bariér na snížení koncentrací suspendovaných částic a na ně vázaných polutantů 10. 11. 2017 Mgr. Jan Karel Metodika pro výpočet
Interní norma č. 22-102-01/01 Průměr a chlupatost příze
 Předmluva Text vnitřní normy byl vypracován v rámci Výzkumného centra Textil LN00B090 a schválen oponentním řízením dne 7.12.2004. Předmět normy Tato norma stanoví postup měření průměru příze a celkové
Charakteristika datového souboru
 Zápočtová práce z předmětu Statistika Vypracoval: 10. 11. 2014 Charakteristika datového souboru Zadání: Při kontrole dodržování hygienických norem v kuchyni se prováděl odběr vzduchu a pomocí filtru Pallflex
Intervalové odhady. Interval spolehlivosti pro střední hodnotu v N(µ, σ 2 ) Interpretace intervalu spolehlivosti. Interval spolehlivosti ilustrace
 Interpretace intervalu spolehlivosti. Interval spolehlivosti ilustrace") Intervalové odhady Interval spolehlivosti pro střední hodnotu v Nµ, σ 2 ) Situace: X 1,..., X n náhodný výběr z Nµ, σ 2 ), kde σ 2 > 0 známe měli jsme: bodové odhady odhadem charakteristiky je číslo) nevyjadřuje
Intervalové odhady Interval spolehlivosti pro střední hodnotu v Nµ, σ 2 ) Situace: X 1,..., X n náhodný výběr z Nµ, σ 2 ), kde σ 2 > 0 známe měli jsme: bodové odhady odhadem charakteristiky je číslo) nevyjadřuje
Normální (Gaussovo) rozdělení
 rozdělení") Normální (Gaussovo) rozdělení Normální (Gaussovo) rozdělení popisuje vlastnosti náhodné spojité veličiny, která vzniká složením různých náhodných vlivů, které jsou navzájem nezávislé, kterých je velký
Normální (Gaussovo) rozdělení Normální (Gaussovo) rozdělení popisuje vlastnosti náhodné spojité veličiny, která vzniká složením různých náhodných vlivů, které jsou navzájem nezávislé, kterých je velký
Semestrální projekt. Vyhodnocení přesnosti sebelokalizace VYSOKÉ UČENÍ TECHNICKÉ V BRNĚ. Fakulta elektrotechniky a komunikačních technologií
 VYSOKÉ UČENÍ TECHNICKÉ V BRNĚ Fakulta elektrotechniky a komunikačních technologií Semestrální projekt Vyhodnocení přesnosti sebelokalizace Vedoucí práce: Ing. Tomáš Jílek Vypracovali: Michaela Homzová,
Zápočtová práce STATISTIKA I
 Zápočtová práce STATISTIKA I Obsah: - úvodní stránka - charakteristika dat (původ dat, důvod zpracování,...) - výpis naměřených hodnot (v tabulce) - zpracování dat (buď bodové nebo intervalové, podle charakteru
DISPERZNÍ KŘIVKY V DESCE S KUBICKOU ANIZOTROPIÍ
 DISPERZNÍ KŘIVKY V DESCE S KUBICKOU ANIZOTROPIÍ P. Hora, O. Červená Ústav termomechaniky AV ČR Příspěvek vznikl na základě podpory grantu cíleného vývoje a výzkumu AV ČR č. IBS276356 Ultrazvukové metody
Výzkumné centrum spalovacích motorů a automobilů Josefa Božka - Kolokvium Božek 2010, Praha 7.12.2011 -
 53A107 Systematický výzkum vlastností vybraného konstrukčního materiálu (litina, slitiny lehkých kovů) typického pro teplotně exponované díly motoru (hlava, blok, skříně turbodmychadla ) s ohledem na kombinované
GIS Geografické informační systémy
 GIS Geografické informační systémy Obsah přednášky Prostorové vektorové modely Špagetový model Topologický model Převody geometrií Vektorový model Reprezentuje reálný svět po jednotlivých složkách popisu
RNDr. Eva Janoušová doc. RNDr. Ladislav Dušek, Dr.
 Analýza dat pro Neurovědy RNDr. Eva Janoušová doc. RNDr. Ladislav Dušek, Dr. Jaro 2014 Institut biostatistiky Janoušová, a analýz Dušek: Analýza dat pro neurovědy Blok 7 Jak hodnotit vztah spojitých proměnných
Bioimaging rostlinných buněk, CV.2
 Bioimaging rostlinných buněk, CV.2 Konstrukce mikroskopu (optika, fyzikální principy...) Rozlišení - kontrast Live cell microscopy Modulace kontrastu (Phase contrast, DIC) Videomikroskopia Nízký kontrast
Výzkum komunikačního účinku propagace firmy GOTECH s.r.o. Eva Solařová
 Výzkum komunikačního účinku propagace firmy GOTECH s.r.o. Eva Solařová Bakalářská práce 2008 ABSTRAKT Tato bakalářská práce se zabývá analýzou marketingové komunikace firmy GOTECH s.r.o. Rozbor probíhá
Kontraktantní/dilatantní
 Kontraktantní/dilatantní plasticita - úhel dilatance směr přírůstku plastické deformace Na základě experimentálního měření dospěl St. Venant k závěru, že směry hlavních napětí jsou totožné se směry přírůstku
7. Rozdělení pravděpodobnosti ve statistice
 7. Rozdělení pravděpodobnosti ve statistice Statistika nuda je, má však cenné údaje, neklesejte na mysli, ona nám to vyčíslí Jednou z úloh statistiky je odhad (výpočet) hodnot statistického znaku x i,
S E M E S T R Á L N Í
 Univerzita Pardubice Fakulta chemicko-technologická Katedra analytické chemie S E M E S T R Á L N Í P R Á C E Licenční studium Statistické zpracování dat při managementu jakosti Předmět ANOVA analýza rozptylu
vztažný systém obecné napětí předchozí OBSAH další
 p05 1 5. Deformace těles S deformací jako složkou mechanického pohybu jste se setkali už ve statice. Běžně je chápána jako změna rozměrů a tvaru tělesa. Lze ji popsat změnami vzdáleností různých dvou bodů
Globální matice konstrukce
 Globální matice konstrukce Z matic tuhosti a hmotnosti jednotlivých prvků lze sestavit globální matici tuhosti a globální matici hmotnosti konstrukce, které se využijí v řešení základní rovnice MKP: [m]{
Metoda backward výběru proměnných v lineární regresi a její vlastnosti
 Metoda backward výběru proměnných v lineární regresi a její vlastnosti Aktuárský seminář, 13. dubna 2018 Milan Bašta 1 / 30 1 Metody výběru proměnných do modelu 2 Monte Carlo simulace, backward metoda
SYLABUS PŘEDNÁŠKY 10 Z GEODÉZIE 1
 SYLABUS PŘEDNÁŠKY 10 Z GEODÉZIE 1 (Souřadnicové výpočty 4, Orientace osnovy vodorovných směrů) 1. ročník bakalářského studia studijní program G studijní obor G doc. Ing. Jaromír Procházka, CSc. prosinec
Testování hypotéz o parametrech regresního modelu
 Statistika II Katedra ekonometrie FVL UO Brno kancelář 69a, tel. 973 442029 email:jiri.neubauer@unob.cz Lineární regresní model kde Y = Xβ + e, y 1 e 1 β y 2 Y =., e = e 2 x 11 x 1 1k., X =....... β 2,
Plánování experimentu
 Fakulta chemicko technologická Katedra analytické chemie licenční studium Management systému jakosti Autor: Ing. Radek Růčka Přednášející: Prof. Ing. Jiří Militký, CSc. 1. LEPTÁNÍ PLAZMOU 1.1 Zadání Proces
KTE/TEVS - Rychlá Fourierova transformace. Pavel Karban. Katedra teoretické elektrotechniky Fakulta elektrotechnická Západočeská univerzita v Plzni
 KTE/TEVS - Rychlá Fourierova transformace Pavel Karban Katedra teoretické elektrotechniky Fakulta elektrotechnická Západočeská univerzita v Plzni 10.11.011 Outline 1 Motivace FT Fourierova transformace
1. Statistická analýza dat Jak vznikají informace Rozložení dat
 1. Statistická analýza dat Jak vznikají informace Rozložení dat J. Jarkovský, L. Dušek, S. Littnerová, J. Kalina Význam statistické analýzy dat Sběr a vyhodnocování dat je způsobem k uchopení a pochopení
31. 3. 2014, Brno Hanuš Vavrčík Základy statistiky ve vědě
 31. 3. 2014, Brno Hanuš Vavrčík Základy statistiky ve vědě Motto Statistika nuda je, má však cenné údaje. strana 3 Statistické charakteristiky Charakteristiky polohy jsou kolem ní seskupeny ostatní hodnoty
UNIVERZITA PARDUBICE FAKULTA CHEMICKO-TECHNOLOGICKÁ DISERTAČNÍ PRÁCE
 UNIVERZITA PARDUBICE FAKULTA CHEMICKO-TECHNOLOGICKÁ DISERTAČNÍ PRÁCE 2009 Ing. David Kahoun UNIVERZITA PARDUBICE FAKULTA CHEMICKO-TECHNOLOGICKÁ ANALÝZA BIOLOGICKY AKTIVNÍCH LÁTEK V MEDOVINÁCH METODOU HPLC
KGG/STG Statistika pro geografy
 KGG/STG Statistika pro geografy 5. Odhady parametrů základního souboru Mgr. David Fiedor 16. března 2015 Vztahy mezi výběrovým a základním souborem Osnova 1 Úvod, pojmy Vztahy mezi výběrovým a základním
Algoritmy a struktury neuropočítačů ASN - P11
 Aplikace UNS při rozpoznání obrazů Základní úloha segmentace obrazu rozdělení obrazu do několika významných oblastí klasifikační úloha, clusterová analýza target Metody Kohonenova metoda KSOM Kohonenova
Testování hypotéz o parametrech regresního modelu
 Testování hypotéz o parametrech regresního modelu Ekonometrie Jiří Neubauer Katedra kvantitativních metod FVL UO Brno kancelář 69a, tel. 973 442029 email:jiri.neubauer@unob.cz Jiří Neubauer (Katedra UO
SEMESTRÁLNÍ PRÁCE. Leptání plasmou. Ing. Pavel Bouchalík
 SEMESTRÁLNÍ PRÁCE Leptání plasmou Ing. Pavel Bouchalík 1. ÚVOD Tato semestrální práce obsahuje písemné vypracování řešení příkladu Leptání plasmou. Jde o praktickou zkoušku znalostí získaných při přednáškách
VLIV OKRAJOVÝCH PODMÍNEK NA VÝSLEDEK ZKOUŠKY TEPELNÉHO VÝKONU SOLÁRNÍHO KOLEKTORU
 Energeticky efektivní budovy 2015 sympozium Společnosti pro techniku prostředí 15. října 2015, Buštěhrad VLIV OKRAJOVÝCH PODMÍNEK NA VÝSLEDEK ZKOUŠKY TEPELNÉHO VÝKONU SOLÁRNÍHO KOLEKTORU Bořivoj Šourek,
Zobrazování těles. problematika geometrického modelování. základní typy modelů. datové reprezentace modelů základní metody geometrického modelování
 problematika geometrického modelování manifold, Eulerova rovnost základní typy modelů hranový model stěnový model objemový model datové reprezentace modelů základní metody geometrického modelování těleso
Fourierovské metody v teorii difrakce a ve strukturní analýze
 Osnova přednášky na 31 kolokviu Krystalografické společnosti Výpočetní metody v rtg a neutronové strukturní analýze Nové Hrady, 16 20 6 2003 Fourierovské metody v teorii difrakce a ve strukturní analýze